|

Why being an early buyer of Polygon’s Matic price is not advised

  • Matic price shows bullish divergence on the 2-day chart.
  • The volume pattern shows a significant difference in the last two declines.
  • Invalidation of the current downtrend could be a breach above $0.72

MATIC price shows subtle signs that the downtrend could be coming to an end. Still, being an early buyer is not recommended.

MATIC price bulls need to retaliate

Polygon’s MATIC price trades on exchanges at $0.40 At the current time of writing. The bulls managed to produce a bullish engulfing candle with an increased spike in volume this week which could induce a rally towards $0.56. Still, the downtrend remains intact from a macro perspective. 

MATIC price shows a divergence between the May 11th decline and the recent display of bearish fury during the 3rd week of June on the Relative Strength Index. The divergence accompanied by the overall decrease in volume warrants the idea that the downtrend is ending. However, being an early buyer is not advised because the bears could still trigger a decline to $0.25 after reaching the bullish targets mentioned above.

tm/matic/6/17/22

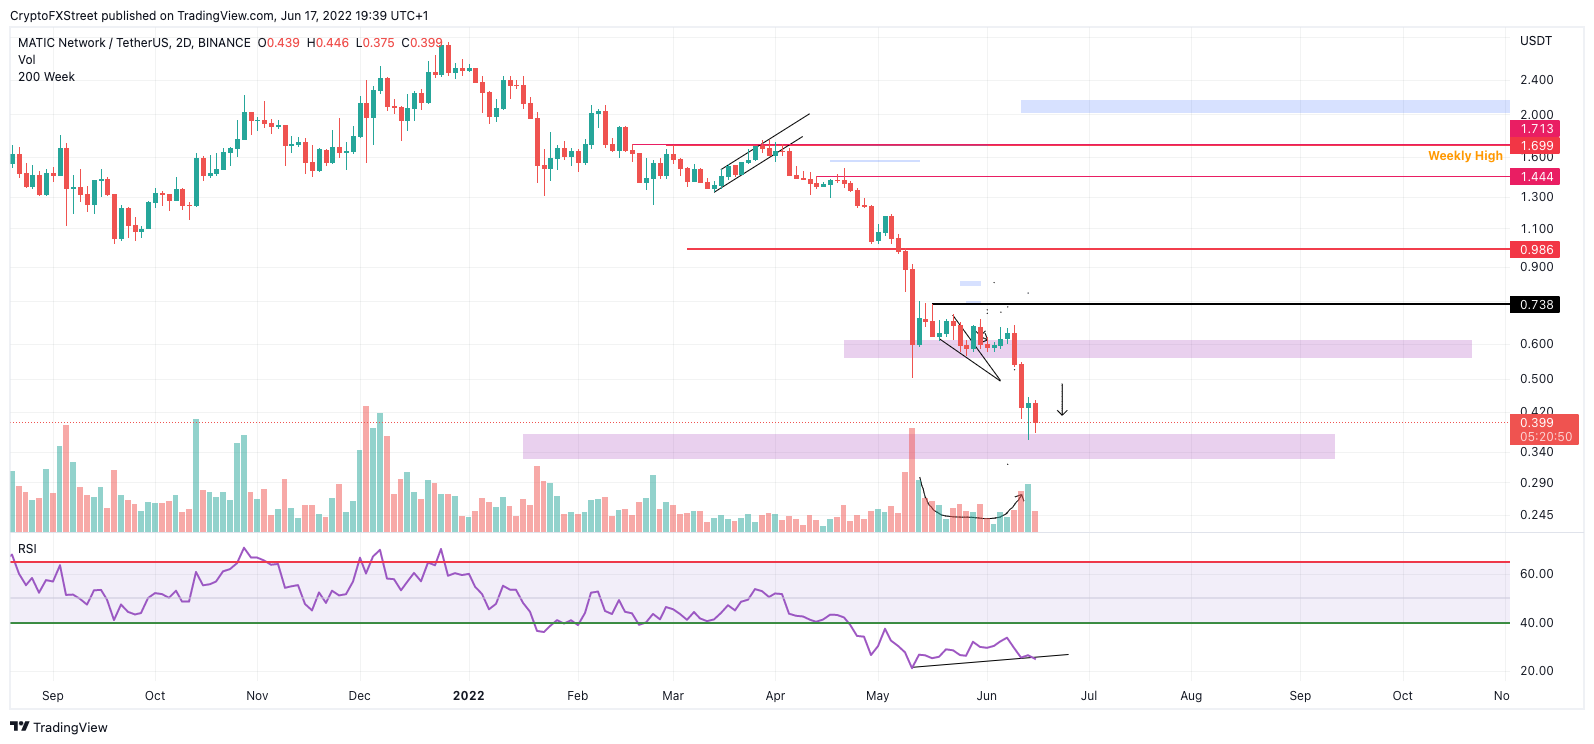
MATIC/USDT 2-Day Chart

The safest way to invalidate the bearish downtrend will be a breach above $0.72. If this occurs, a rally could ensue towards $0.80, followed by a three-wave pullback. Traders and investors could then partake in the next bull rally with confidence targeting the $.1.20 zone resulting in a 200% increase from the current MATIC price.

Author

Tony M.

Tony M.

FXStreet Contributor

Tony Montpeirous began investing in cryptocurrencies in 2017. His trading style incorporates Elliot Wave, Auction Market Theory, Fibonacci and price action as the cornerstone of his technical analysis.

More from Tony M.
Share:

Editor's Picks

Grass 20% bullish breakout defies broader market weakness

Grass (GRASS) is edging up above $0.30 at the time of writing on Monday. The token’s notable 20% intraday surge stands out amid heightened volatility in the broader crypto market.

XRP slides as US-Iran war weakens sentiment

Ripple remains under pressure, trading around $1.35 at the time of writing on Monday. The remittance token extended its down leg to $1.27 on Saturday after the US, in collaboration with Israel, launched attacks on Iran, killing the nation’s Supreme Leader, Ali Khamenei.

Crypto Today: Bitcoin pares losses, Ethereum and XRP drift lower as Middle East conflict pressures risk assets

Bitcoin, Ethereum and Ripple remain on edge as the Israel-US war on Iran risk-off sentiment. The Crypto King trades above $66,000 at the time of writing on Monday, but is struggling to break through the seller congestion around $67,000.

Bitcoin on brink of breakdown amid US-Iran war

Bitcoin (BTC) remains under pressure near the key support level of $65,700. Trading at $66,400 at the time of writing on Monday, a breakdown below this critical level would suggest a deeper correction ahead.

Bitcoin Price Annual Forecast: BTC holds long-term bullish structure heading into 2026

Bitcoin (BTC) is wrapping up 2025 as one of its most eventful years, defined by unprecedented institutional participation, major regulatory developments, and extreme price volatility.

Bitcoin: Another month of losses, and it’s been five

Bitcoin (BTC) price is stabilizing around $68,000 at the time of writing on Friday, but the Crypto King is poised to close February on a fragile footing, marking its fifth consecutive month of losses since October and a rare start to the year with back-to-back monthly corrections.