• Axie Infinity price has formed a head-andshoulders pattern, indicating that there could be a further move south.
  • There might be a minor upswing to $28 before AXS reaches its target of $11.
  • A three-day candlestick close above $44 will invalidate the bearish thesis.

Axie Infinity price is traversing a massive top reversal pattern on the three-day chart. The recent crash is a taste of things to come for the massively inflated market value for AXS.

Axie Infinity price pauses

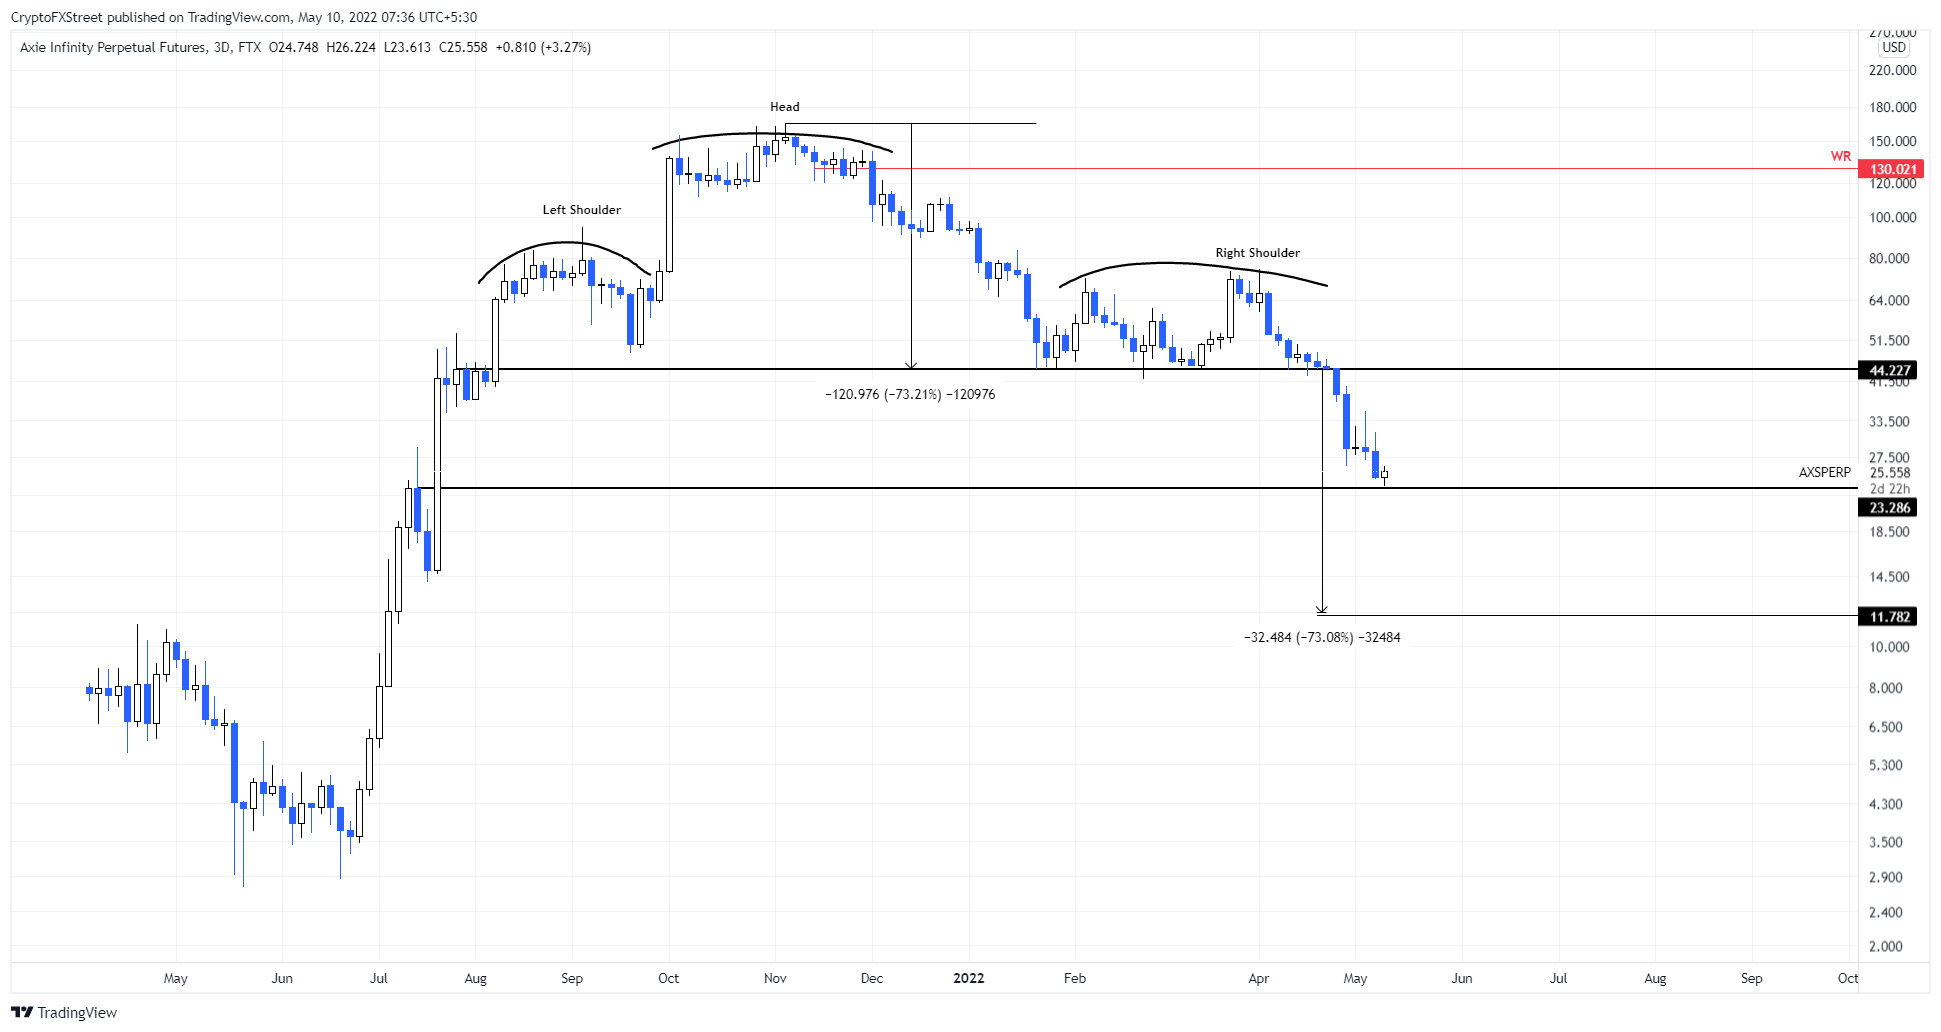
Axie Infinity price has formed a massive head-and-shoulders pattern over the last nine months. This technical formation contains three distinctive peaks, the one in the middle is the head and is the tallest. The two peaks on either side of the head are known as shoulders and are almost equal in height.

This technical formation forecasts a 73% downswing to $11, determined by adding the distance between the head’s peak and the neckline to the breakout point at $44. So far, Axie Infinity price has dropped 46% since its breakout on April 25; there is more to go.

As seen, Axie Infinity price needs to nosedive another 52% to reach its forecasted target at $11. However, this downswing might come after a 10% uptrend to $28 as AXS is currently tagging the $23 support level.

AXS/USDT 1-day chart

AXS/USDT 1-day chart

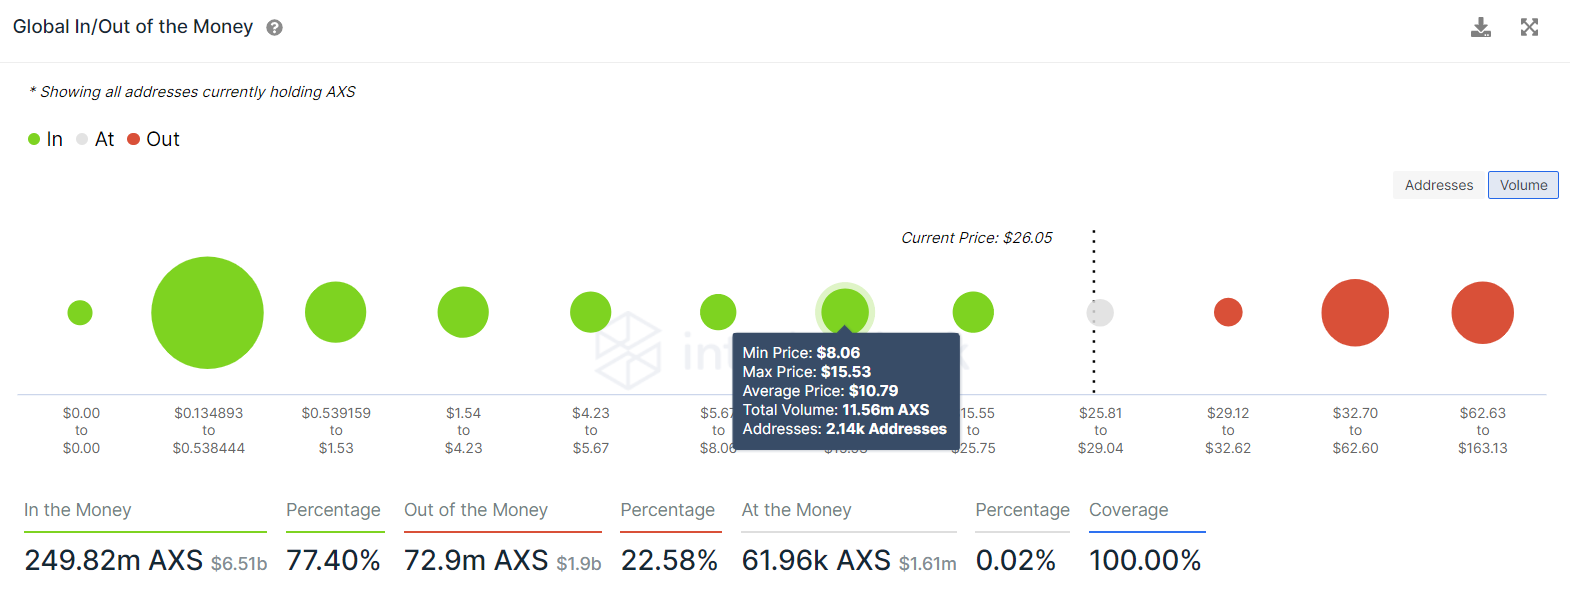
Supporting this steep descent for Axie Infinity price is IntoTheBlock’s Global In/Out of the Money (GIOM) model. This index shows that the immediate support level, extending from $15.53 to $8.06 is the only stable support level.

Here, roughly 2,100 addresses that purchased nearly 12 million AXS are “In the Money.” Interestingly, this support area coincides perfectly with the forecasts from the technical outlook. The holders in this area could absorb the selling pressure by adding more to their holdings, purging the downswing.

AXS GIOM

AXS GIOM 

While things are looking extremely bearish for Axie Infinity price, there will be a chance for bulls to recover. A three-day candlestick close above $44 will invalidate the head-and-shoulders’ bearish thesis for Axie Infinity price. In such a case, AXS could attempt to set a higher high above the right shoulder’s high at $75.45.


Information on these pages contains forward-looking statements that involve risks and uncertainties. Markets and instruments profiled on this page are for informational purposes only and should not in any way come across as a recommendation to buy or sell in these assets. You should do your own thorough research before making any investment decisions. FXStreet does not in any way guarantee that this information is free from mistakes, errors, or material misstatements. It also does not guarantee that this information is of a timely nature. Investing in Open Markets involves a great deal of risk, including the loss of all or a portion of your investment, as well as emotional distress. All risks, losses and costs associated with investing, including total loss of principal, are your responsibility. The views and opinions expressed in this article are those of the authors and do not necessarily reflect the official policy or position of FXStreet nor its advertisers. The author will not be held responsible for information that is found at the end of links posted on this page.

If not otherwise explicitly mentioned in the body of the article, at the time of writing, the author has no position in any stock mentioned in this article and no business relationship with any company mentioned. The author has not received compensation for writing this article, other than from FXStreet.

FXStreet and the author do not provide personalized recommendations. The author makes no representations as to the accuracy, completeness, or suitability of this information. FXStreet and the author will not be liable for any errors, omissions or any losses, injuries or damages arising from this information and its display or use. Errors and omissions excepted.

The author and FXStreet are not registered investment advisors and nothing in this article is intended to be investment advice.

Recommended content


Recommended Content

Editors’ Picks

Bitcoin to extend its consolidation between the $75,000 to $88,000 range

Bitcoin to extend its consolidation between the $75,000 to $88,000 range

Bitcoin price faces a slight rejection around the $85,000 resistance level on Wednesday after recovering 3.16% the previous day. A K33 report highlights that Cryptocurrencies and Equities have largely de-risked going into Donald Trump’s “Liberation Day” on Wednesday. 

More Bitcoin News
Maker, Gala and Polygon lead $100k whale transactions, can altcoins defy looming macro uncertainty?

Maker, Gala and Polygon lead $100k whale transactions, can altcoins defy looming macro uncertainty?

Maker (MKR), GALA, and Polygon (POL) are among the crypto projects that have seen a spike in whale transactions of at least $100,000 in the past week, as revealed by Santiment on-chain data. 

More Cryptocurrencies News
Cardano and Binance Coin Price Forecast: Altcoins ADA and BNB show weakness in momentum indicators

Cardano and Binance Coin Price Forecast: Altcoins ADA and BNB show weakness in momentum indicators

Cardano (ADA) and Binance Coin (BNB) prices edge slightly down, trading around $0.66 and $598, respectively, at the time of writing on Wednesday after a mild recovery so far this week.

More Cryptocurrencies News
Public firms turn balance sheets into Bitcoin vaults: Gamestop raises $1.5 billion; Metaplanet adds 160 BTC

Public firms turn balance sheets into Bitcoin vaults: Gamestop raises $1.5 billion; Metaplanet adds 160 BTC

Public companies are increasingly converting their balance sheets into Bitcoin reserves. Gamestop (GME) has raised $1.5 billion in capital, with potential plans to allocate part of the funds toward expanding its Bitcoin treasury.

More Cryptocurrencies News
Bitcoin: BTC remains calm before a storm

Bitcoin: BTC remains calm before a storm

Bitcoin's price has been consolidating between $85,000 and $88,000 this week. A K33 report explains how the markets are relatively calm and shaping up for volatility as traders absorb the tariff announcements. PlanB’s S2F model shows that Bitcoin looks extremely undervalued compared to Gold and the housing market.

Read full analysis
The Best brokers to trade EUR/USD

The Best brokers to trade EUR/USD

SPONSORED Discover the top brokers for trading EUR/USD in 2025. Our list features brokers with competitive spreads, fast execution, and powerful platforms. Whether you're a beginner or an expert, find the right partner to navigate the dynamic Forex market.

Read More

BTC

ETH

XRP