Why are whales buying LINK in droves as Chainlink price bleeds?
- LINK whales are busy accumulating, oblivious to the 2022 bear market.
- Chainlink price is back on the drawing board, with support at $6.20 expected to hold.
- A month-long falling channel on the four-hour chart could limit whales' effort toward a bullish turnaround.
-637336005550289133_XtraLarge.jpg)
Chainlink price downtrend will likely grind to a halt in the short term and reverse direction, reaching out for a sustainable northbound move if investor activity, especially among whales, upholds a seven-month uptrend.
The live price feed oracle token trades at $6.53 at the time of writing, representing a 23.64% decline from its September peak at around $8.55. A bullish trend reversal is anticipated any time from now. However, investors should not panic if LINK stretches the down leg to $6.20 (robust support) before bouncing to the upside.
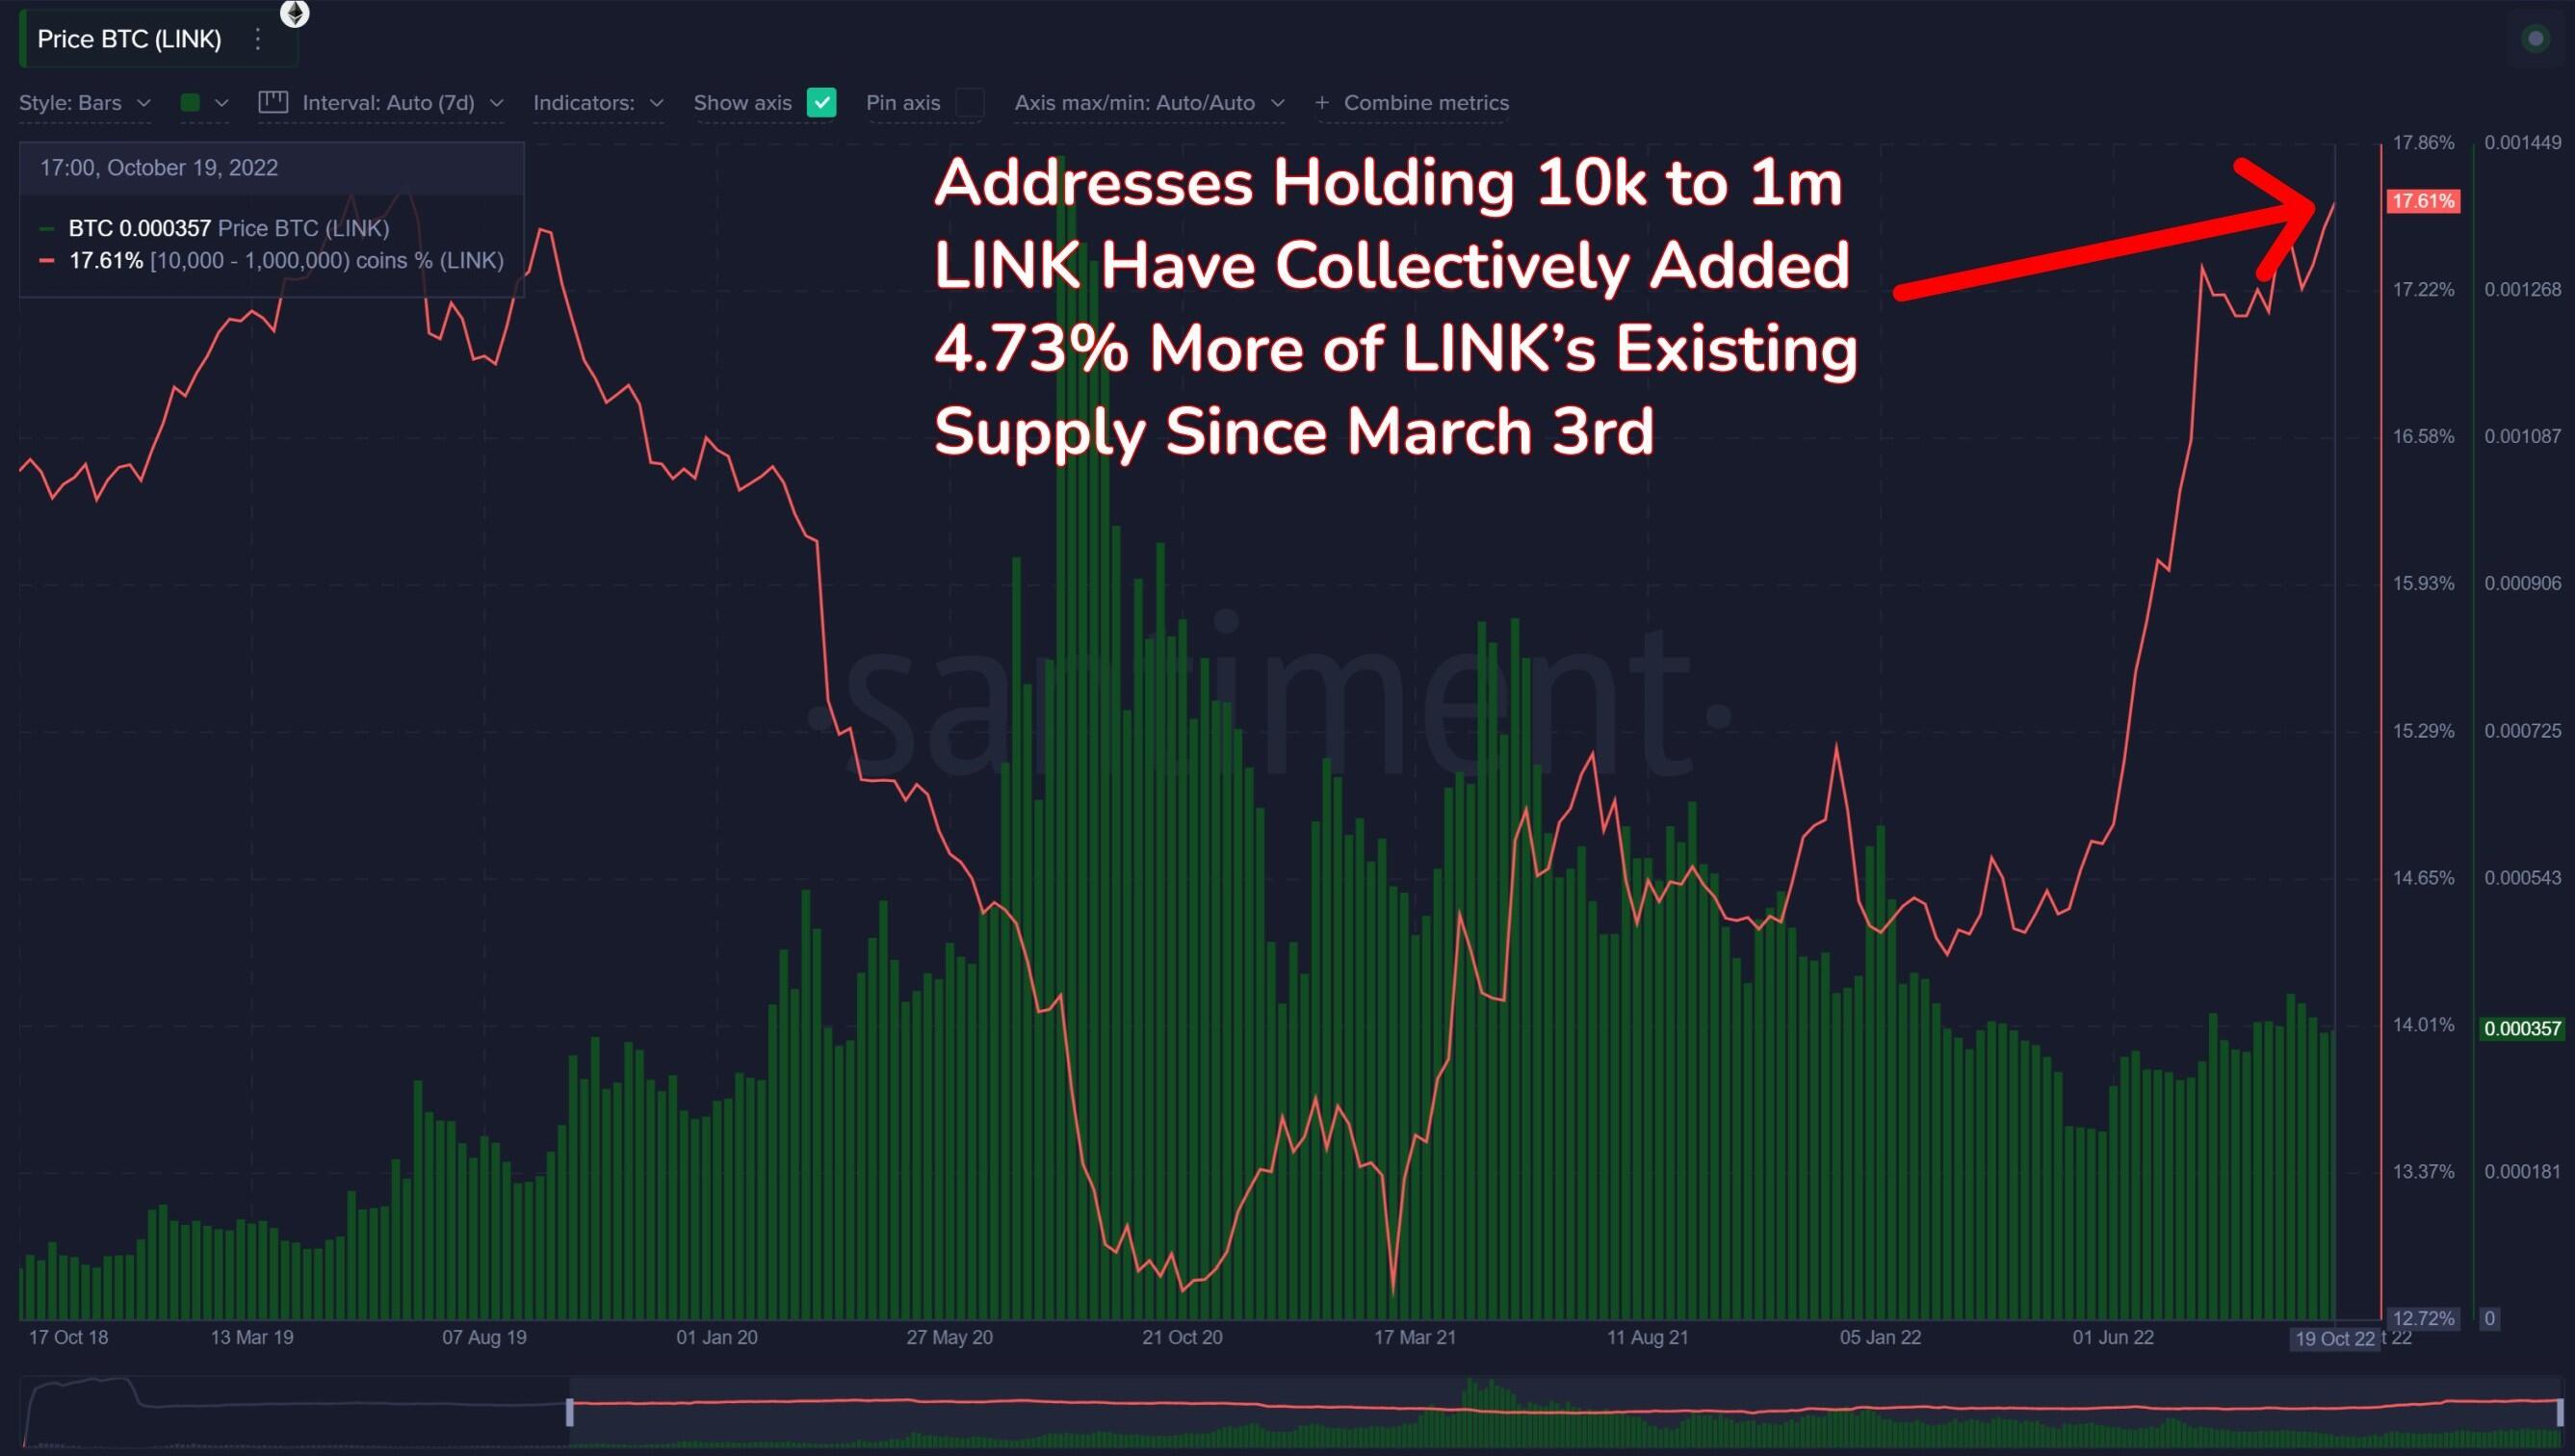
Chainlink whales are buying their way through the bear market
Over the past year, addresses holding between 10,000 to 1 million LINK tokens have accumulated an additional 4.73% of the network's existing supply. This translates to 47.31 million LINK worth $307.52 million at the market rate.
Chainlink Supply Distribution
The MVRV (Market Value Realized Value), an on-chain metric from Santiment, shows that investors are unlikely to lose hope for a substantial rebound. This on-chain index highlights the profit or loss of LINK holders. It follows the price at which each token last moved compared to its current market value.
A negative MVRV reading, like in the case of Chainlink, implies that the token is undervalued. Since the price tends to correct to the fair market value, a trend correction could be bolstered by the pressure from the whales as they fill their bags.
 [16.02.59, 21 Oct, 2022]-638019587064651338.png)
Chainlink MVRV ratio
Chainlink price closes in on a robust support
The falling parallel channel's lower boundary supports LINK price at $6.44. Over the last four weeks, the price bounced off this level twice, making it a viable support area. A new bullish move will surface if this level is defended at all costs to guide Chainlink price to the pattern's upper boundary. Bulls could stage a coup here for a breakout to $8.00, a move to $8.50 in the cards.
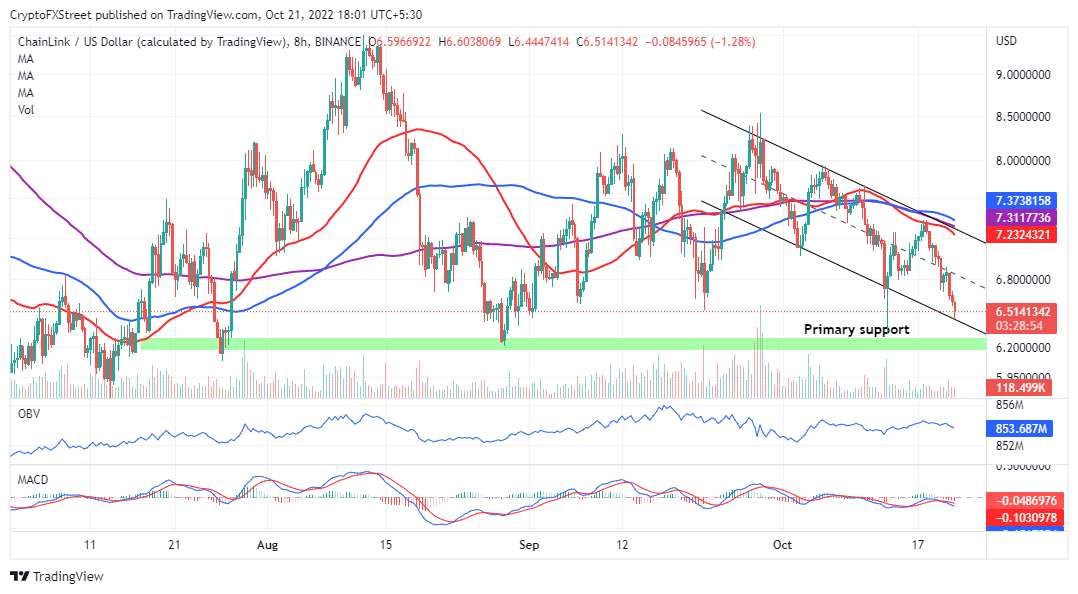
LINK/USD eight-hour chart
On the other hand, the MACD (Moving Average Convergence Divergence (MACD) indicator recently presented traders with a sell signal. The odds inclined on the bearish side as the 12-day EMA (Exponential Moving Average), blue, crossed below the 26-day EMA, red.
Therefore, long orders are not recommended yet – not until LINK exhausts the downtrend and affirms support. Stubbornly bearish investors could keep shorting Chainlink price but consider support at $6.20, a potential take-profit level.
Author

John Isige
FXStreet
John Isige is a seasoned cryptocurrency journalist and markets analyst committed to delivering high-quality, actionable insights tailored to traders, investors, and crypto enthusiasts. He enjoys deep dives into emerging Web3 tren


