Where are Bitcoin, Ethereum prices headed this Christmas?

Heading towards the end of 2021, crypto prices have continued to fluctuate, with Bitcoin and Ethereum, respectively , falling to their lowest levels in recent months.
As such, speculators are now looking for signs to show future opportunities that may arise in upcoming weeks. Below we will analyse the technicals of both markets, in order to obtain a clearer picture of where prices could be heading to, this Christmas.
Bitcoin
The sell-off in the world’s largest cryptocurrency continued to start the week, as prices of Bitcoin fell below the $50,000 level. BTCUSD hit an intraday low of $47,073 on Monday, which was its lowest level since October 1st.
This recent bear run, which began on November 10th, has seen BTC fall by over $20,000 in the past few weeks. Prices now seem to be oversold, with some longer-term Bitcoiners viewing this as an opportunity to “buy the dip”.
As you can see from the daily chart below, BTC is currently hovering just below $47,000, a level which has acted as support in the past. If you now look at the RSI, which covers a 14-day period, it will also show that the market volume is trading at 30, which historically signals relative weakness within a market.
This, along with the fact that prices are at a floor, would typically attract the attention of bulls anticipating a reversal, however if you look closer, you could potentially see that this may in fact be a “bull trap”.
BTC/USD – Daily chart
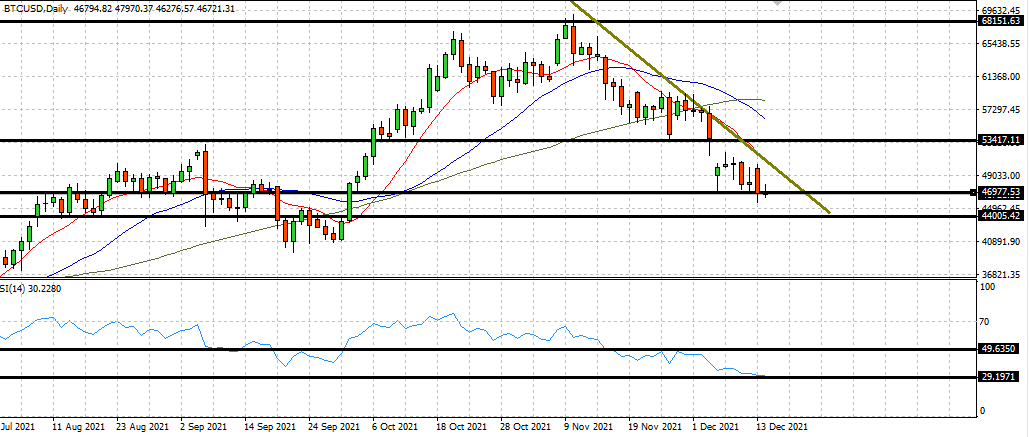
Reason being is that the momentum of the moving averages still appear to be bearish, despite some earlier crosses.
There are three SMA’s (simple moving averages) on this chart, the 10-day in red, 25-day in blue, and the 50-day in green. The initial downward cross that signalled the sell-off came as the 10-day, moved downwards against the 25-day. Both then moved below the 50-day, which usually is the sign for a sustained level of bearish pressure.
Despite this, that latest cross appears to be in its infancy, and if it were to mature further, BTC prices could track the current channel of the descending triangle, all the way to the longer-term floor of $44,000.
Ethereum
ETHUSD has declined by just over $1,000 since the beginning of November, where it hit an all-time high of $4,836. Similar to BTC, prices then slipped, with Ethereum now trading in the red for its fifth consecutive week.
Looking at the weekly chart below, you can see that prices are now trading slightly above support of $3,759, whilst the RSI consolidates at the 52 level, meaning that prices are neither overbought or oversold.
ETH/USD –Weekly chart
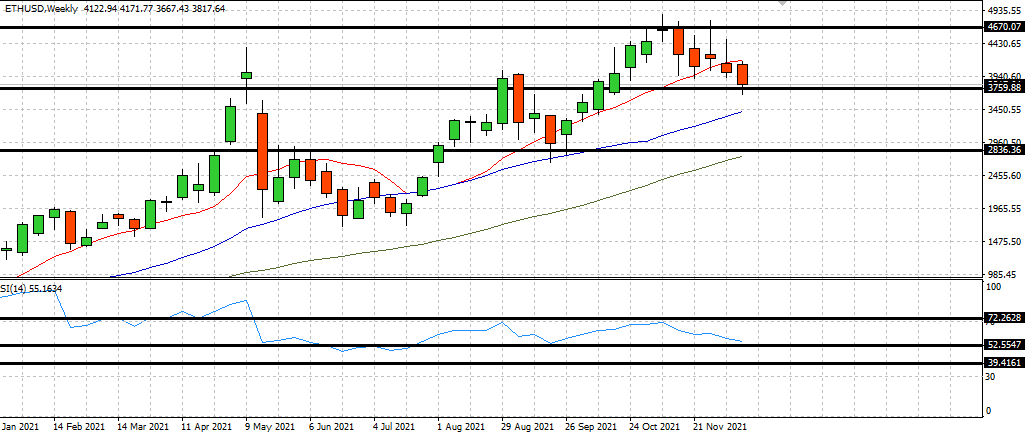
For the bears in the room, many will be anticipating a break below the current RSI floor of 52, as this could trigger a herd of sellers to enter, potentially pushing prices to the lower support point of $2,830.
Bulls on the other hand, will be paying attention to the buying power which took place the last time markets traded at the current price, and anticipate a price reversal back to resistance of $4,670.
Author

Eliman Dambell
Sayvio AI
With over a decade in financial markets, Eliman brings an experienced and diversified point of view to market analysis. He covers current and historical macro trends to give insights on Metals, FX, Stocks, and Crypto.


