What Solana price has in store as SOL NFT volume overshadows popular Ethereum NFT projects
- Solana price structure in the four-hour timeframe shows a bullish inverse head-and-shoulders pattern that forecasts a 36% rally.
- A similar pattern can be spotted in the weekly timeframe that hints at a 71% upswing.
- Additionally, investors seem to be making a comeback as SOL NFTs overshadow popular Ethereum NFT projects.

Solana price shows a bullish outlook on multiple timeframes suggesting that SOL is primed for a rally. Additionally, the fundamentals on the investor side of things also seem to be improving, adding a tailwind to the optimistic thesis.
Also read: Solana price provides the best buying opportunity before SOL explodes to $40
Solana price takes its time
Solana price has set up a bullish inverse head-and-shoulders setup on the 1-day timeframe. As mentioned in previous publications, this same setup has formed on the three-day and weekly timeframe as well.
The inverse head-and-shoulders pattern on the daily chart forecasts a 36% rally to $34.10, obtained by adding the distance between the right shoulder’s peak and head to the breakout point at $24.90.
Additionally, the bullish divergence setup on the daily timeframe makes this outlook for SOL compelling.
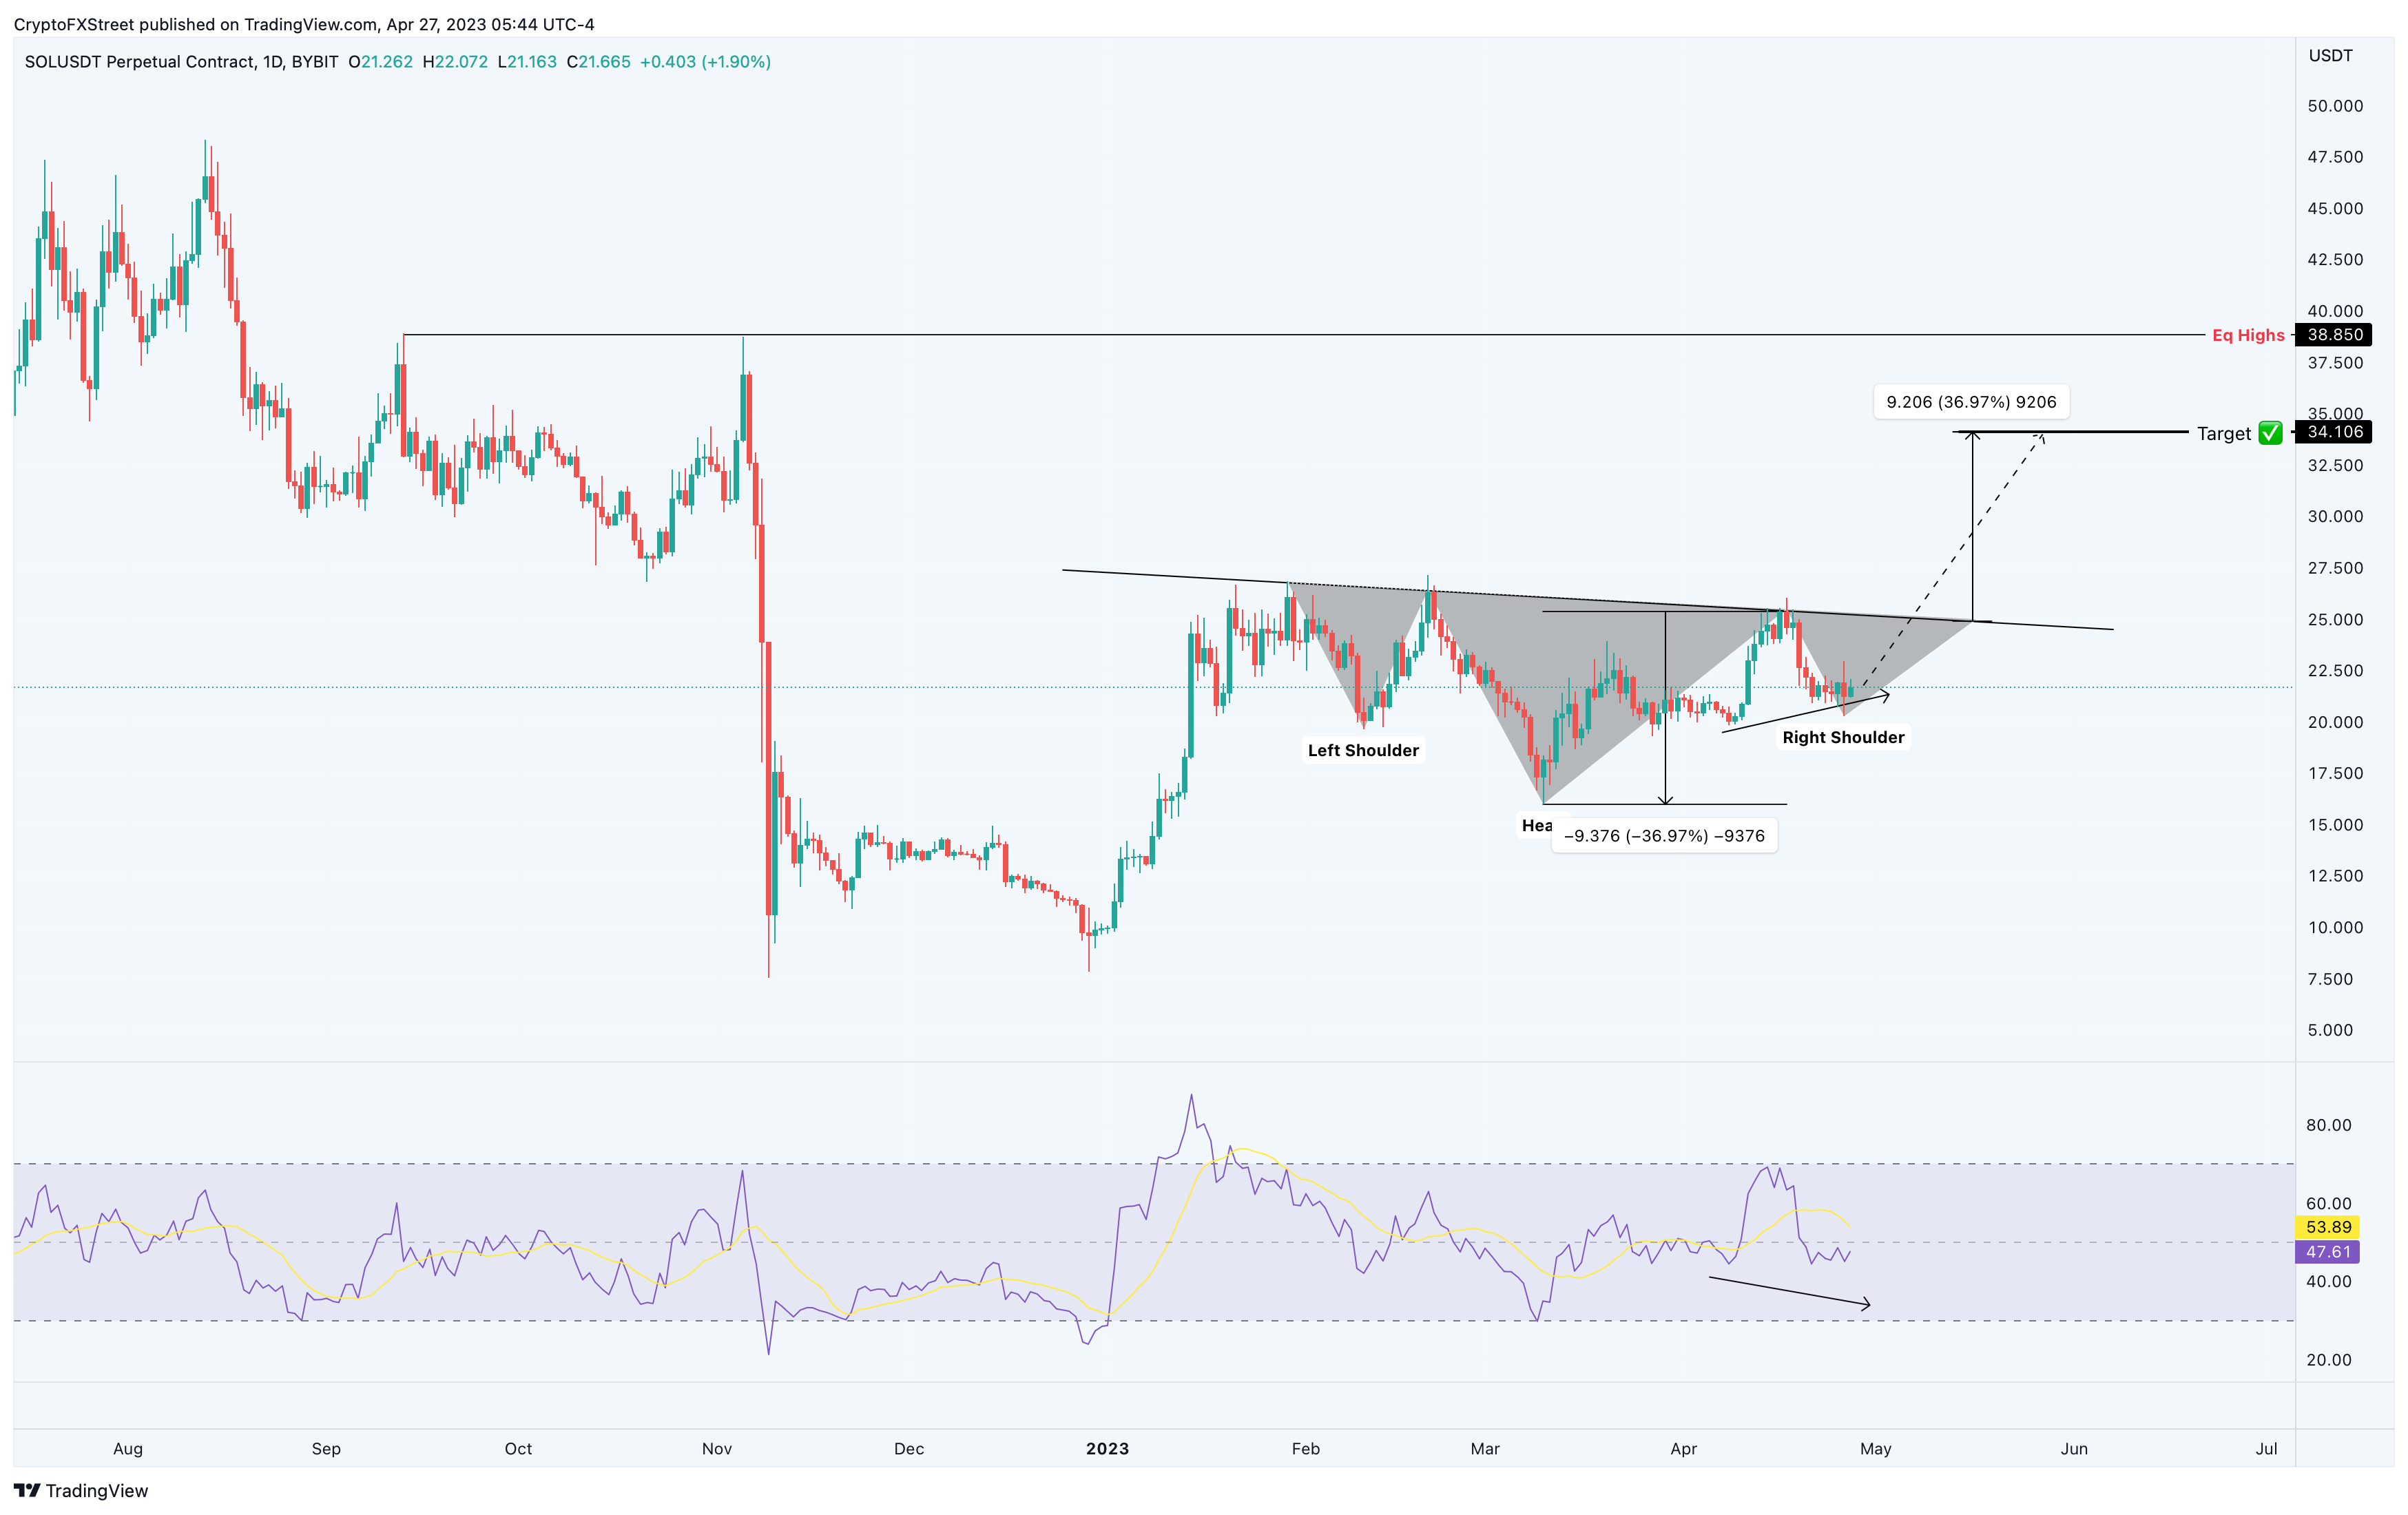
SOL/USDT 1-day chart
The second most interesting setup for Solana price can be spotted on the three-day or weekly chart, which is also an inverse head-and-shoulder setup. Unlike the one described above, however, this technical pattern has been in formation for almost a year. The target for the high timeframe setup is a 71% upswing to $37.21.
While these two forecasts suggest Solana price could head anywhere between $34 to $37, investors need to pay attention to the equal high formed at $38.92. The buy-stop liquidity resting above this high is the likely target for bulls.
Hence, Solana price rally should provide SOL holders an 80% gain from the current level, should this bullish outlook come to pass.
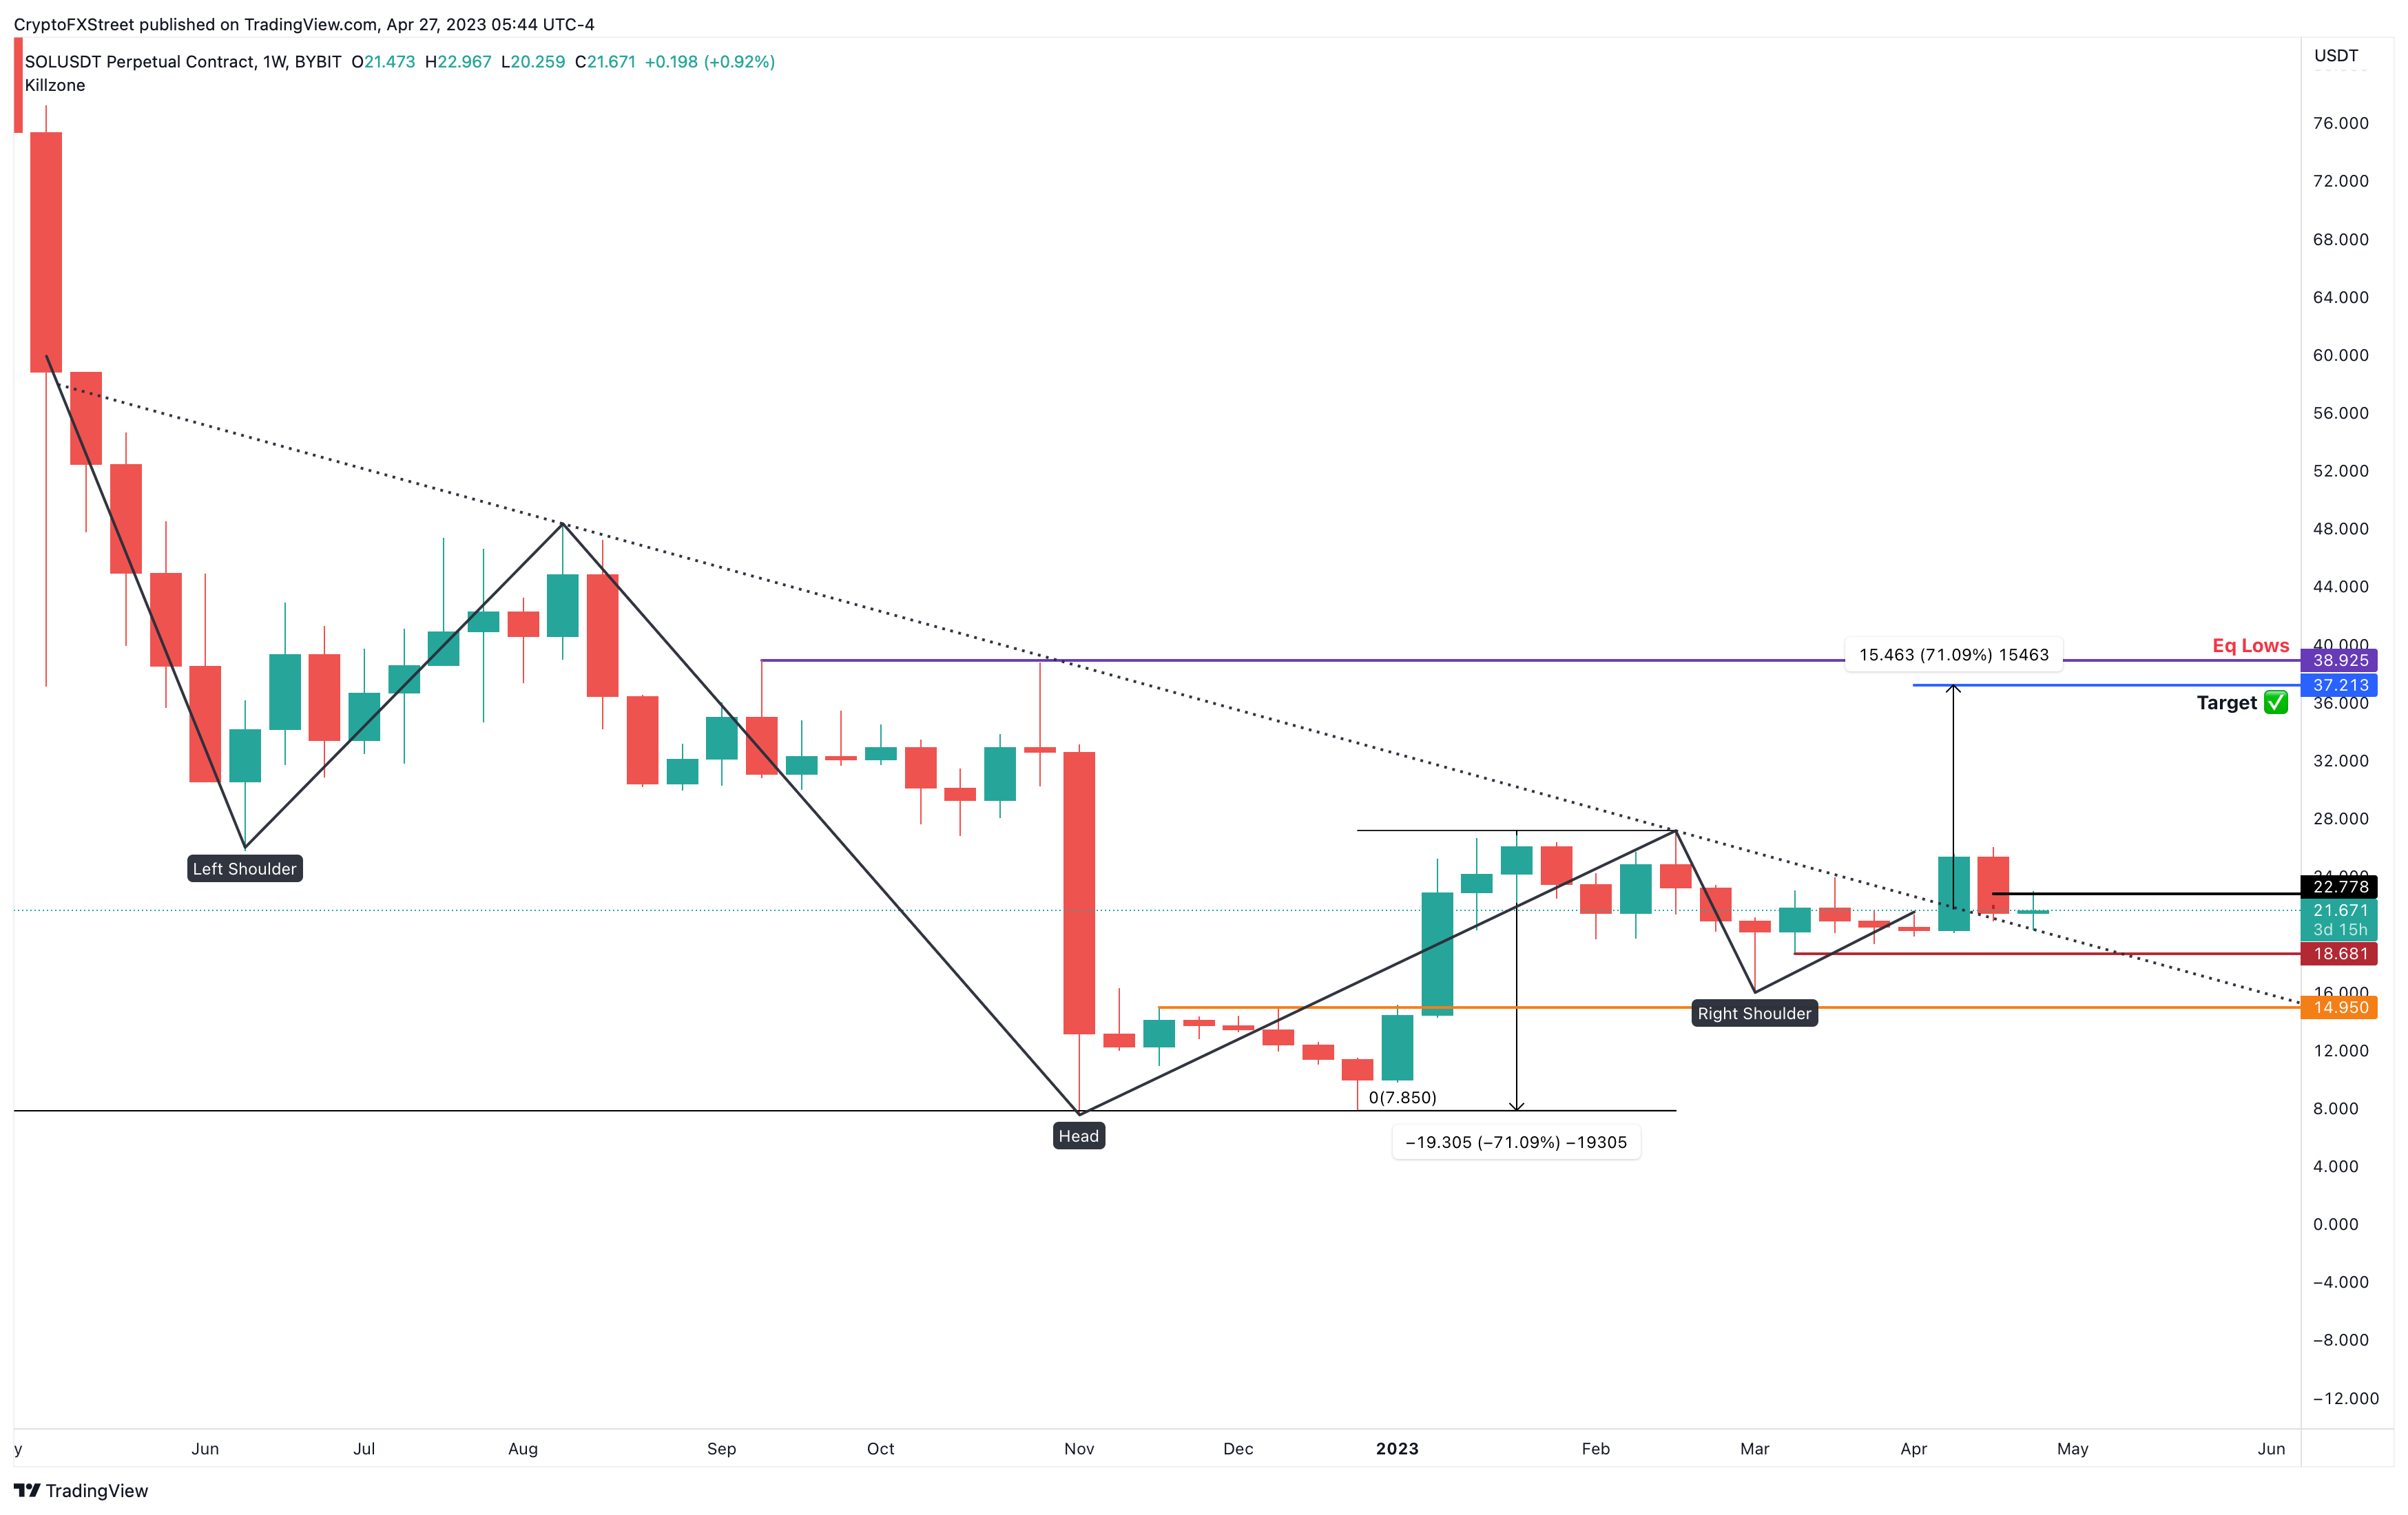
SOL/USDT 12-hour chart
On the other hand, if Solana price fails to launch higher and instead produces a decisive higher timeframe candlestick close below $18.68, it will invalidate the bullish thesis. This move would produce a lower low and skew the odds in bears’ favor and potentially trigger a 20% crash to $14.95.
Read more: Solana price could crash to $18.50 as SOL participants tanks by 60%
Solana NFTs take front-and-center stage
Solana NFTs’ seven-day volume, as seen in the image below, exceeded that of the popular Ethereum-based NFTs like Bored Ape Yacht Club and Mutant Ape Yacht Club. Solana-based Mad Lads breathed life into the SOL ecosystem after the FTX fallout.
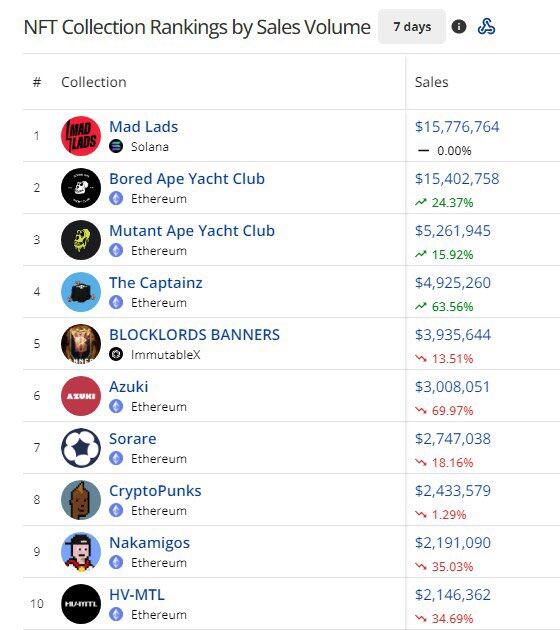
Top NFT projects by 7-day volume
To make things interesting, Solana Labs announced a new plugin that allows ChatGPT to interact directly with the SOL blockchain.
Due to these two reasons, the activity of Solana has made a comeback, which could be just the right time for SOL price to kick-start a quick and volatile rally.
Author

Akash Girimath
FXStreet
Akash Girimath is a Mechanical Engineer interested in the chaos of the financial markets. Trying to make sense of this convoluted yet fascinating space, he switched his engineering job to become a crypto reporter and analyst.


