|

What it will take to get the Solana price out of the gutter

  • Solana price edges near an ascending trendline, a breach could trigger a sellers’ frenzy.
  • SOL price auctions at levels last offered in July 2021, as it is amongst the top 10 biggest crypto losers this week. 
  • Early evidence to invalidate the bearish trend is a breach above $43.50.

Solana price shows strong macro technicals. Defining the true market bottom will be more challenging as SOL price could continue falling to $17.

Solana price is macro bullish but could fall in the short term

Solana price currently hovers at $35.45 as the bears are in control of the price action to start the second trading week of July. The 3-day chart shows the bears are inching away from breaching the counter-trend rally’s ascending trendline. This is a serious endeavor as a break of the ascending trend line could catalyze a 50% decline targeting $17. CoinMarketCap’s Top 10 Crypto Ranking confounds the potential for more decline as the Solana Market Cap is now ranked 9th, having witnessed one of the largest losses in net-value this week. 

Solana price from a macro perspective still has strong technicals. The centralized smart contract alternative has breached the Elliott-wave parallel t-end channel and shows a tapered volume pattern amidst the current downtrend. The current $35 price zone is certainly a discount as it was last auctioned in July of 2021 before an explosive 1,000% rally occurred. 
tm/sol/7/11/22

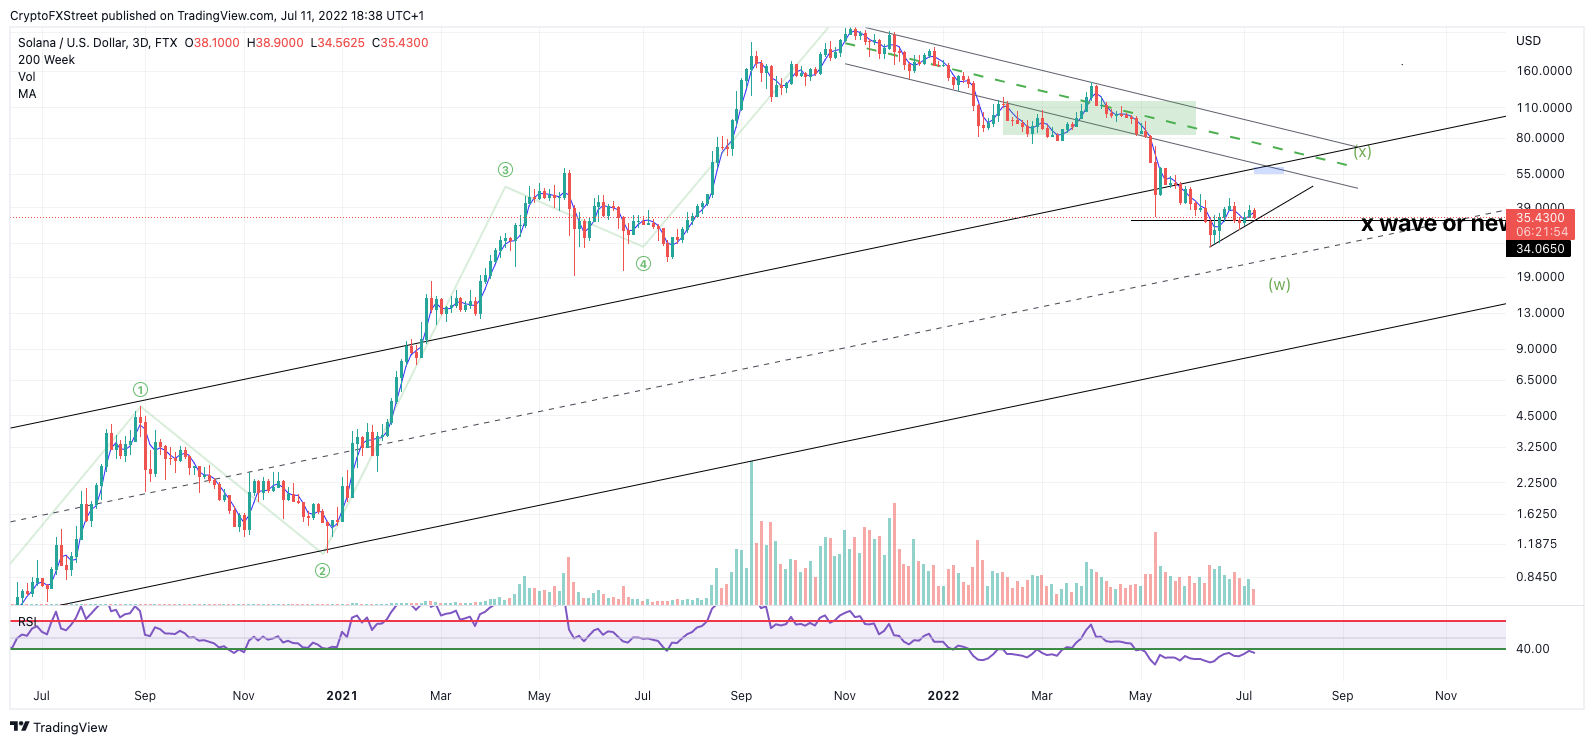
SOL/USDT 3-Day Chart
Nonetheless, defining a true market bottom is what every analyst in the crypto space is focused on these days. Buying the current Solana price is unwarranted unless the bulls can breach the $43.50 level. In doing so, they could invalidate the bearish trend and trigger a bull run towards $55, resulting in a 58% increase from the current Solana price.

Author

Tony M.

Tony M.

FXStreet Contributor

Tony Montpeirous began investing in cryptocurrencies in 2017. His trading style incorporates Elliot Wave, Auction Market Theory, Fibonacci and price action as the cornerstone of his technical analysis.

More from Tony M.
Share:

Editor's Picks

Grass 20% bullish breakout defies broader market weakness

Grass (GRASS) is edging up above $0.30 at the time of writing on Monday. The token’s notable 20% intraday surge stands out amid heightened volatility in the broader crypto market.

XRP slides as US-Iran war weakens sentiment

Ripple remains under pressure, trading around $1.35 at the time of writing on Monday. The remittance token extended its down leg to $1.27 on Saturday after the US, in collaboration with Israel, launched attacks on Iran, killing the nation’s Supreme Leader, Ali Khamenei.

Crypto Today: Bitcoin pares losses, Ethereum and XRP drift lower as Middle East conflict pressures risk assets

Bitcoin, Ethereum and Ripple remain on edge as the Israel-US war on Iran risk-off sentiment. The Crypto King trades above $66,000 at the time of writing on Monday, but is struggling to break through the seller congestion around $67,000.

Bitcoin on brink of breakdown amid US-Iran war

Bitcoin (BTC) remains under pressure near the key support level of $65,700. Trading at $66,400 at the time of writing on Monday, a breakdown below this critical level would suggest a deeper correction ahead.

Bitcoin Price Annual Forecast: BTC holds long-term bullish structure heading into 2026

Bitcoin (BTC) is wrapping up 2025 as one of its most eventful years, defined by unprecedented institutional participation, major regulatory developments, and extreme price volatility.

Bitcoin: Another month of losses, and it’s been five

Bitcoin (BTC) price is stabilizing around $68,000 at the time of writing on Friday, but the Crypto King is poised to close February on a fragile footing, marking its fifth consecutive month of losses since October and a rare start to the year with back-to-back monthly corrections.