What is an ascending triangle pattern and how to trade it?

Market analysts rely on many technical indicators to anticipate future trends, one of which is the very-popular ascending triangle chart pattern.
What is an ascending triangle pattern?
As the name indicates, an ascending triangle on a chart forms when the price consolidates between a rising trendline support and a horizontal trendline resistance.
The pattern typically appears during persistent uptrends or downtrends. Most technical analysts see it as a “continuation pattern,” meaning the general market trend is likely to resume.
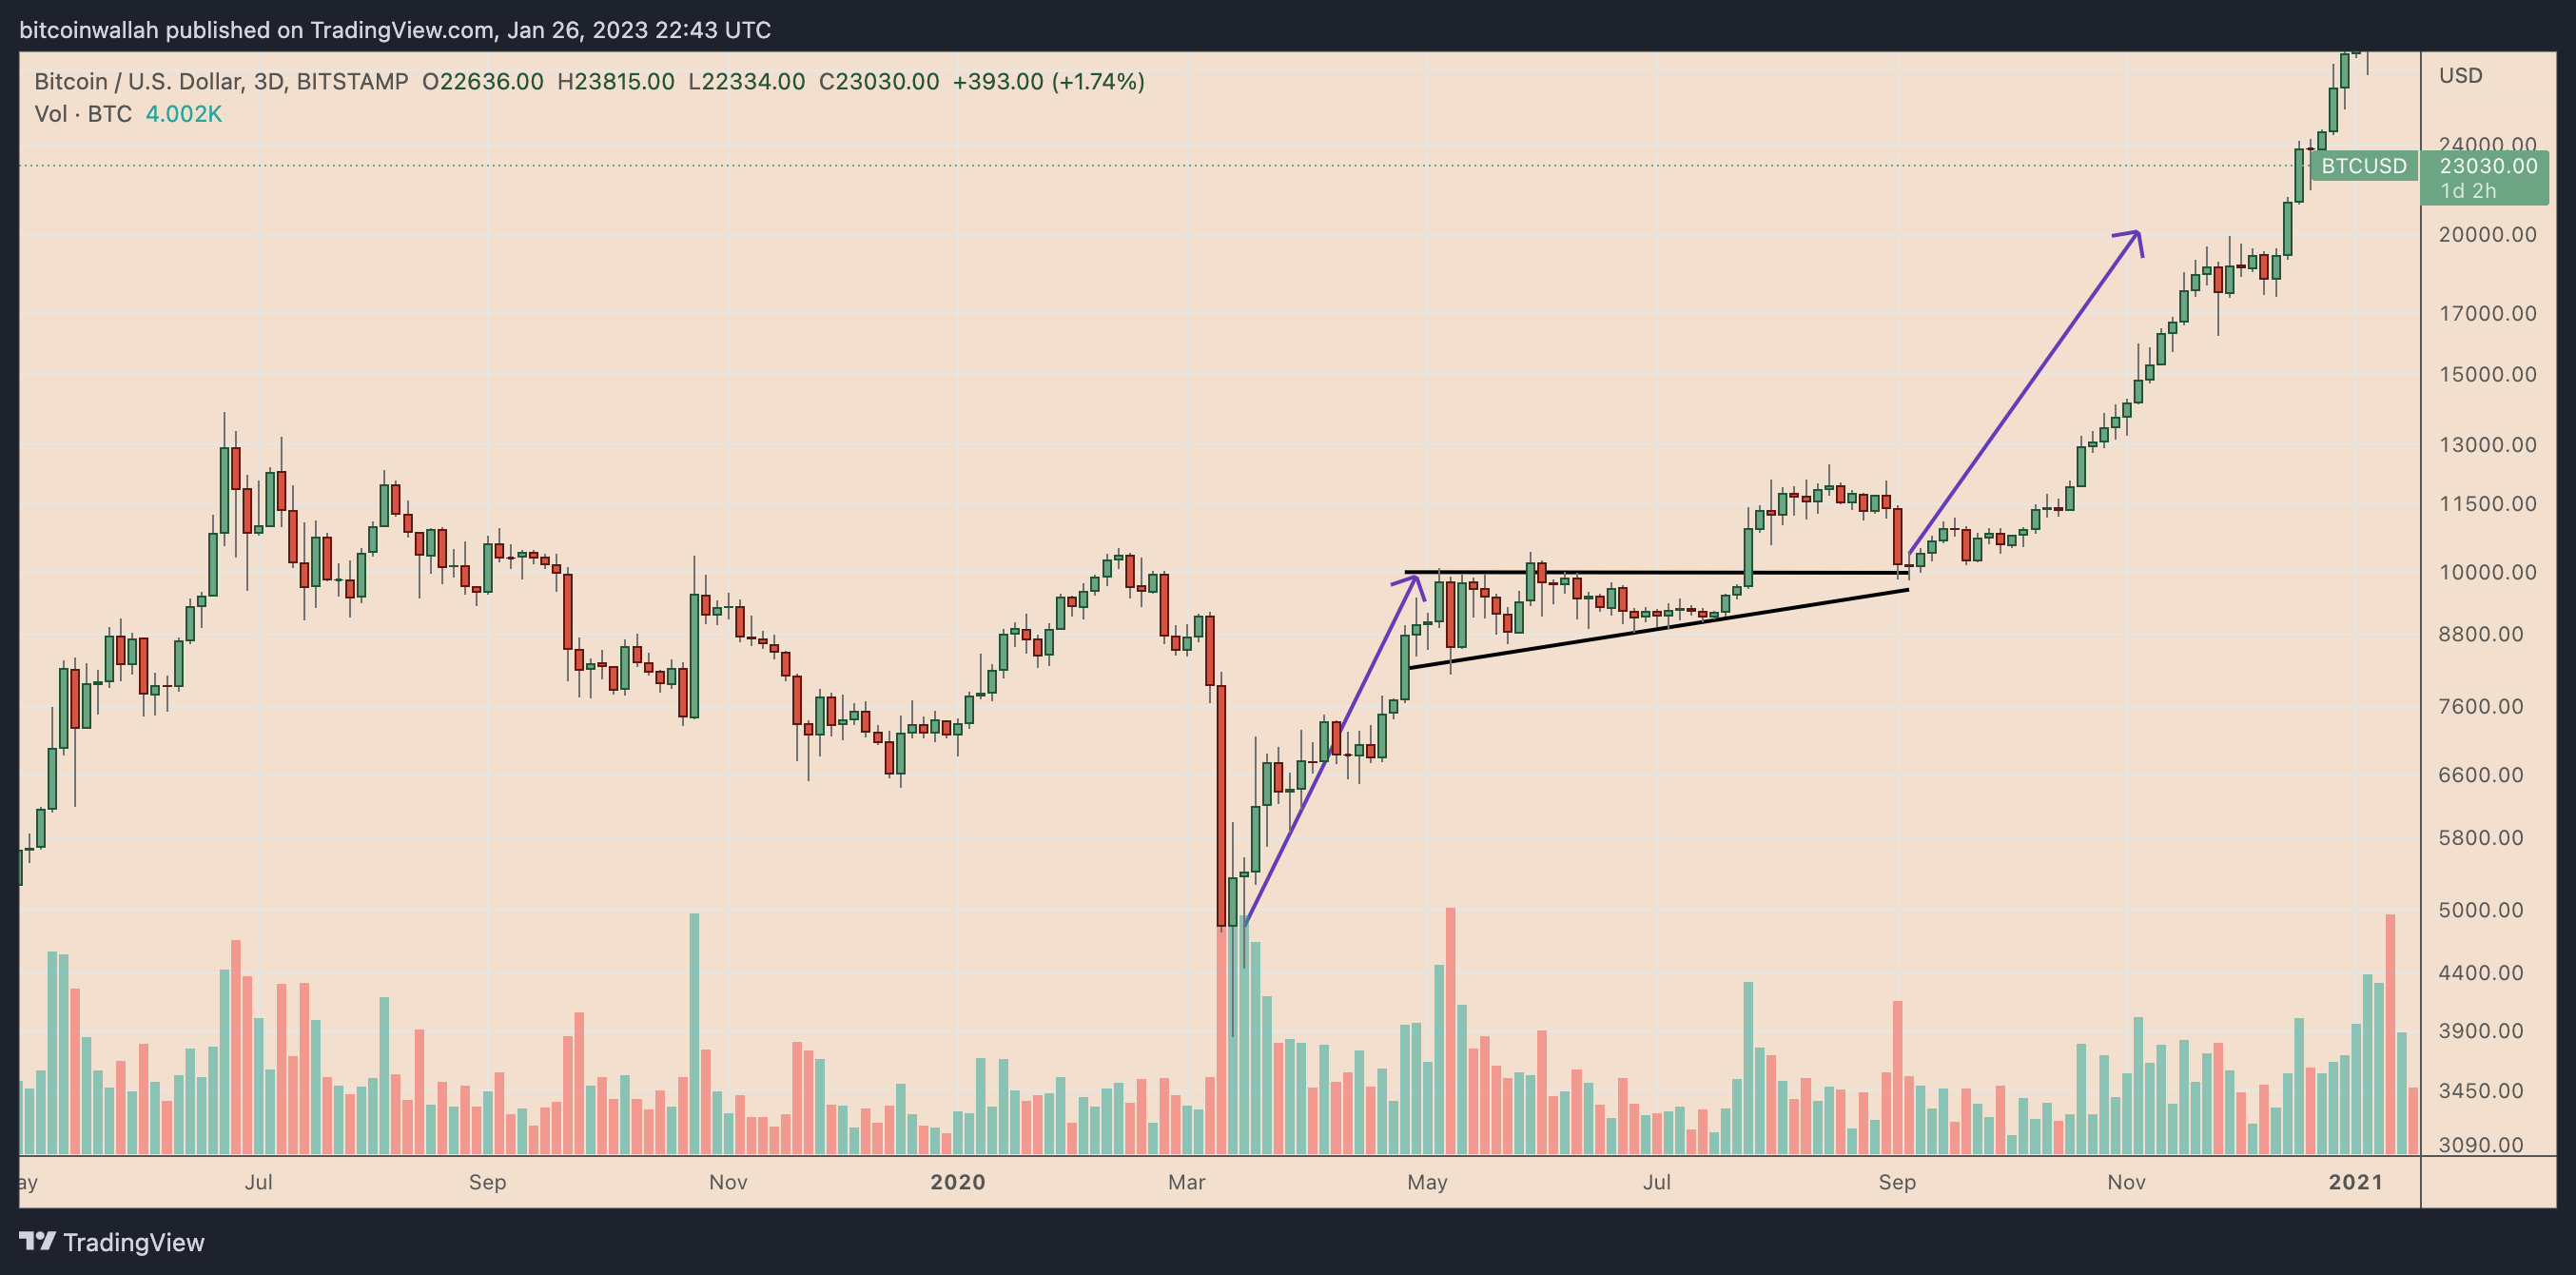
BTC/USD three-day price chart featuring ascending triangle breakout. Source: TradingView
For example, the Bitcoin (BTC $22,937) price chart above shows the BTC/USD trading pair forming an ascending triangle pattern between April 2020 and July 2020.
The BTC price breaks out of the triangle range in late July to the upside. It returns to retest the pattern’s resistance trendline as support in September for further bullish confirmation, resuming its uptrend.
However, the ascending triangle is not always a bellwether for bullish continuation, particularly in bear markets. For instance, its occurrence during the 2018 bear market preceded more downside, as shown in the Ether (ETH $1,576 ) price chart below.
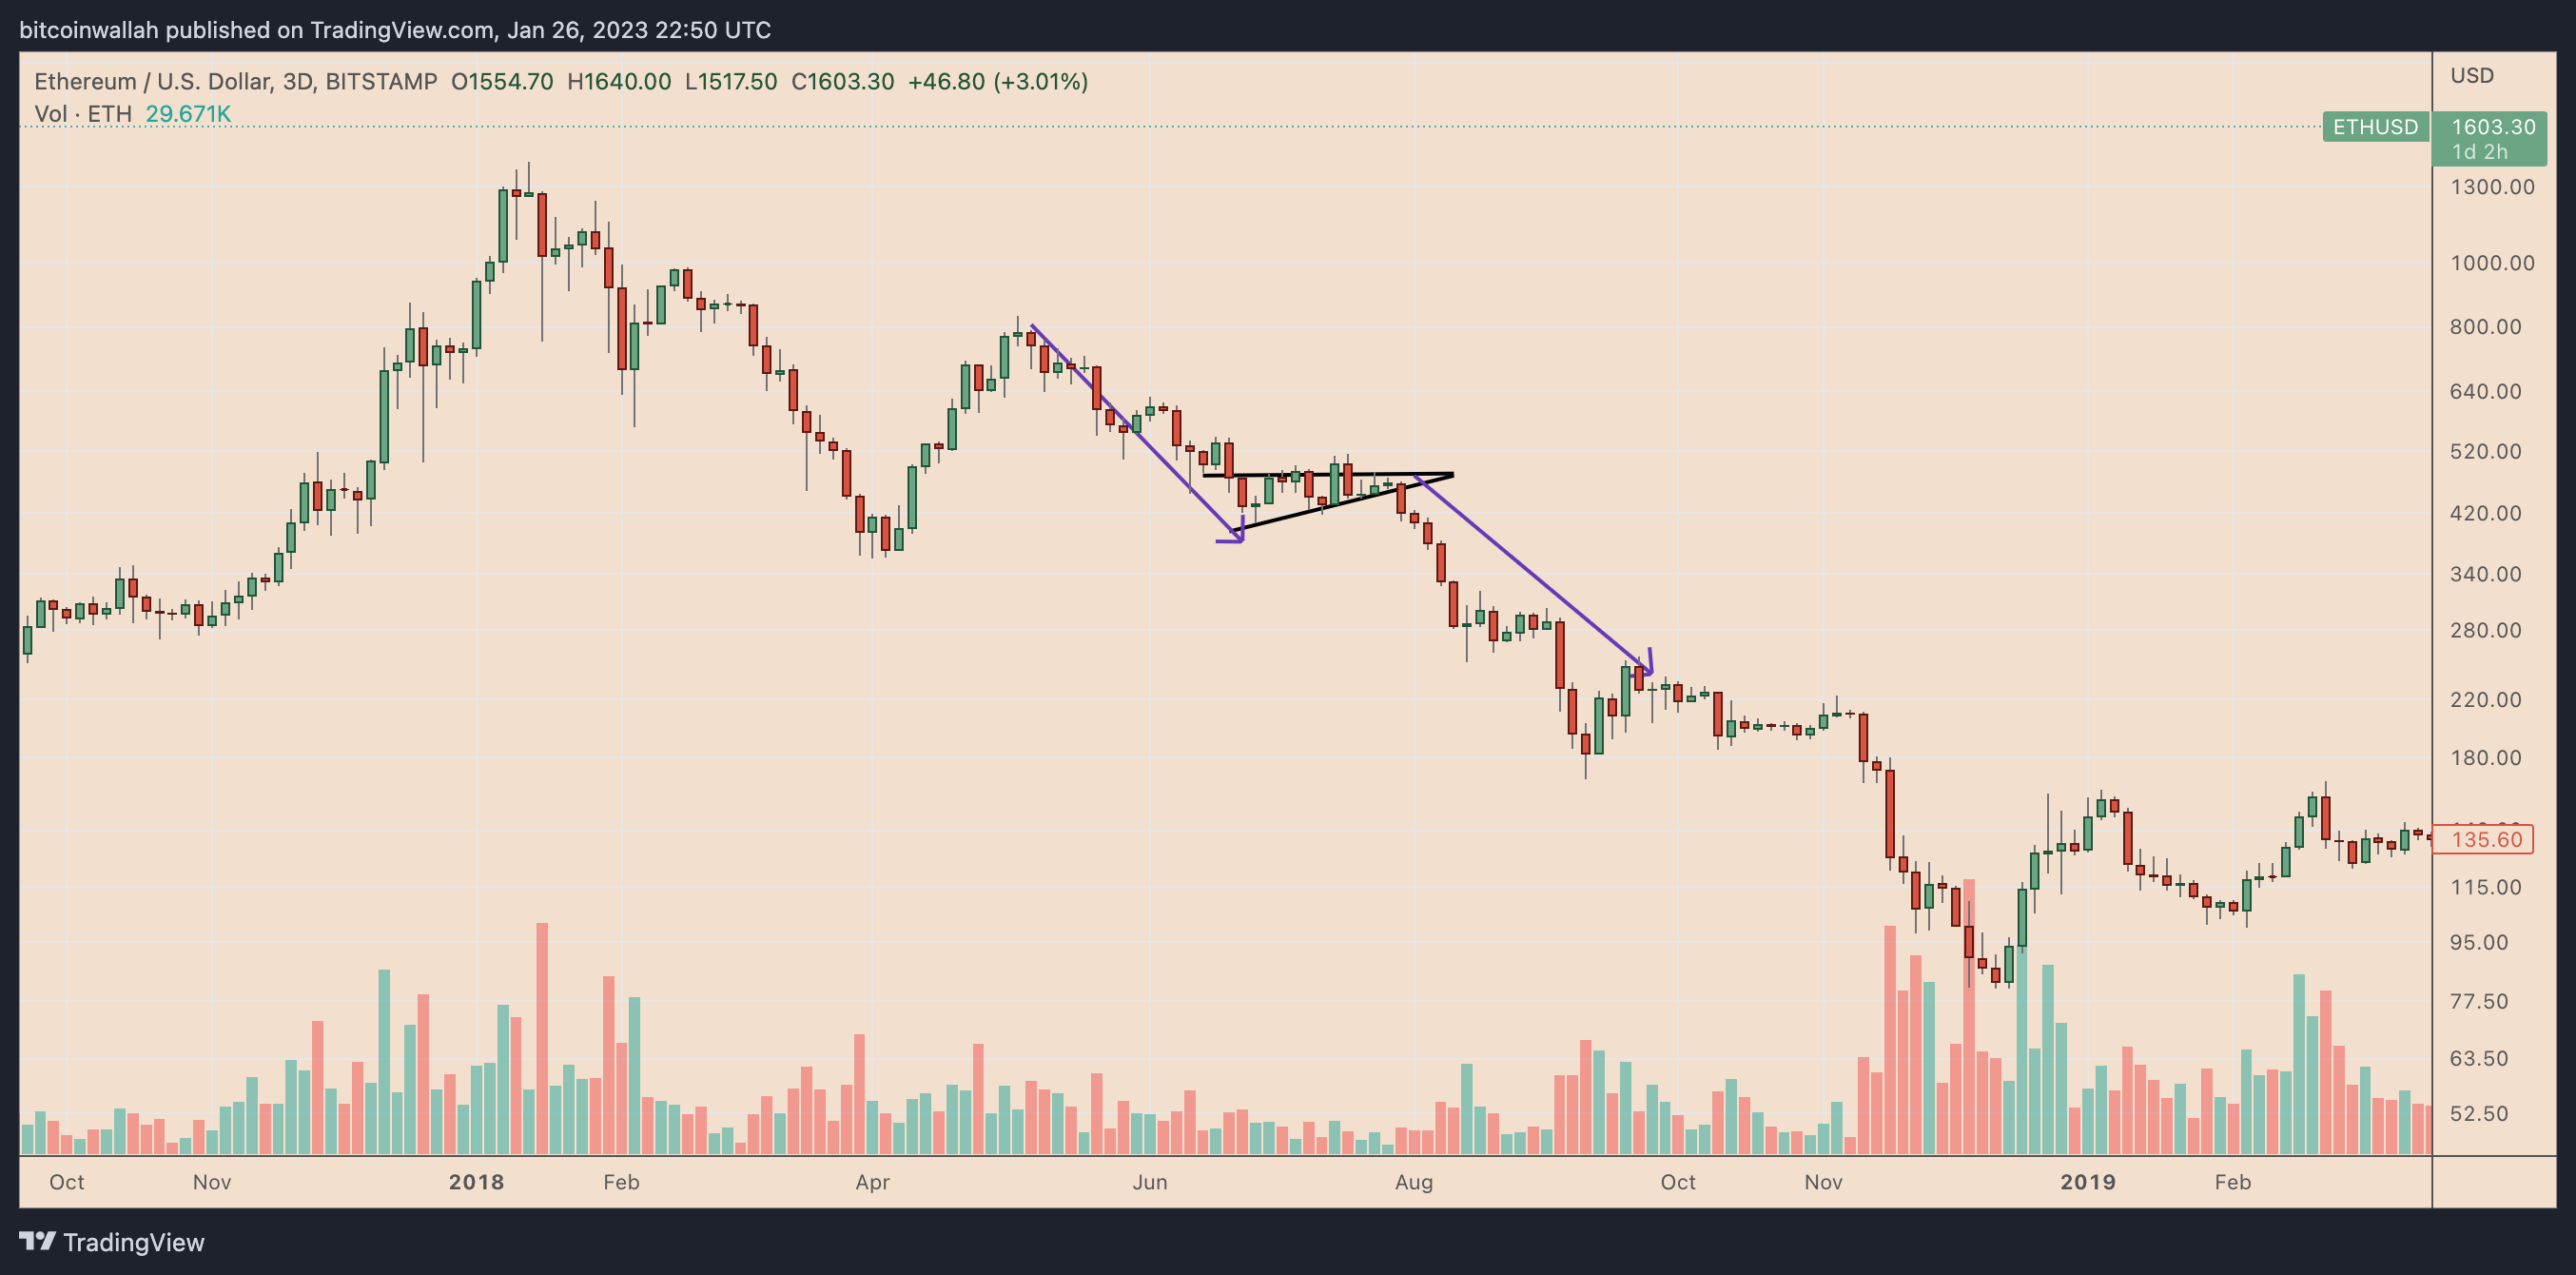
ETH/USD three-day price chart featuring ascending triangle breakdown. Source: TradingView
There are also instances when ascending triangles signal bear markets’ end. One is Ethereum’s triangle formation between March 2020 and April 2020, which led to a trend reversal to the upside, as shown below.
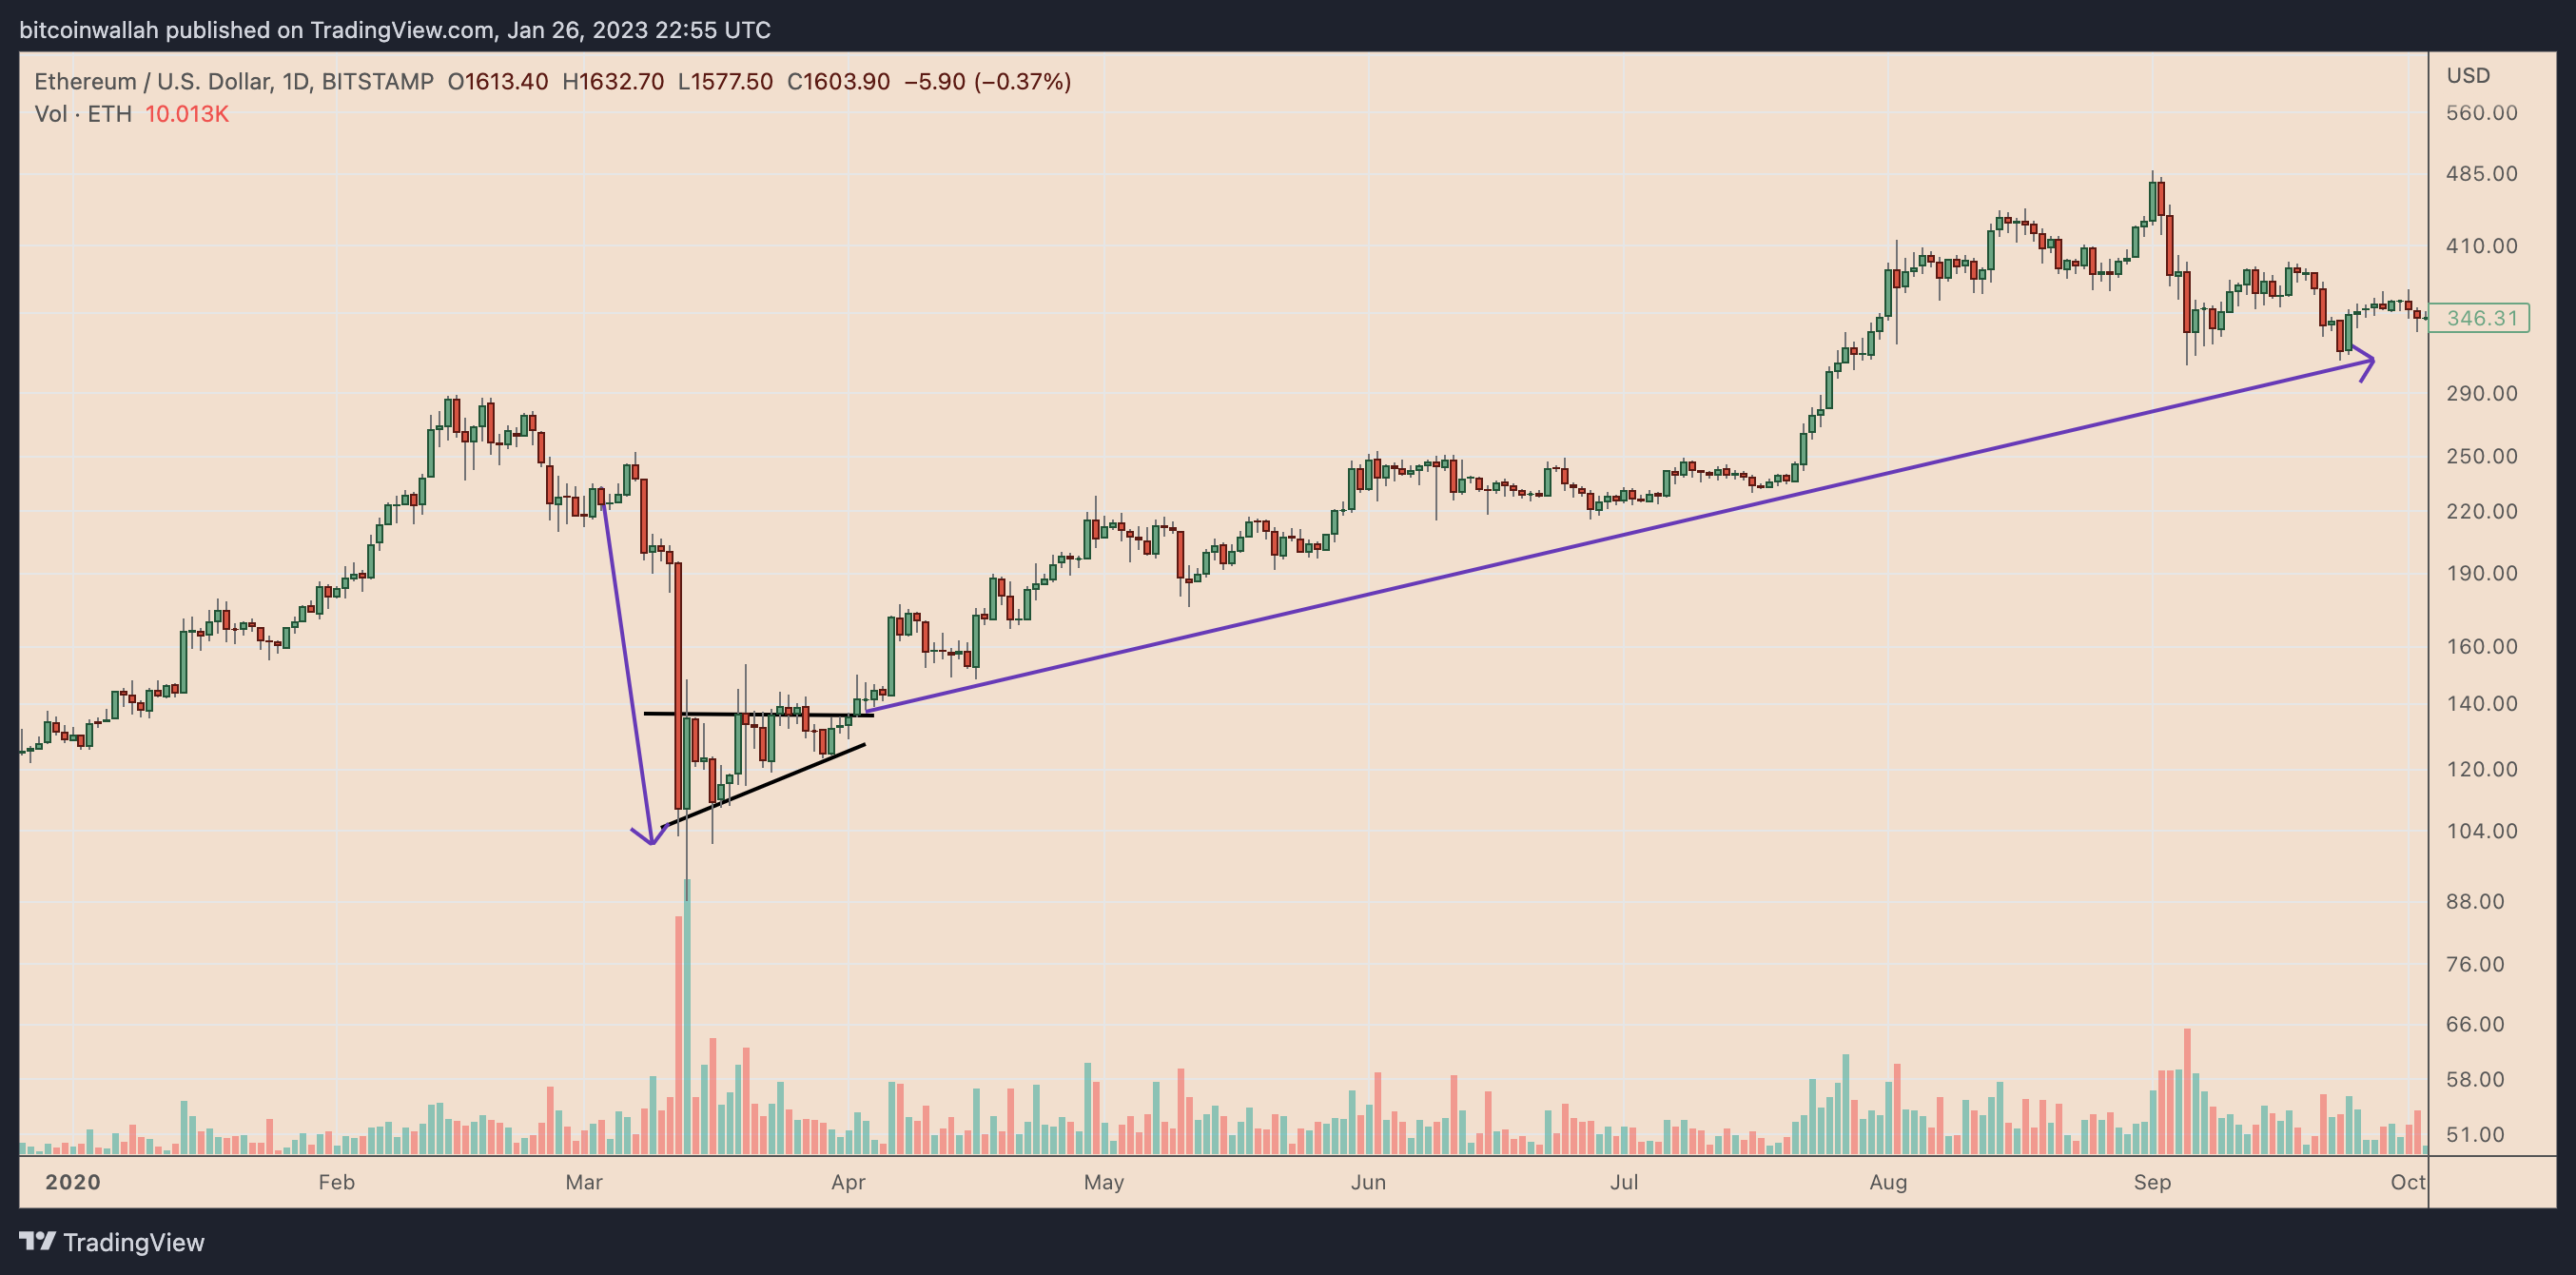
ETH/USD daily price chart featuring ascending triangle reversal. Source: TradingView
So, given these variations in outcome, how do traders use this chart pattern to help reduce risk and better prepare for the next move? Let’s take a closer look.
How to trade an ascending triangle pattern?
The ascending triangle has a widely-tracked measuring technique that could help traders identify their profit targets following a breakout or breakdown.
The target in a bull trend is measured by taking the maximum distance between the triangle’s upper and lower trendline, then adding the distance to the upper trendline. The same applies to ascending triangle reversal setups.
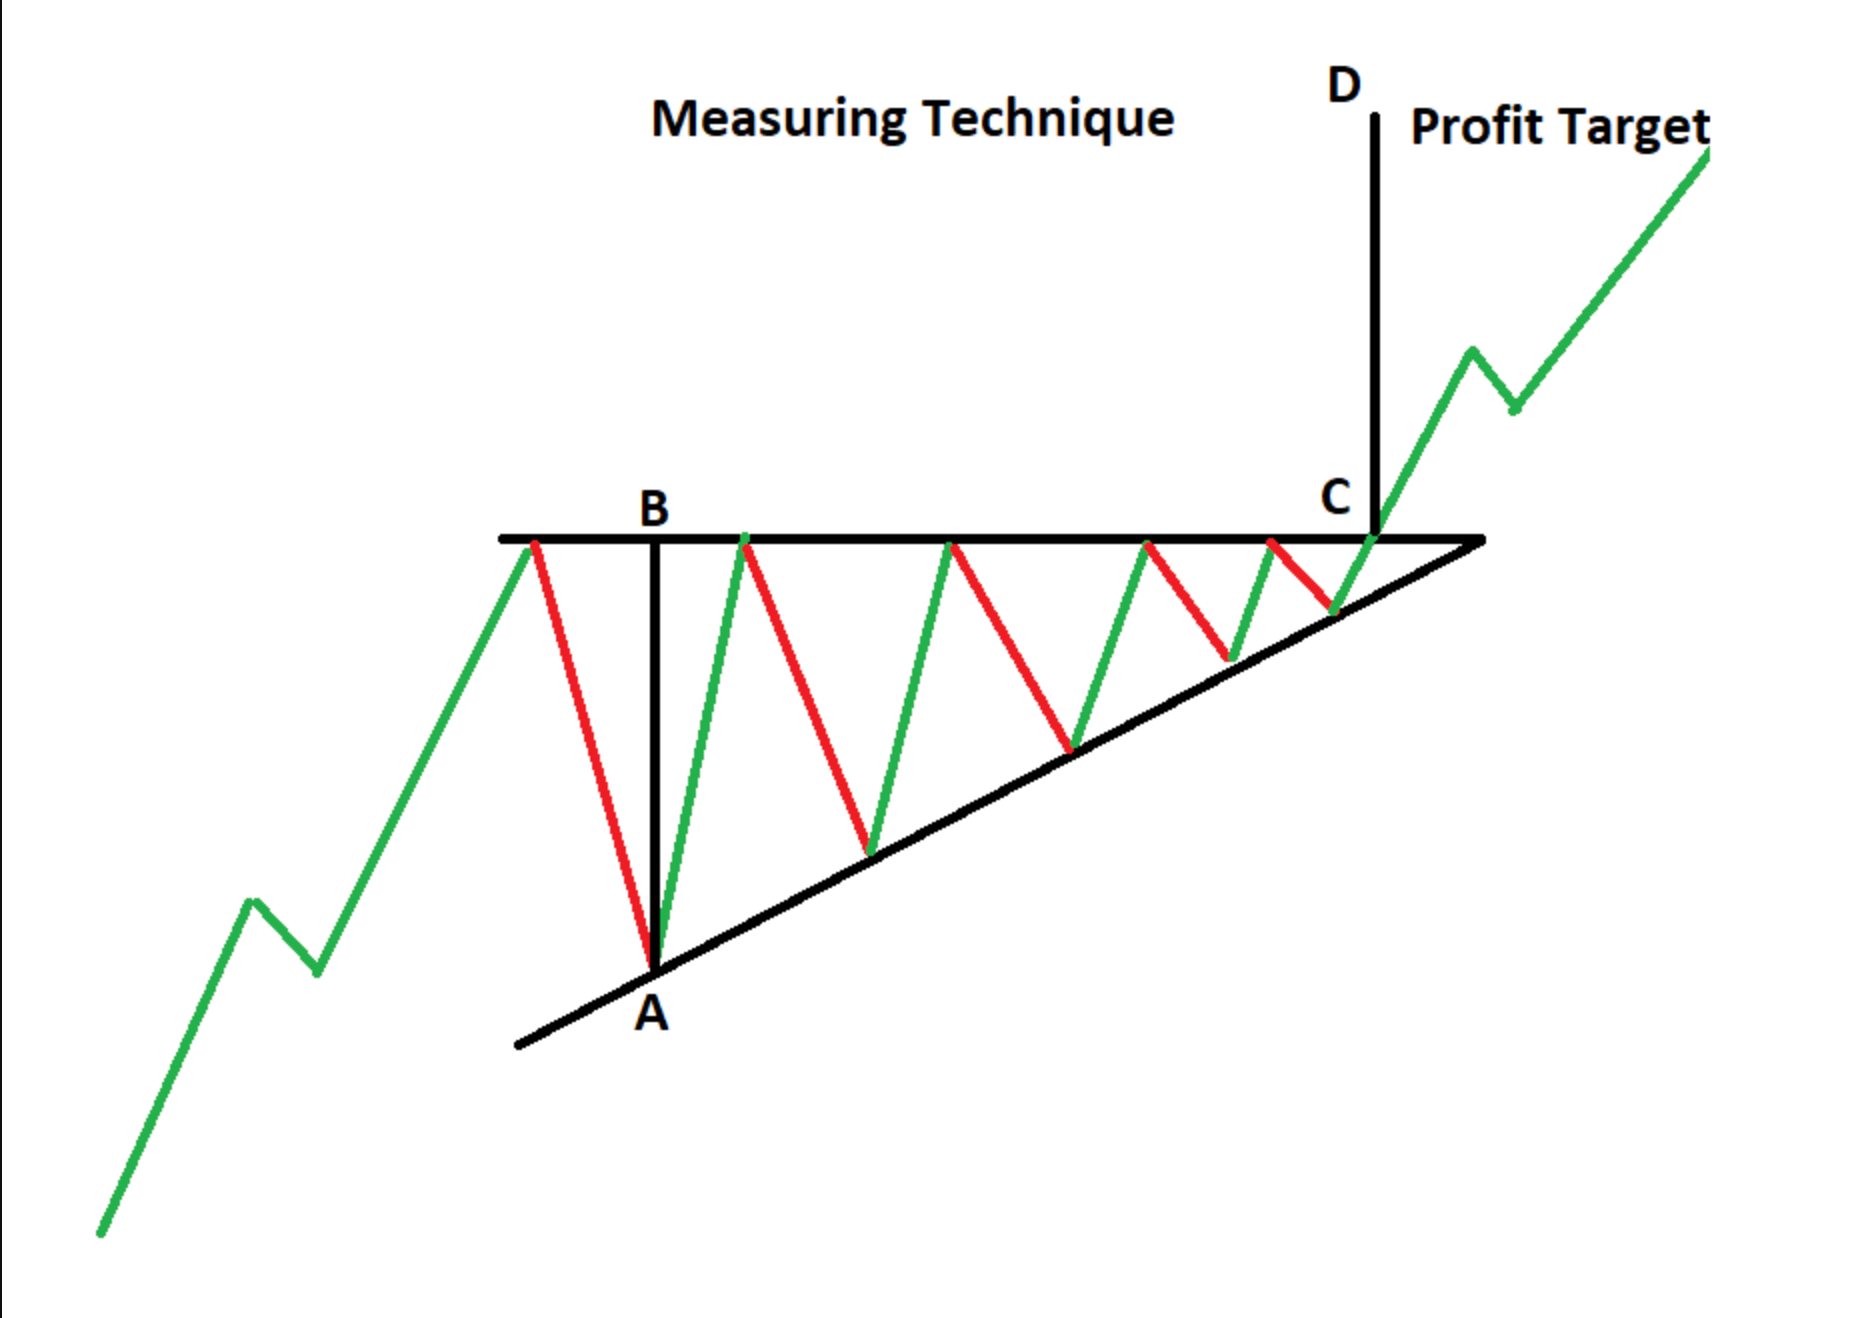
Ascending triangle pattern breakout target illustration.
Conversely, the profit target in a bear trend is obtained by measuring the distance between the triangle's upper and lower trendline. Then, add the outcome to the breakdown point on the lower trendline.
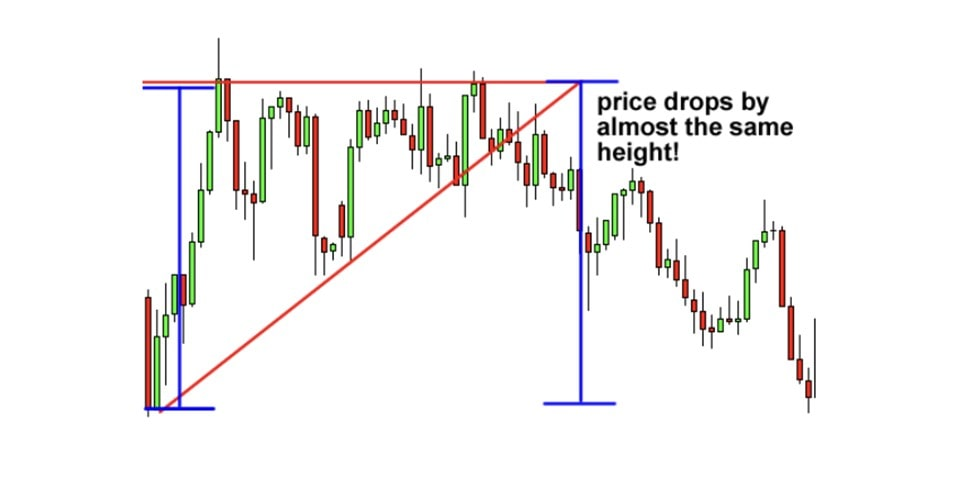
Ascending triangle pattern breakdown target illustration.
Beware of fakeouts
Some clues can be obtained by checking the accompanying trading volume. An uptick is typically seen as a sign of strength. Conversely, a flat volume trend hints that the breakout or the breakdown may not have enough momentum.
Using stop-losses on the opposite side of the trend is another tool traders can use to reduce risk in a potential ascending triangle breakout or breakdown scenario. In other words, traders can exit their positions at a smaller loss should the trend reverse before reaching its technical profit target.
Author

Cointelegraph Team
Cointelegraph
We are privileged enough to work with the best and brightest in Bitcoin.


