What is a golden cross pattern and how does it work?

A golden cross pattern on the charts excites crypto traders for its promises of profitable opportunities ahead, largely due to its impressive success rate in traditional markets.
The golden cross tends to precede sustained uptrends in contrast with the bearish death cross pattern. For instance, since 1970, the S&P 500 has been returning about 15% gains on average in less than a year after a golden cross’ occurrence.
The golden cross’ record in the benchmark crypto asset Bitcoin (BTC $17,465) is similarly impressive. Notably, the indicator has appeared seven times on Bitcoin daily charts since 2010, out of which five have led to massive bull runs.
What is a golden cross pattern?
Before discussing the golden cross, let’s discuss its core component known as moving averages (MAs).
A moving average records the average change in an asset’s price over a specific period. Mathematically, they are measured after adding a set of prices (recorded in a fixed timeframe such as hourly, four-hour, daily, weekly, monthly, etc.) — and by dividing the sum by the number of prices in the set.
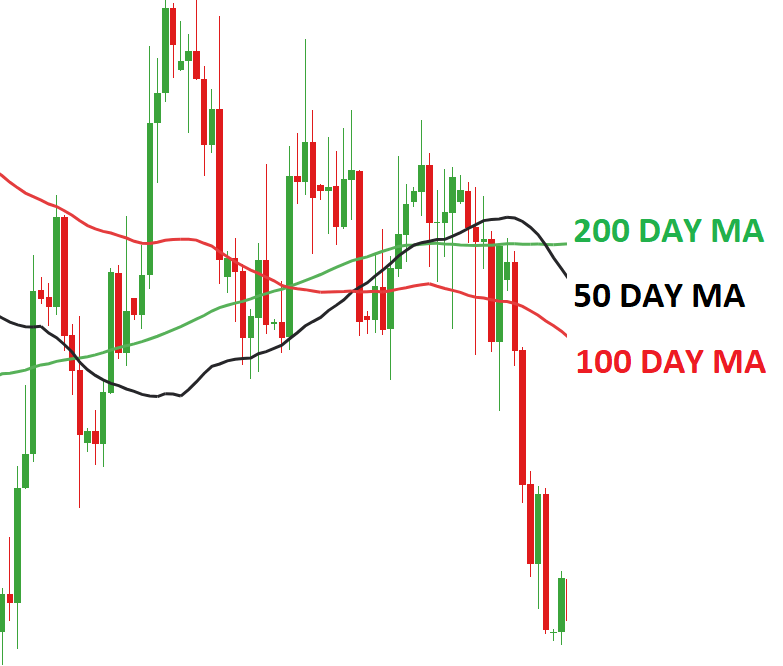
Moving average examples
Traditionally, golden cross watchers focus on two specific moving averages: the 50-day moving average, which becomes the short-term MA, and the 200-day MA as the long-term moving average.
A golden cross pattern forms when the short-term MA crosses above the long-term MA. In other words, the pattern shows that buying interest in a particular market has risen over the previous 50 days compared to the previous 200 days.
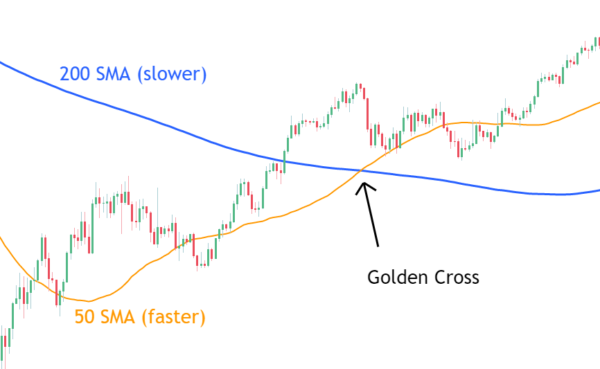
Golden cross illustration
How does a golden cross work?
Golden crosses typically precede significant price rallies across traditional and crypto markets, a reason why traders perceive them as buy signals.
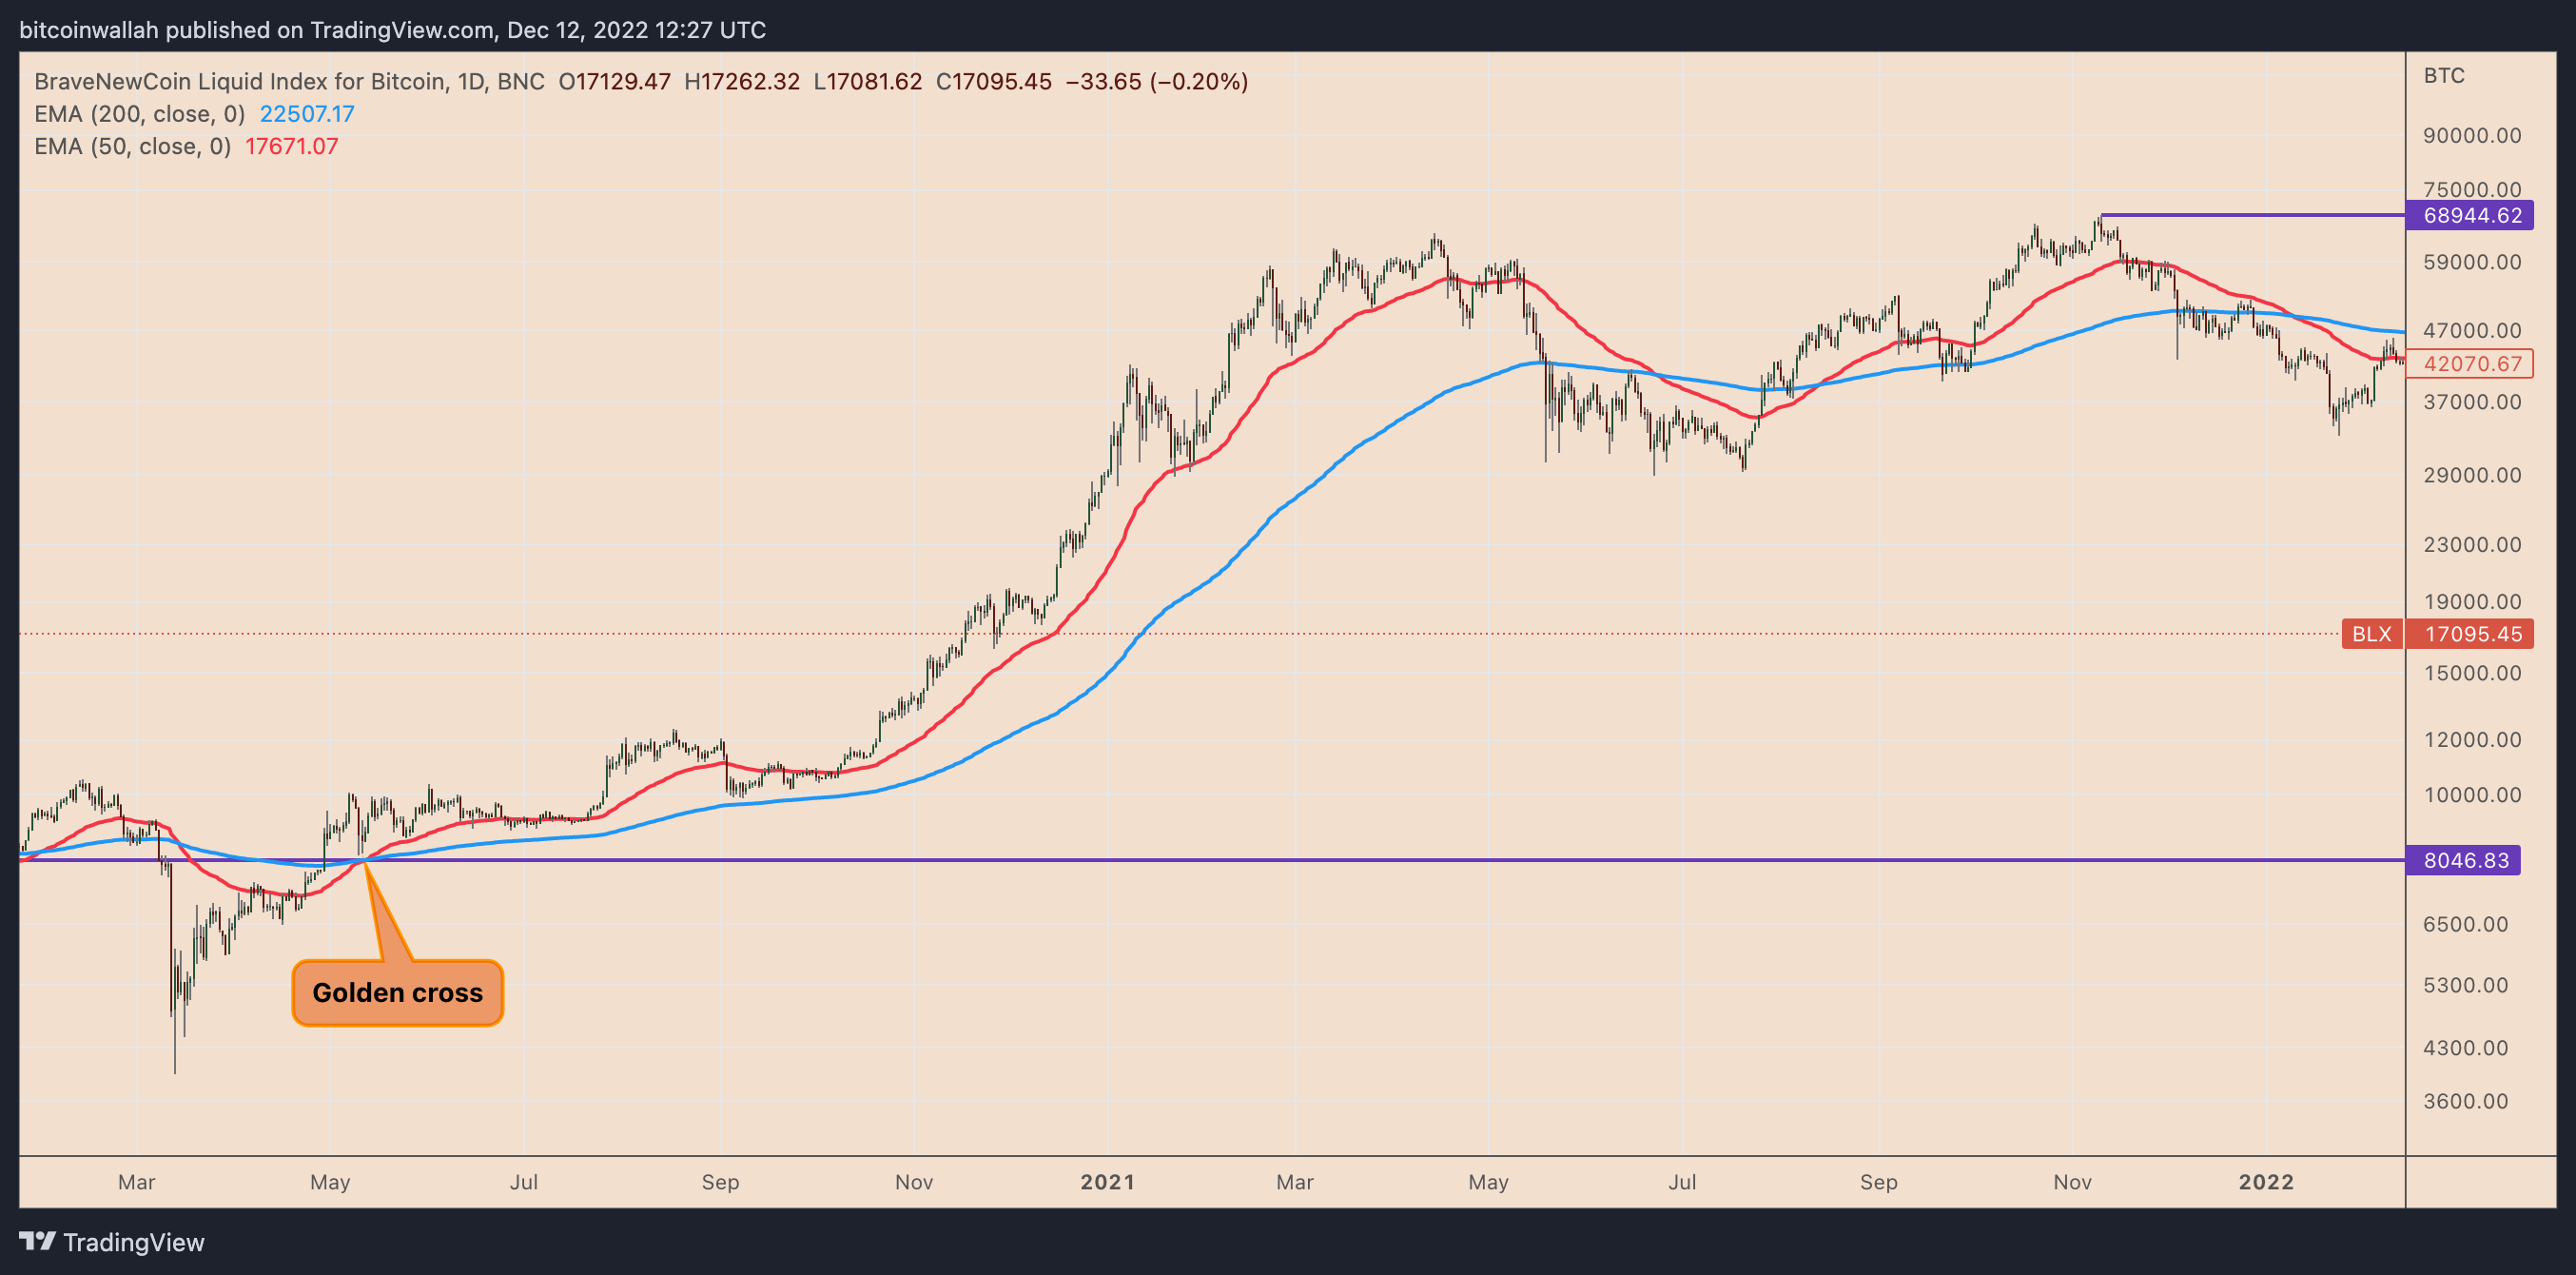
BTC/USD daily price chart featuring March 2020 golden cross and a ~750% rally afterward. Source: TradingView
But there have been cases where golden crosses have been followed by fake breakouts. Therefore, one should consider the golden cross pattern alongside other technical indicators before making a decision.
For starters, traders can employ the relative strength index (RSI), a momentum oscillator that determines an asset’s overbought and oversold conditions, to predict potential price pullbacks.
In February 2020, this strategy may have helped many traders avoid deeper losses. Let’s see why.
On Feb. 1, 2020, Bitcoin’s 50- and 200-day MA formed a golden cross when it traded for around $9,500. A modest euphoria followed, and the price moved to as high as $10,500 in the next two weeks. The period also saw Bitcoin’s daily RSI rise above its overbought threshold of 70.
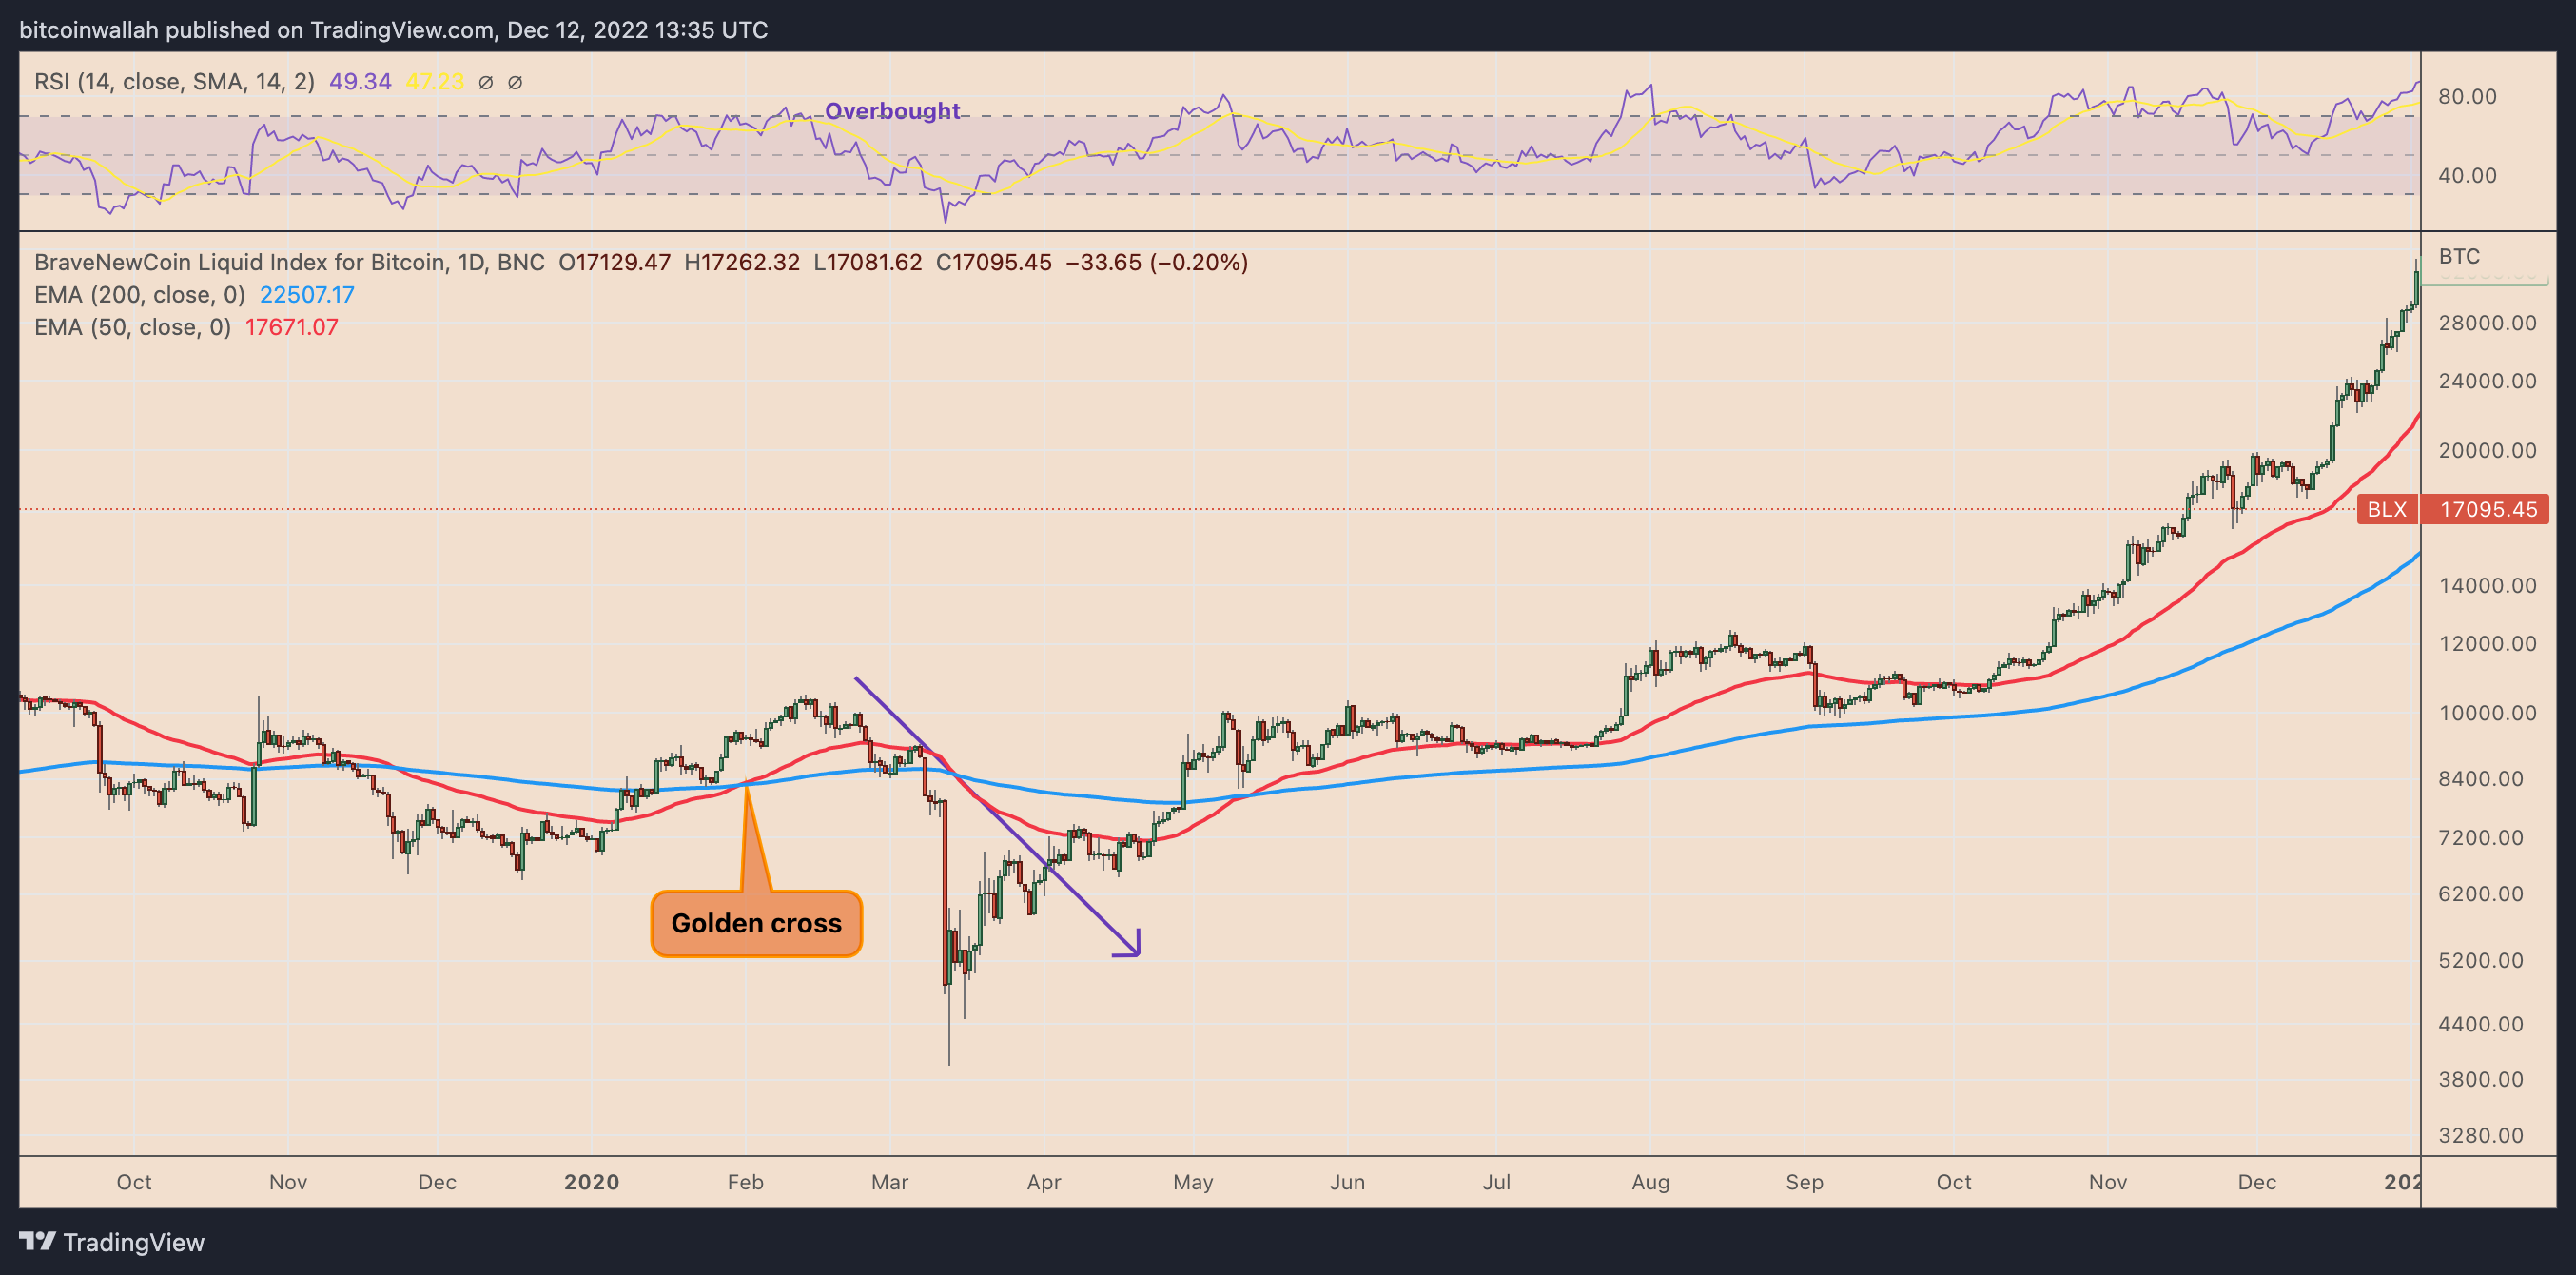
BTC/USD daily price chart with fake golden cross breakout. Source: TradingView
Bitcoin’s overbought conditions resulted in a decline toward its 50- and 200-day MA (the $8,500-$9,200 range). But its price eventually collapsed below $4,000 entering March, in line with a global market meltdown led by the beginning of the COVID-19 pandemic.
The case study explains that golden crosses are not 100% accurate in predicting future trends. Instead, they could merely assist traders and analysts by employing momentum indicators as well as fundamentals to forecast price actions in the short and long term.
These momentum indicators could include Moving Average Convergence Divergence (MACD), Stochastic RSI, Rate of Change (ROC), Average Directional Index (ADI), and others.
In other words, traders are advised not to buy too early into a golden cross formation. Instead, they could wait for the price to consolidate sideways or lower and find short-term support before deciding to enter a trade.
It’s possible to also alter the definition of a golden cross in volatile market conditions by changing moving averages.
For instance, using the 20-period MA for the short-term MA and the 50-period MA for t long-term MA. The 20-50-day MA combination has historically helped traders determine short-term crypto market trends, as shown below in the March 2020-November 2021 bull run.
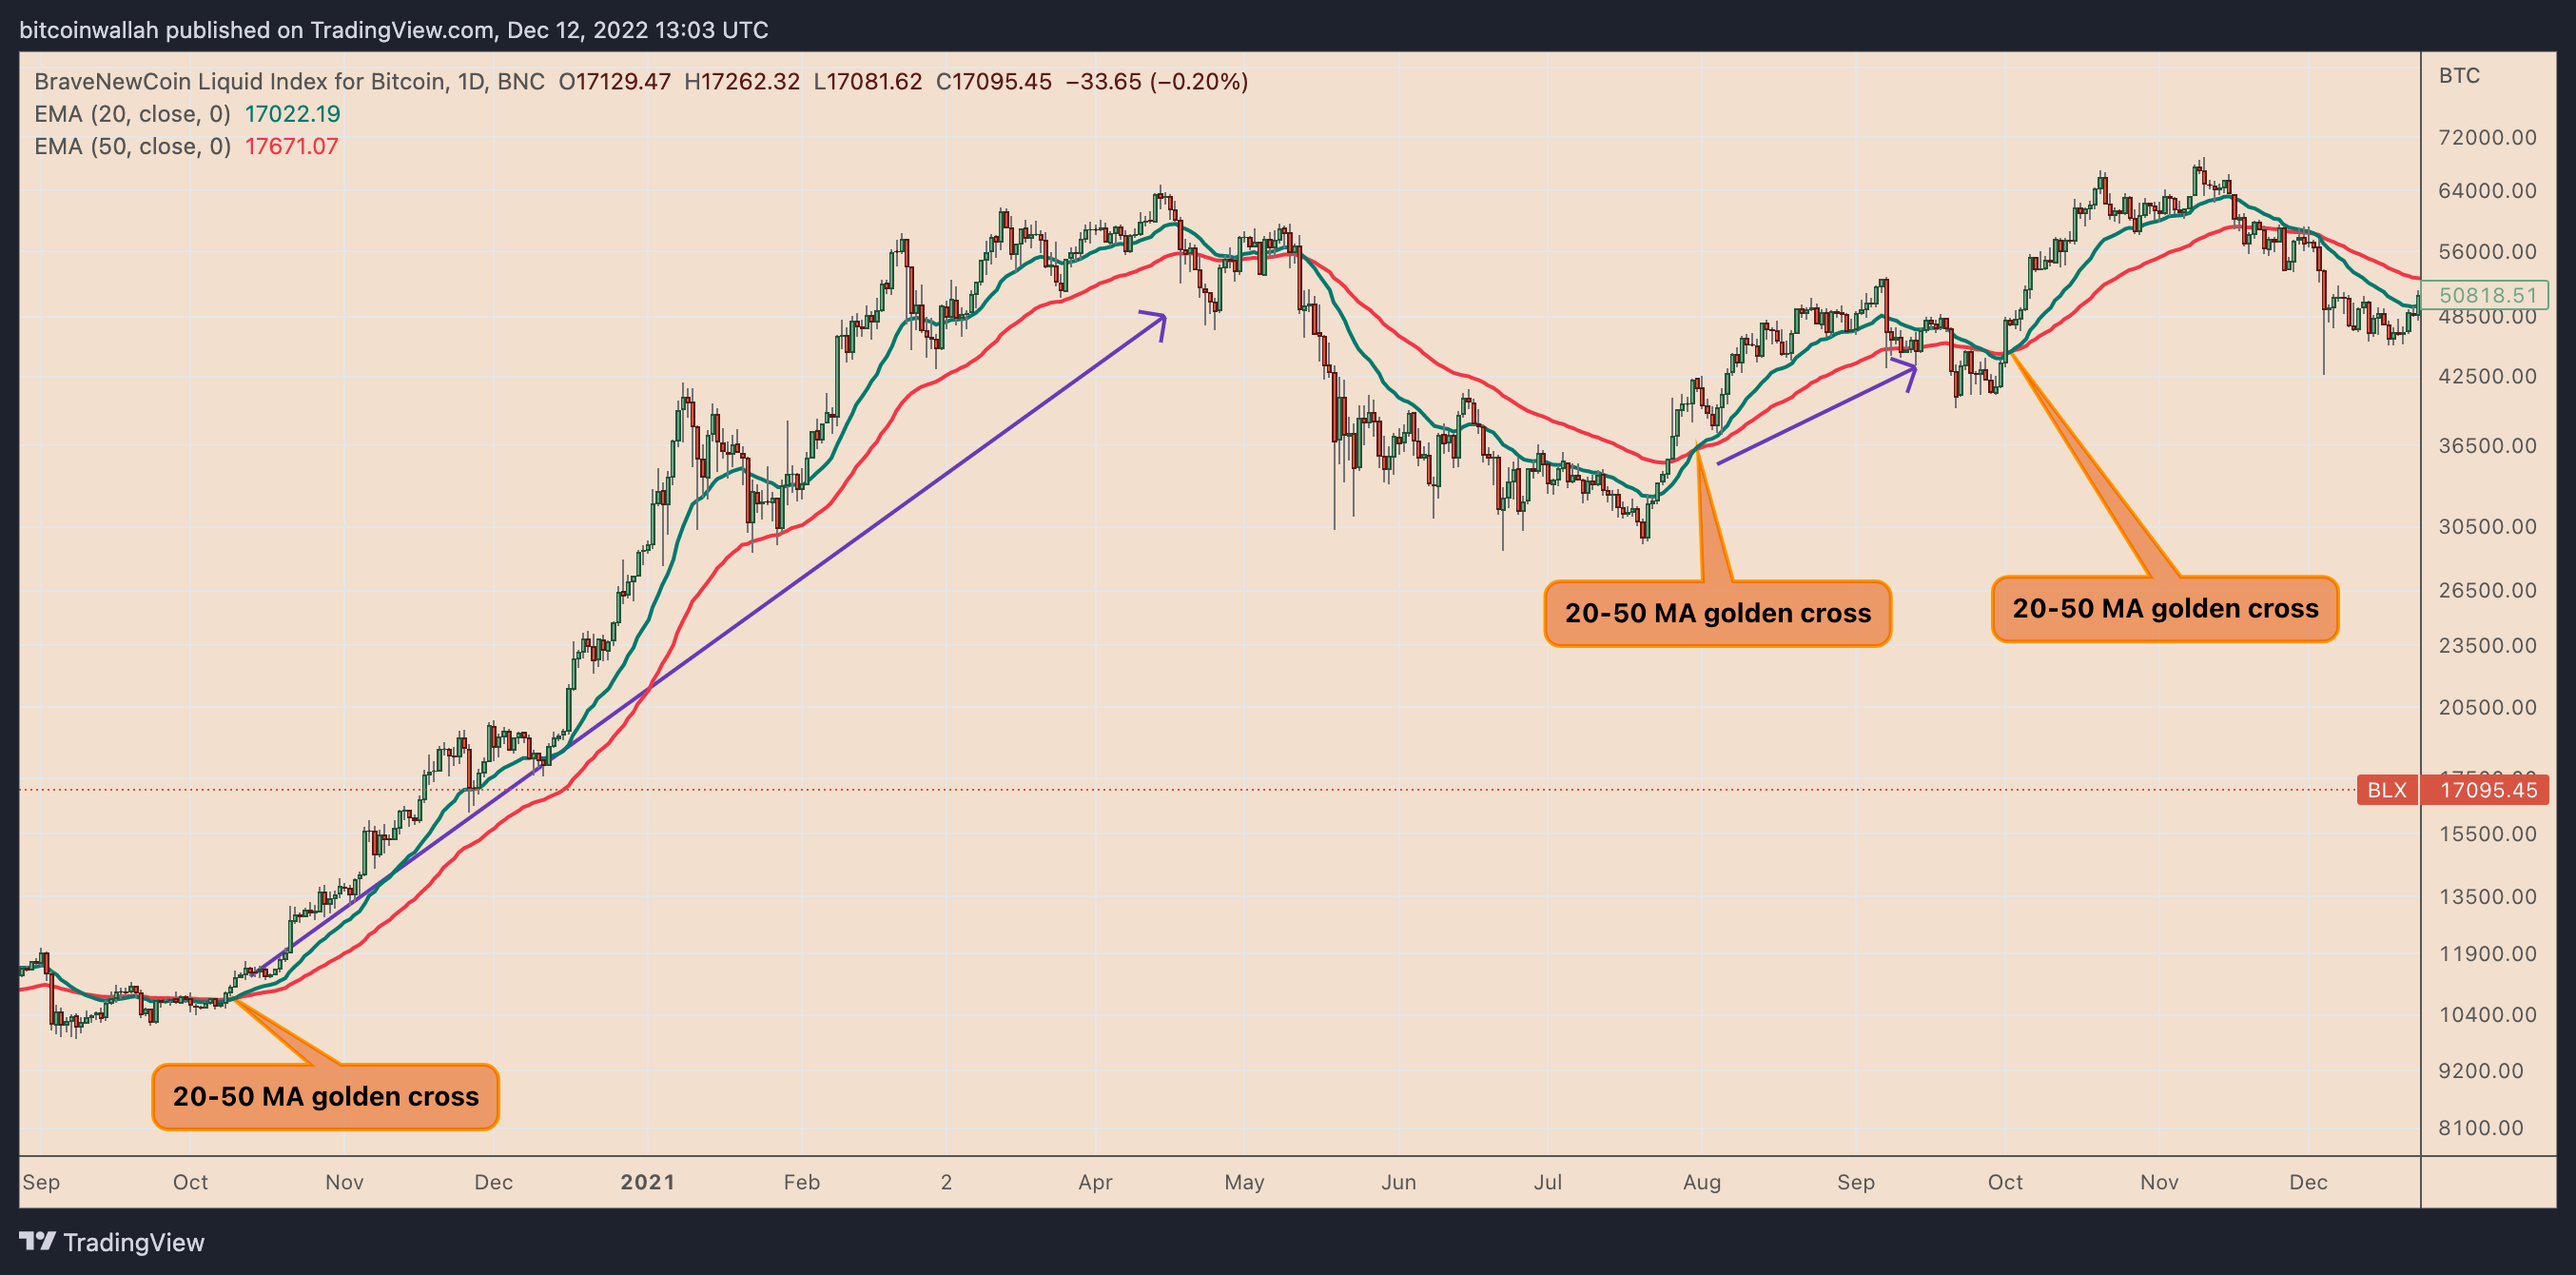
BTC/USD daily price chart featuring 20-50 MA crossovers. Source: TradingView
Golden crosses don’t mean guaranteed gains
While golden crosses frequently do indeed appear before major price rallies in Bitcoin and cryptocurrency markets, the risk of bulls falling into a trap remains.
Ultimately, traders should be cautious with crossover signals, as blindly following them might result in losses. As discussed above, false signals can occur and it’s important to confirm any golden cross with additional technical indicators before making any trades.
Author

Cointelegraph Team
Cointelegraph
We are privileged enough to work with the best and brightest in Bitcoin.


