What does the future hold for Bitcoin price as Ethereum’s ‘Merge’ narrative takes over?
- Bitcoin price is currently retesting the 200-week SMA at $22,.794, anticipating a minor bounce.
- There are three trade opportunities that BTC presents, two of which favor the bears.
- A daily candlestick close that flips the $24,565 level will invalidate the bearish thesis.

Bitcoin price has been on a downswing since the July 30 swing high rejection at a significant resistance level. This development has pushed BTC to slide lower and retest crucial support floors while hinting at a potential for a further move south.
With altcoins rallying due to the upcoming Merge upgrade, investors need to consider the possibility of BTC being left out. However, a sudden downturn in Bitcoin price could adversely affect the ongoing altcoin rally.
Bitcoin price bears fruit for patient traders
Bitcoin price from a higher-time-frame outlook shows the formation of an ascending parallel channel since the June 18 crash. Interestingly, the same can be seen happening since the start of 2022.
Currently, BTC is hovering around the support confluence made up of the 200-week Simple Moving Average (SMA) and 30-day Exponential Moving Average (EMA) at $22,800. The rejection at the $24,565 level has led to a downswing, which has pushed BTC to retest this support confluence.
A breakdown of this level will open the path for a further move south. In such a case, market participants can expect BTC to crash to $21,177, which is the highest volume traded for 2022, aka point of control (POC).
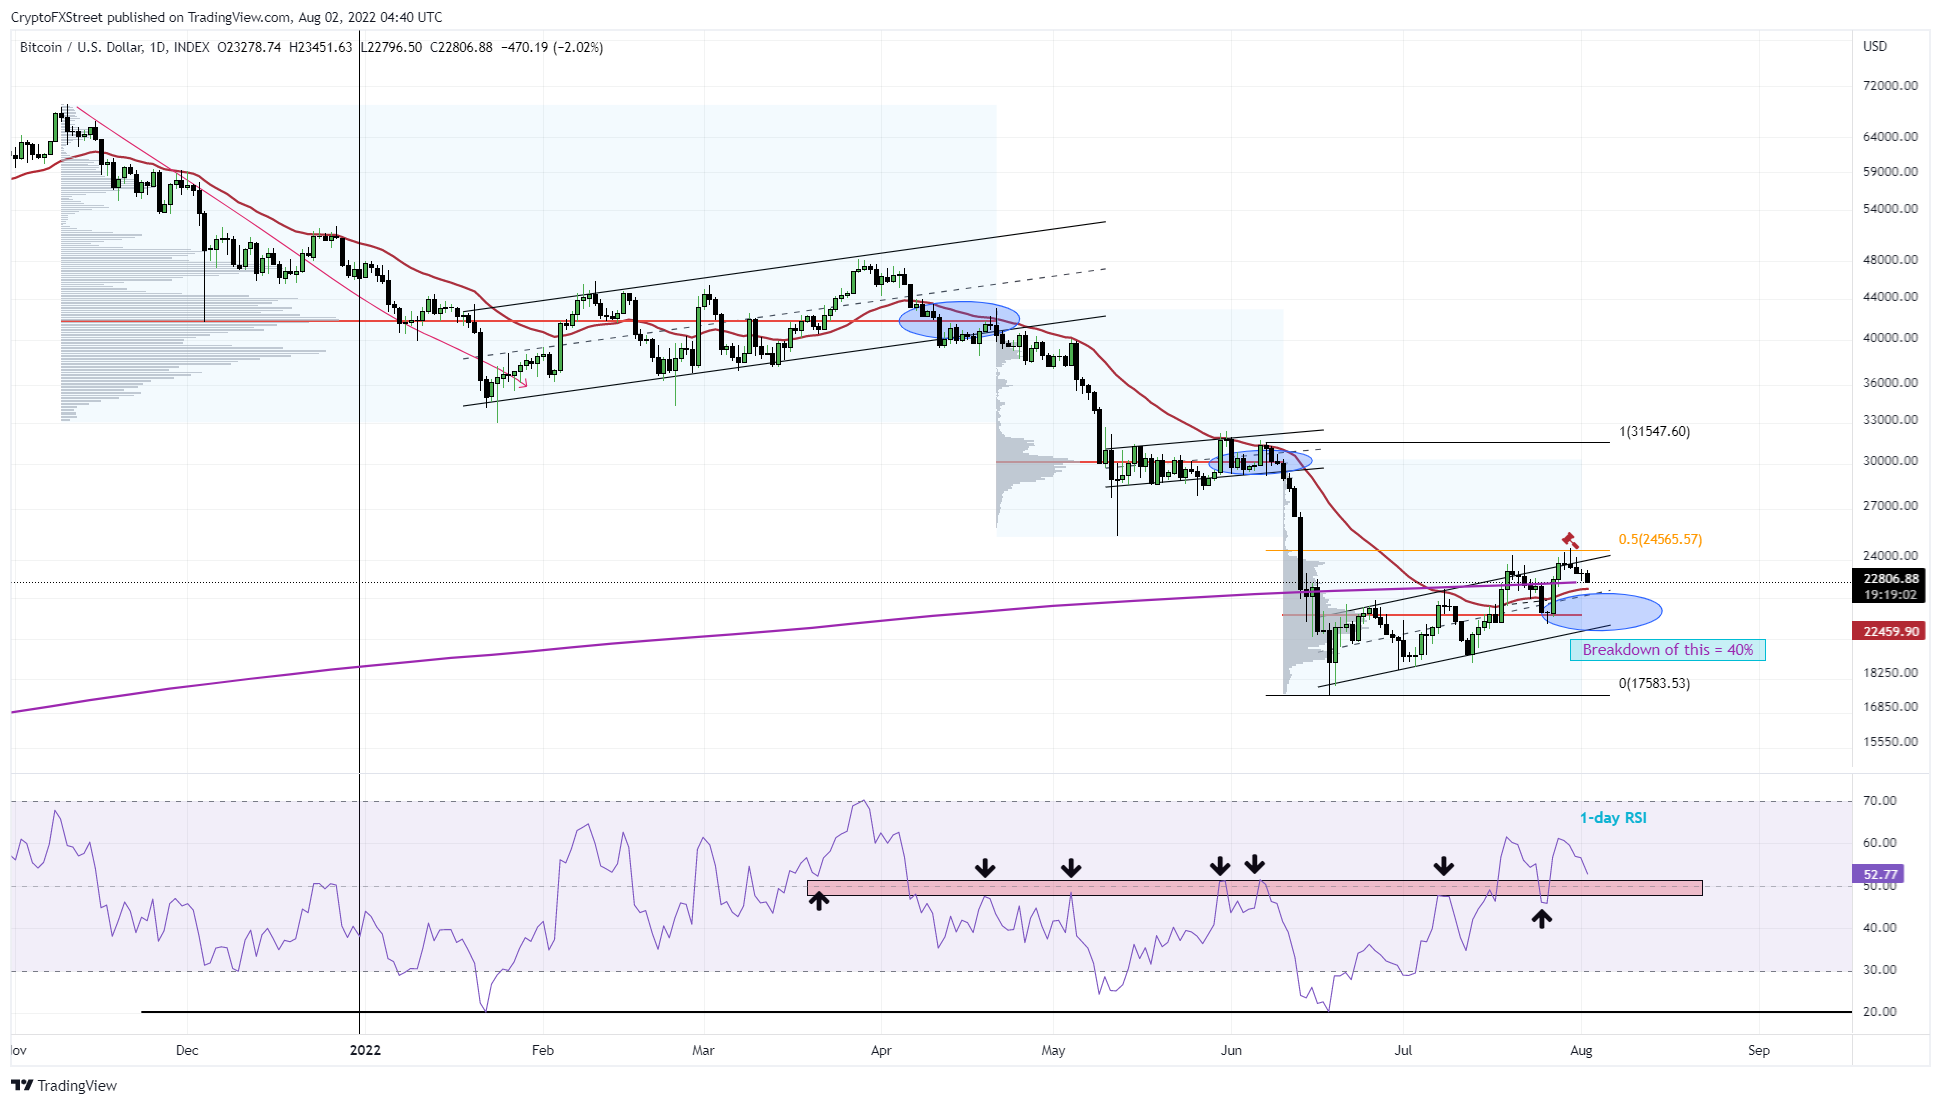
BTC/USDT 1-day chart
Here's a detailed video explanation for the above chart.
Trade opportunity #1
Let’s take a close look at Bitcoin price on the one-hour timeframe.
This chart shows that BTC has created Monday’s range at $23,508 and $22,875 and also swept the range low, suggesting the possibility of a reversal. Additionally, the big crypto is also being supported by the 200-week SMA at $22,794, adding credence to the possibility of a quick uptrend.
Hence, the first trade opportunity is to long Bitcoin price after a quick recovery above Monday’s Low (ML) at $22,875 with partial take profits at Monday’s High (MH) of $23,508. The remaining amount can be sold off at the one-hour Fair Value Gap (FVG), aka price inefficiency at $24,347.
The stop loss for this trade can be dynamic; meaning, a four-hour candlestick close below the 200-week SMA at $22,794 would signal the presence of selling pressure and hence the closure of the long position.
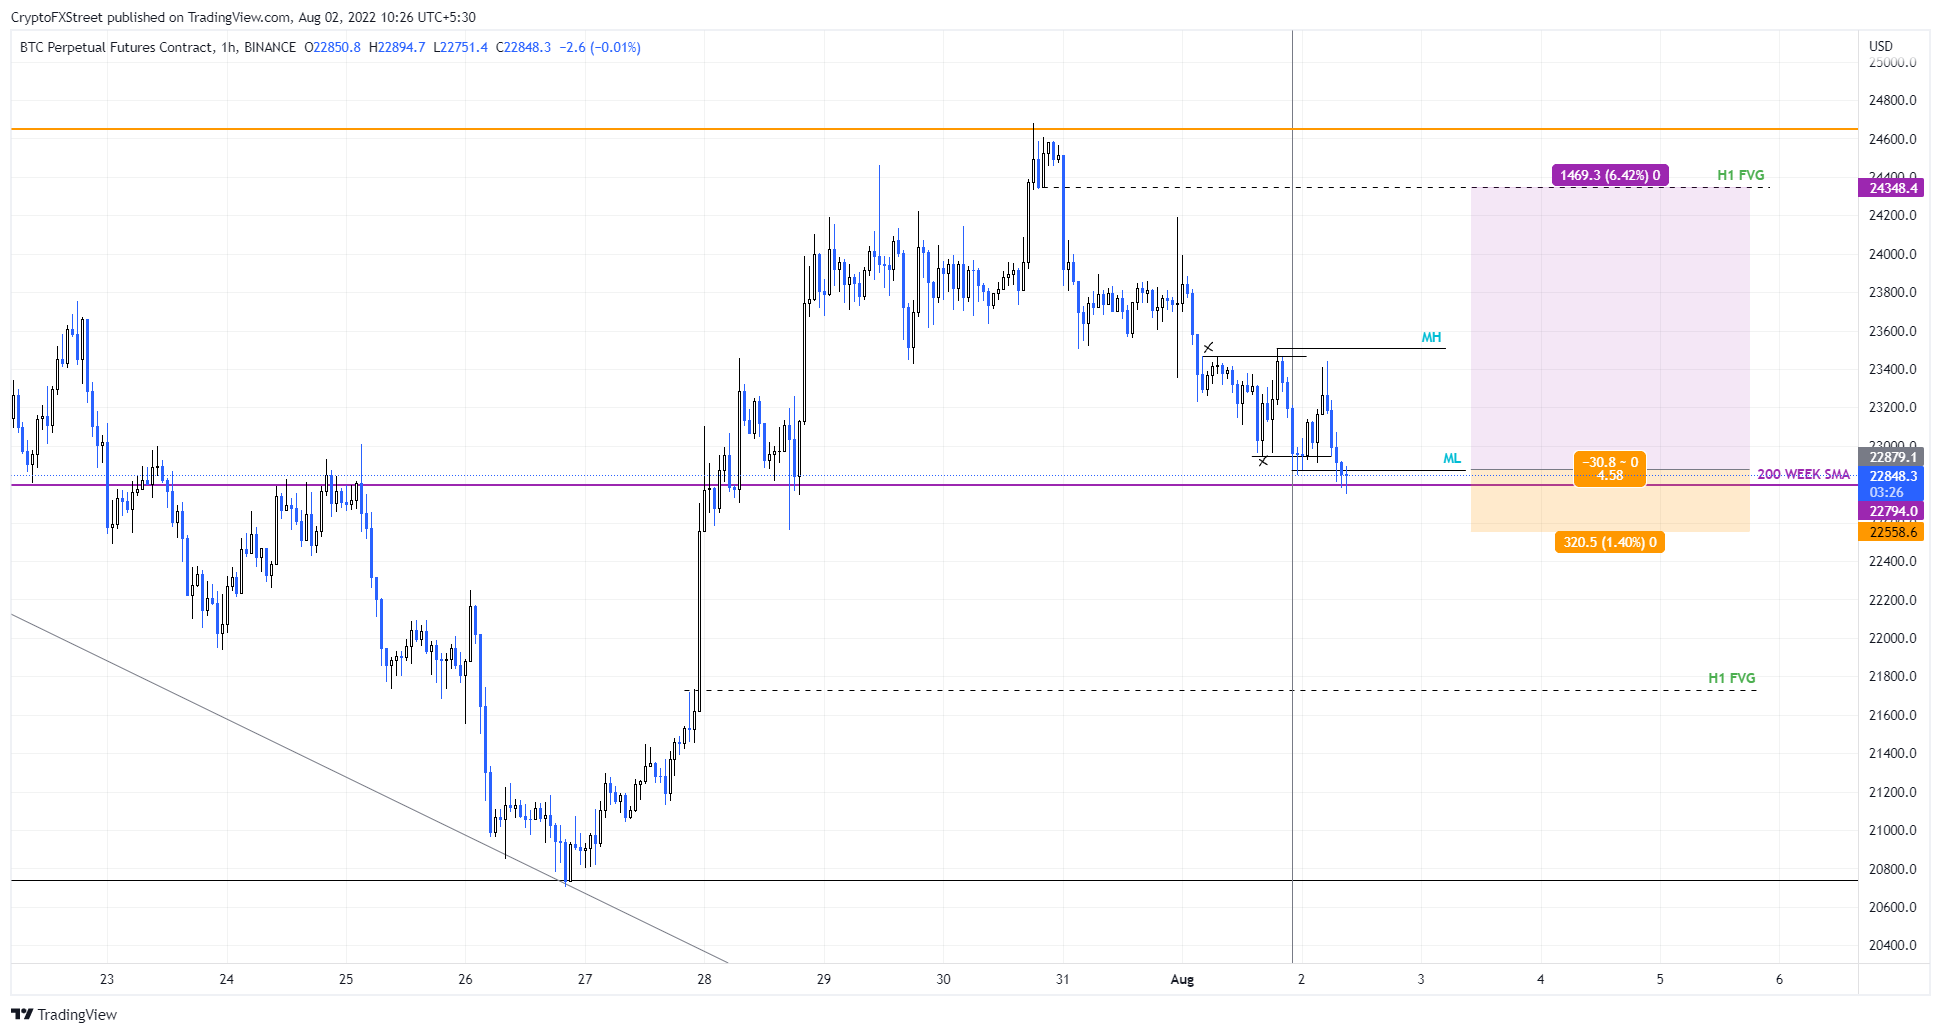
BTC/USDT 1-hour chart
Trade opportunity #2
This trade assumes that the Bitcoin price fills the FVG at $24,347, which will be a signal to open a short position. The reasoning behind this bias is obtained from a high-time-frame chart explained at the start of the article.
Partial profits for this short position can be taken at the 200-week SMA at $22,794 since a minor bounce could occur here.
A breakdown of the support confluence at $22,794 would add credence to our short position and the remaining position can be closed at one-hour FVG at $21,730. In total, this move would constitute a 10% downswing.
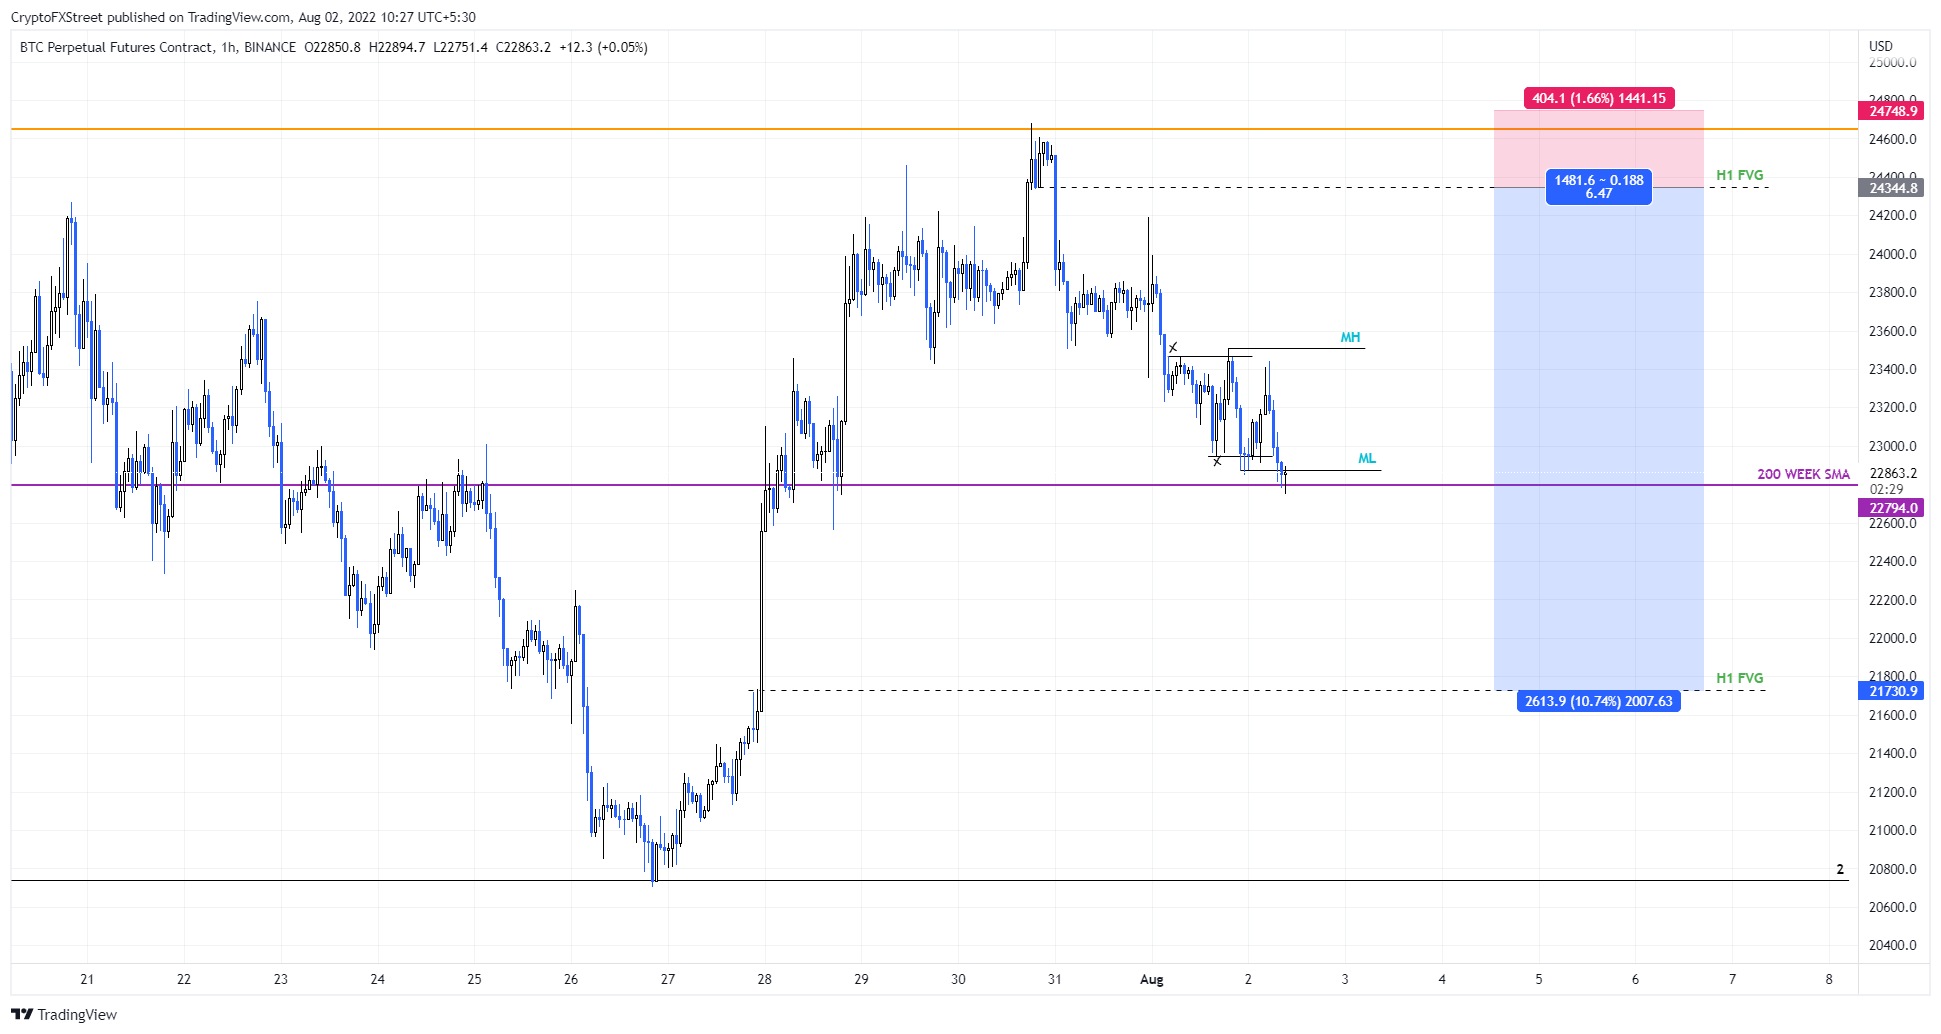
BTC/USDT 1-hour chart
Trade opportunity #3
This trade is basically what would happen if trade opportunity #1 does not pan out and Bitcoin price produces a four-hour candlestick close below 200-week SMA at $22,794, In such a case, investors can wait for BTC to retest the newly flipped resistance level.
Rejection at the 200-week SMA will serve as a secondary confirmation, in which case, investors can open a short position with a stop-loss place generously above MH.
The target for the third trade is the same as the second trade - $21,730.
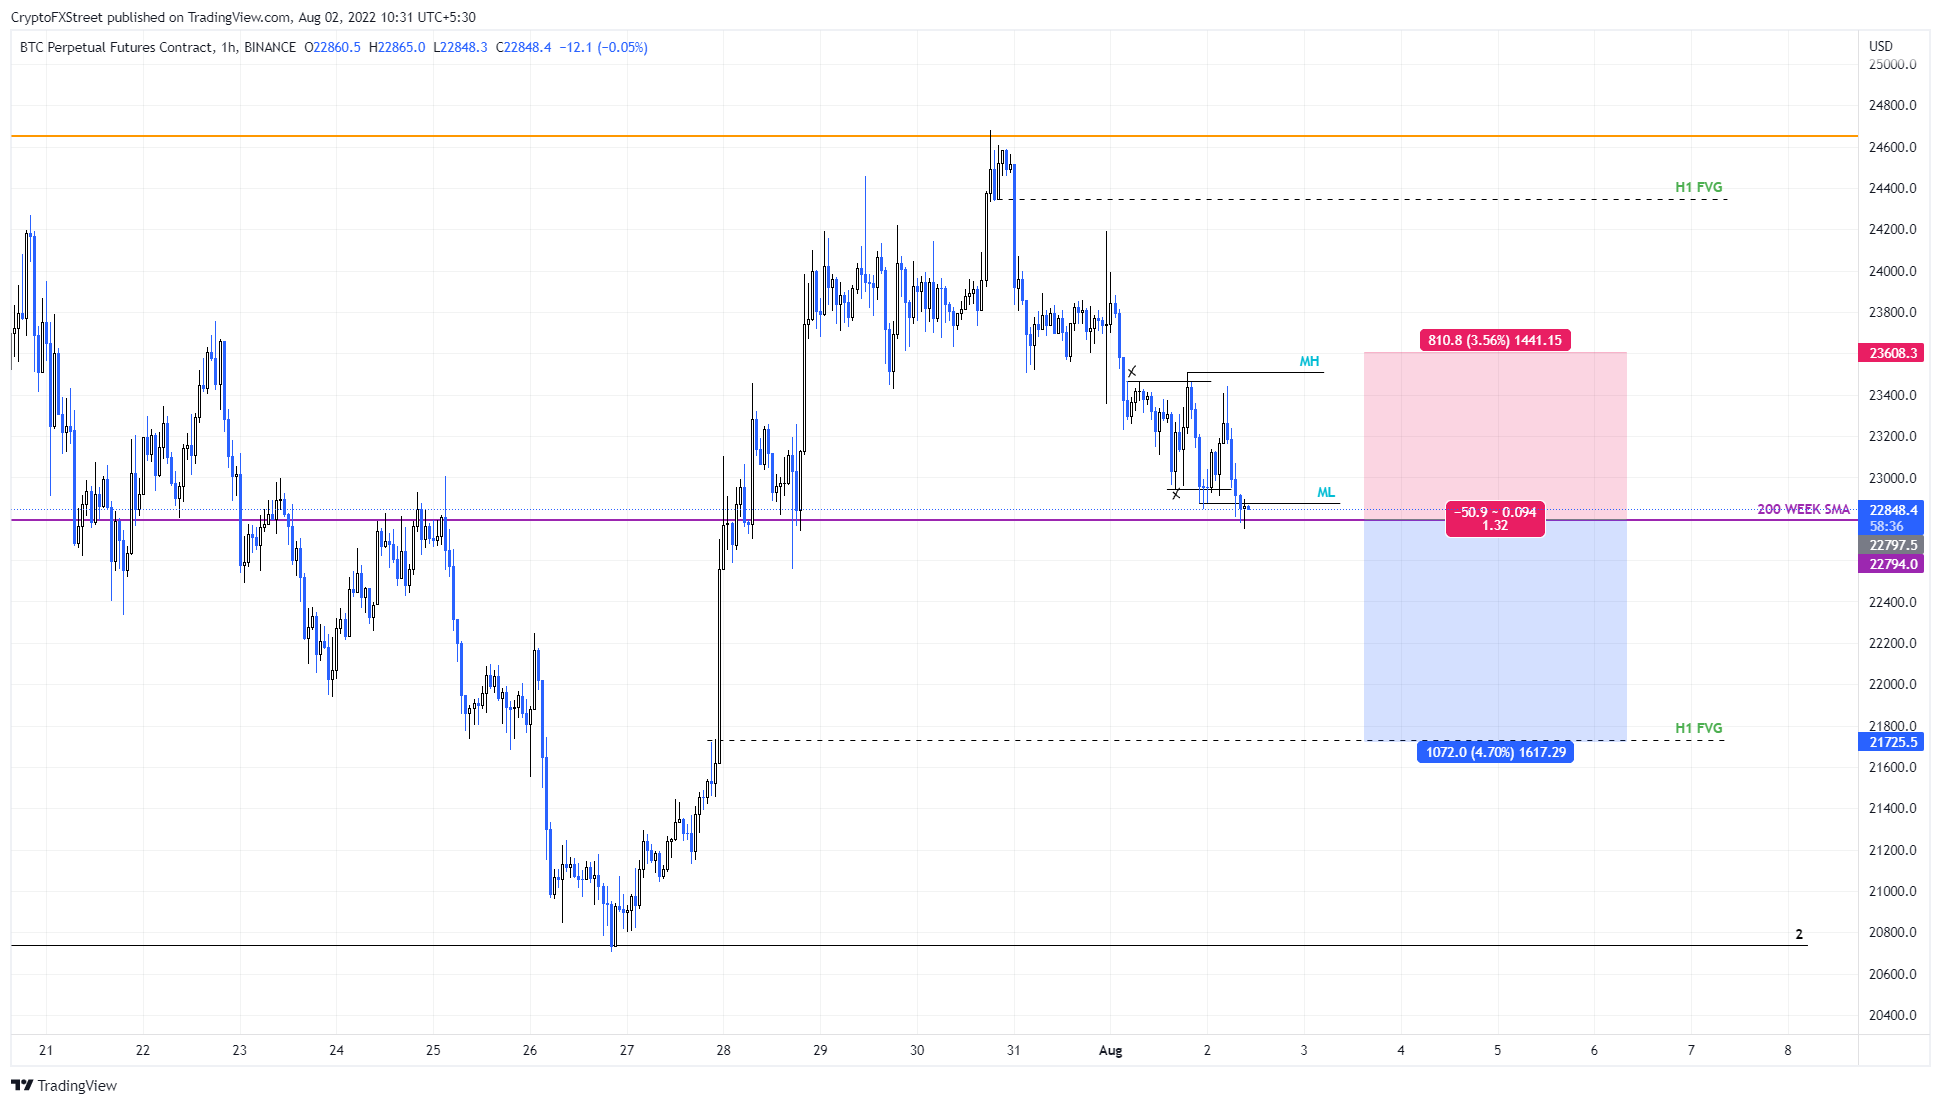
BTC/USDT 1-hour chart
Unlike the first or the second trade, the third one has a high risk due to the uncollected liquidity and the price inefficiencies present to the upside. Hence, market participants should consider all the possibilities before taking action.
Author

Akash Girimath
FXStreet
Akash Girimath is a Mechanical Engineer interested in the chaos of the financial markets. Trying to make sense of this convoluted yet fascinating space, he switched his engineering job to become a crypto reporter and analyst.


