• Optimism price has flashed a buy signal on the three-day chart.
  • If Bitcoin’s bullish outlook sustains in the long term, OP could witness a 40% rally.
  • A flip of the range low at $0.877 into a resistance level on the three-day timeframe will invalidate the bullish theiss. 

Optimism price shows some interesting developments on the three-day chart. The buy signal generated by the Wave Trend indicator, combined with the MRI’s second buy signal that spawned on June 9, suggests that OP could be due for a high timeframe trend reversal. 

Also read: Ethereum Layer 2 Optimism beats MATIC to the curb, sees massive spike in active addresses

Optimism price prepares for another explosive run-up

Optimism price shot up 272% between December 2022 and February 2023. This impressive run-up set up an all-time high at $3.289.  Soon thereafter, OP bears took over, triggering a correction so brutal that it undid all the gains in the next 105 days.

The Momentum Reversal Indicator (MRI) flashed two buy signals during this descent on May 13 and June 9. After the second buy signal, Optimism price rallied 38% in the next nine days. The Layer 2 token currently trades at $1.327, which is roughly 50% from the local bottom at $0.877. 

The Relative Strength Index has dipped below the oversold zone and has recovered, indicating a resurgence of bullish momentum as sidelined buyers step in to accumulate OP tokens. The same can be seen in the Awesome Oscillator indicator, which shows a decline in bearish momentum via the shift in histograms from red to green. 

Lastly, the Wave Trend indicator has flashed a buy signal under the oversold region, making it the best time to accumulate OP. To add to this bullishness, Optimism price currently sits above the $1.195 support level, which is critical in kickstarting OP’s bull rally.
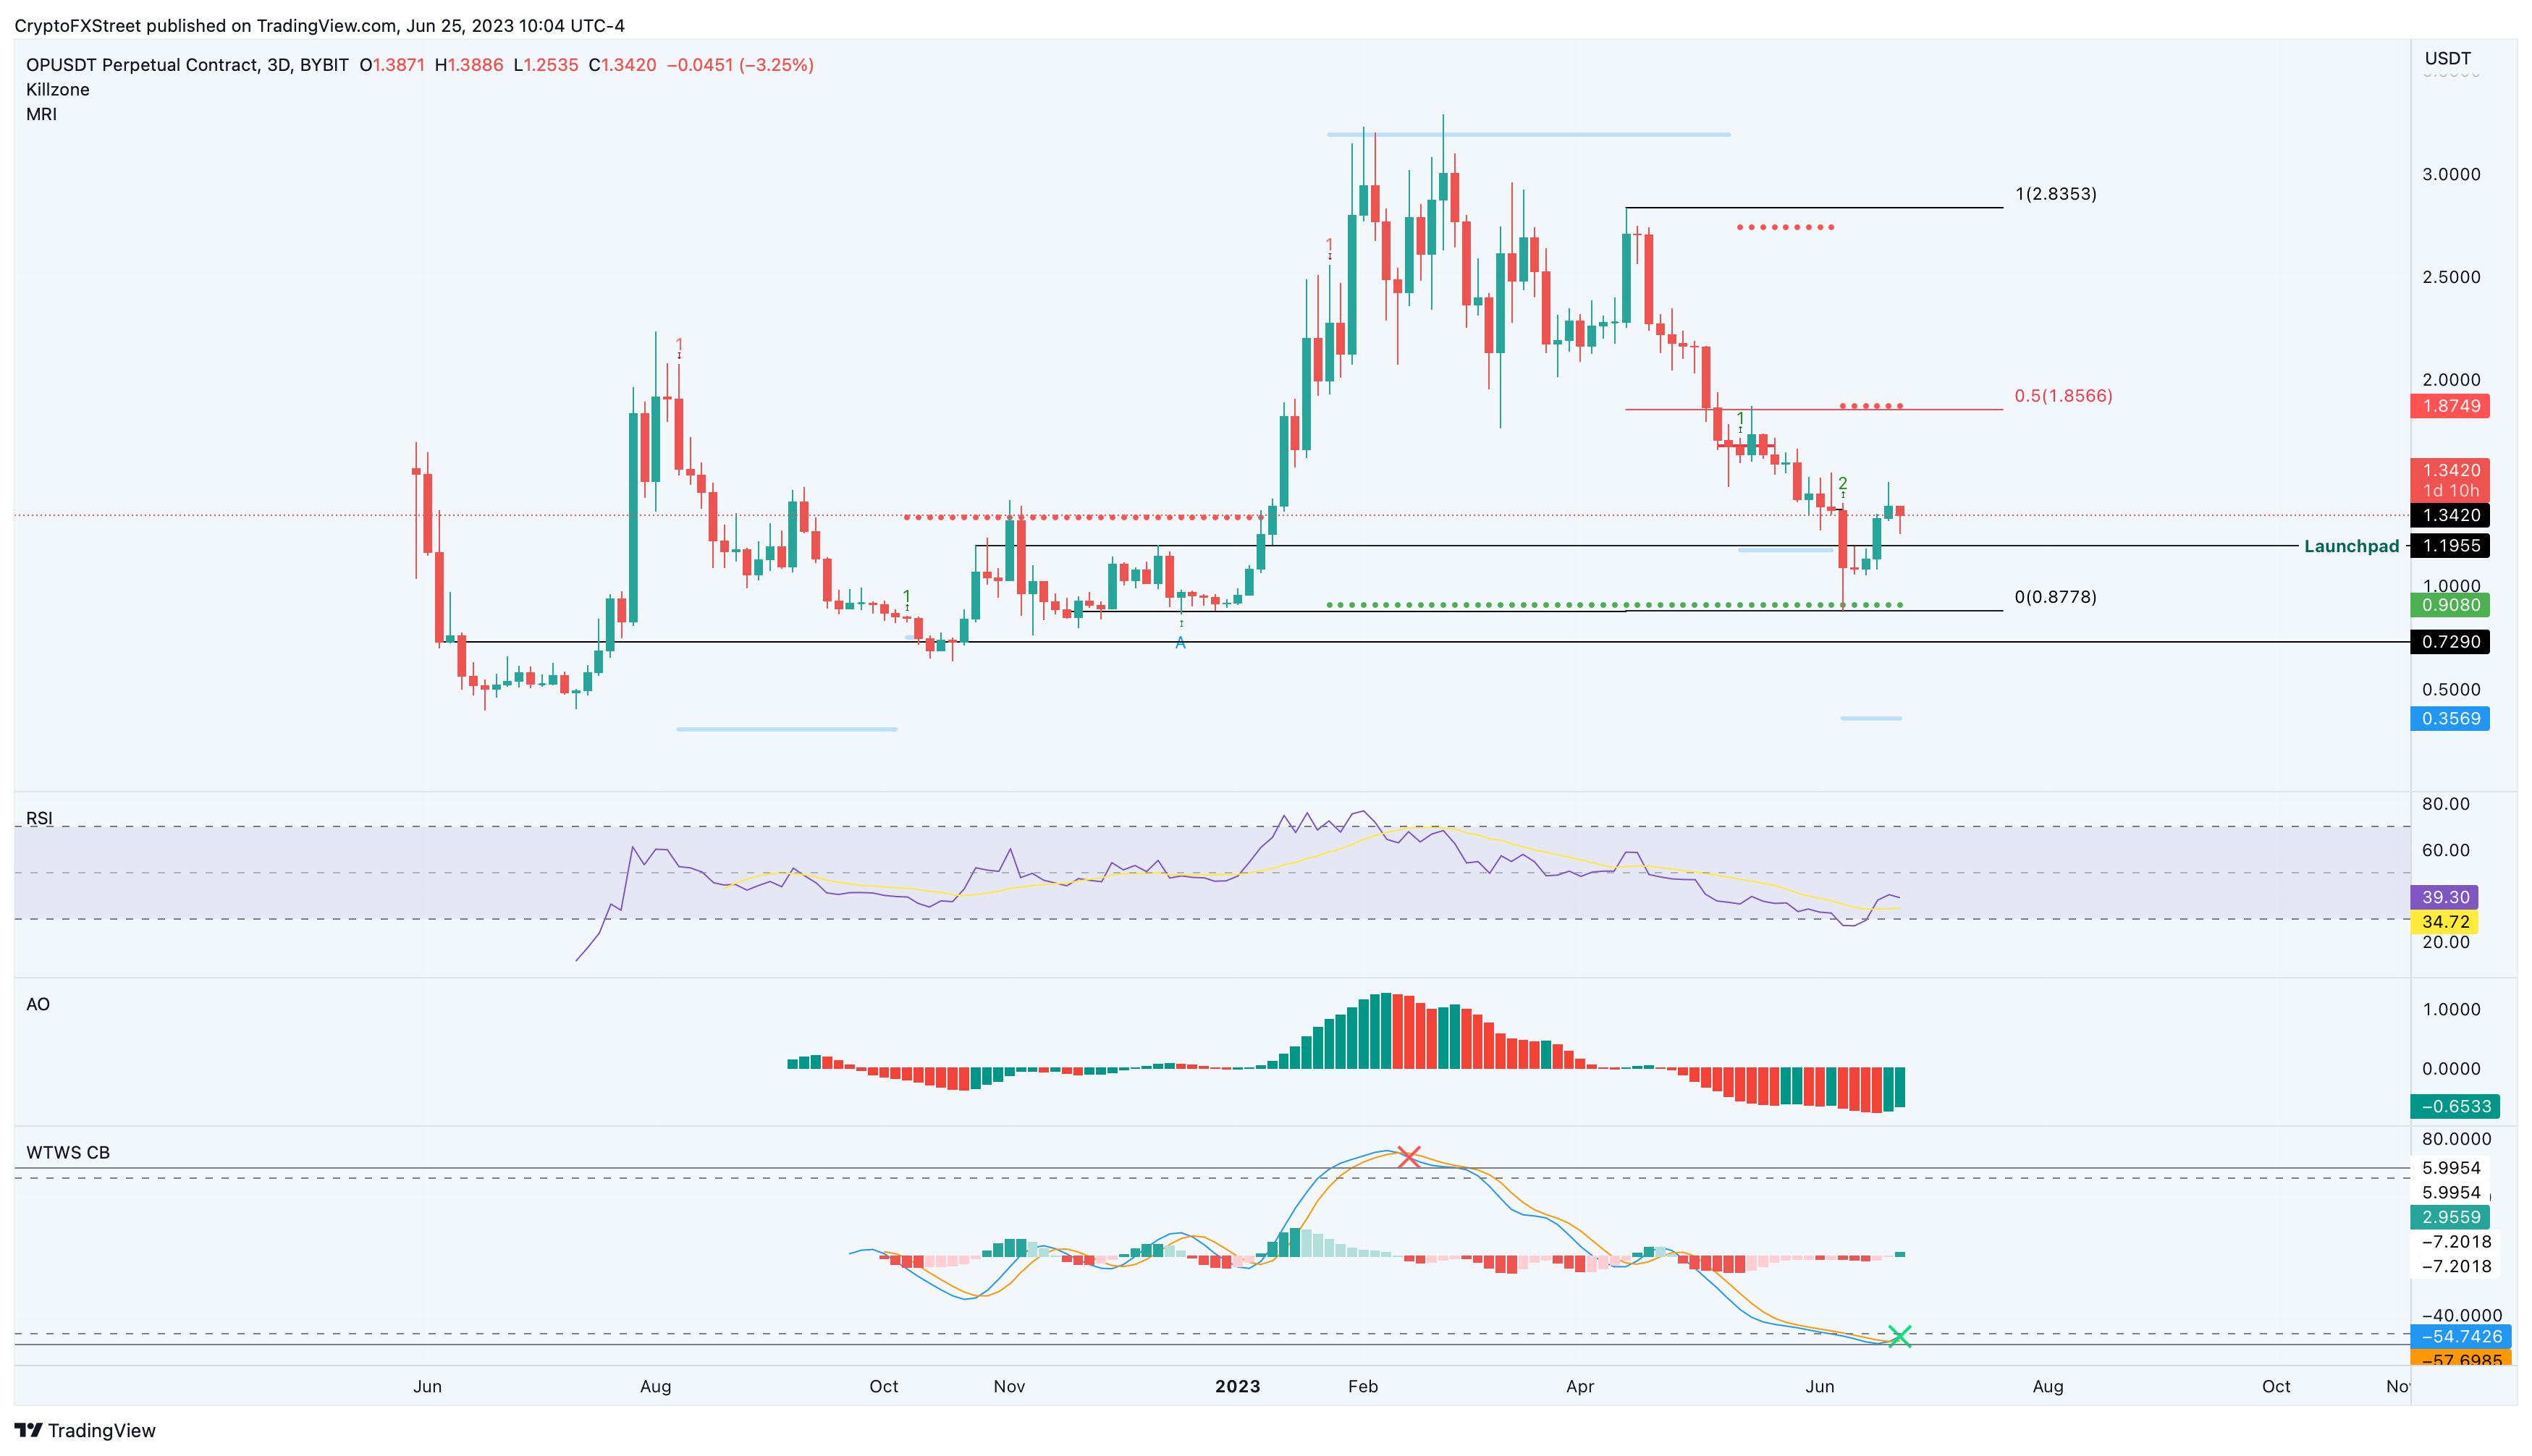
OP/USDT 3-day chart

OP/USDT 3-day chart

Furthermore, whales holding between 100,000 and 1,000,000 OP tokens seem to have been accumulating since May 22. Roughly 35.85 million whales joined this category in the last month. Additionally, whales holding between 1,000,000 to 10,000,000 OP tokens have also increased from 341 million on May 30 to 410 on June 25. 

Due to the massive scale of these whales’ accumulation spree, it could be a hint that Optimism price might be primed for a rally.

OP Supply Distribution chart

OP Supply Distribution chart

The accumulation from high net-worth investors can be confirmed by a consistent increase in on-chain volume. As seen in the chart below, there are three higher highs, suggesting an increased activity from these high net-worth investors.

OP On-chain Volume chart

OP On-chain Volume chart

While the bullish outlook can be confirmed from both a technical and on-chain perspective, investors need to be careful of Bitcoin. A sudden spike in bearish volume that knocks BTC lower could have a similar effect on altcoins, including OP. 

If Optimism price flips the range low at $0.877 into a resistance level on the three-day timeframe, it will invalidate the bullish theiss by producing a lower low. This move could skew the odds in bears’ favor and potentially trigger a correction to the immediate support level at $0.729. 


Information on these pages contains forward-looking statements that involve risks and uncertainties. Markets and instruments profiled on this page are for informational purposes only and should not in any way come across as a recommendation to buy or sell in these assets. You should do your own thorough research before making any investment decisions. FXStreet does not in any way guarantee that this information is free from mistakes, errors, or material misstatements. It also does not guarantee that this information is of a timely nature. Investing in Open Markets involves a great deal of risk, including the loss of all or a portion of your investment, as well as emotional distress. All risks, losses and costs associated with investing, including total loss of principal, are your responsibility. The views and opinions expressed in this article are those of the authors and do not necessarily reflect the official policy or position of FXStreet nor its advertisers. The author will not be held responsible for information that is found at the end of links posted on this page.

If not otherwise explicitly mentioned in the body of the article, at the time of writing, the author has no position in any stock mentioned in this article and no business relationship with any company mentioned. The author has not received compensation for writing this article, other than from FXStreet.

FXStreet and the author do not provide personalized recommendations. The author makes no representations as to the accuracy, completeness, or suitability of this information. FXStreet and the author will not be liable for any errors, omissions or any losses, injuries or damages arising from this information and its display or use. Errors and omissions excepted.

The author and FXStreet are not registered investment advisors and nothing in this article is intended to be investment advice.

Join Telegram

Recommended content


Recommended Content

Editors’ Picks

Celebrity meme coins controversy continues amid Pump.fun revenue dominance

Celebrity meme coins controversy continues amid Pump.fun revenue dominance

Pump.fun outperformed the Ethereum blockchain on Tuesday after raking in $1.99 million. Following this achievement, a meme coin based on actress Sydney Sweeney was the subject of controversy after its developers dumped their bags on investors.

More Meme Coins News

PEPE's on-chain metrics indicate potential rally after weeks of silence

PEPE's on-chain metrics indicate potential rally after weeks of silence

PEPE has struggled to see any significant price move after reaching an all-time high in May. Increased adoption rate and low MVRV ratio indicate a bullish run may be on the horizon. A single PEPE outflow from Binance worth $14.7 million gives credence to signs of bullish expectation.

More Pepe News

Ethereum has failed to overcome key resistance despite bullish sentiment surrounding ETH ETF

Ethereum has failed to overcome key resistance despite bullish sentiment surrounding ETH ETF

Ethereum (ETH) is down more than 1.4% on Tuesday following another ETH sale from the Ethereum Foundation. Meanwhile, crypto exchange Gemini's recent report reveals that ETH ETF could see about $5 billion in net inflows within six months of launch.

More Ethereum News

Crypto community blasts Polkadot following report of treasury spending

Crypto community blasts Polkadot following report of treasury spending

Polkadot reports $87 million of treasury spending during H1. Crypto community members expressed harsh feelings toward the DOT team's high spending. DOT is up more than 2% in the past 24 hours but risks correction following the report.

More Polkadot News

Bitcoin: BTC price correction could end in July, according to seasonal data

Bitcoin: BTC price correction could end in July, according to seasonal data

Bitcoin (BTC) price appears poised for a decline this week, influenced by slight outflows in US spot ETFs, selling activity among BTC miners, and a combined transfer of 4,690.28 BTC to centralized exchanges by the US and German governments.

Read full analysis

BTC

ETH

XRP