• Ethereum price is flirting with a break of support in the summer rally. 
  • ETH price could probe lower in search of a floor, which could mean a 22% discount. 
  • In a worst-case scenario, ETH price could fully collapse and give back its summer gains, with a 20% decline.

Ethereum (ETH) price is taking a step back this morning during the ASIA PAC and European session as a third consecutive day of negative prints is set to materialise. In concert with global markets, the mighty dollar looks to be setting the record straight and weighing on cryptocurrencies overall. There is a slim chance that this is a mere bear trap, but some elements point to a correction unfolding as the summer rally runs on its last legs.

ETH price says goodbye to the summer rally

Ethereum price takes a step back after briefly sticking its nose above $2,000, which quickly got followed by a fade that is now starting to deepen out. Investors are currently reflecting on whether to hold, buy or sell as ETH price is around the green ascending trend line, which has acted as the backbone of this summer rally. All in all, seeing the overheated Relative Strength Index, the dollar strength and the global market reaction – with Fed Futures grinding higher in line with 75 bp rate hike expectations for September – these look to be enough to trigger a correction. 

ETH price will tank towards its nearest level of support once it backs away a few dollars from the green ascending trend line. The first support level is the green horizontal line at $1,688 which was the base for the bearish triangle from May and June. That is roughly a 10% decline from where price action is trading now, with the monthly pivot at $1,500 additionally underpinned by the 55-day Simple Moving Average (SMA) as a failsafe area catching any falling knives and refraining from making more than 20% of losses.
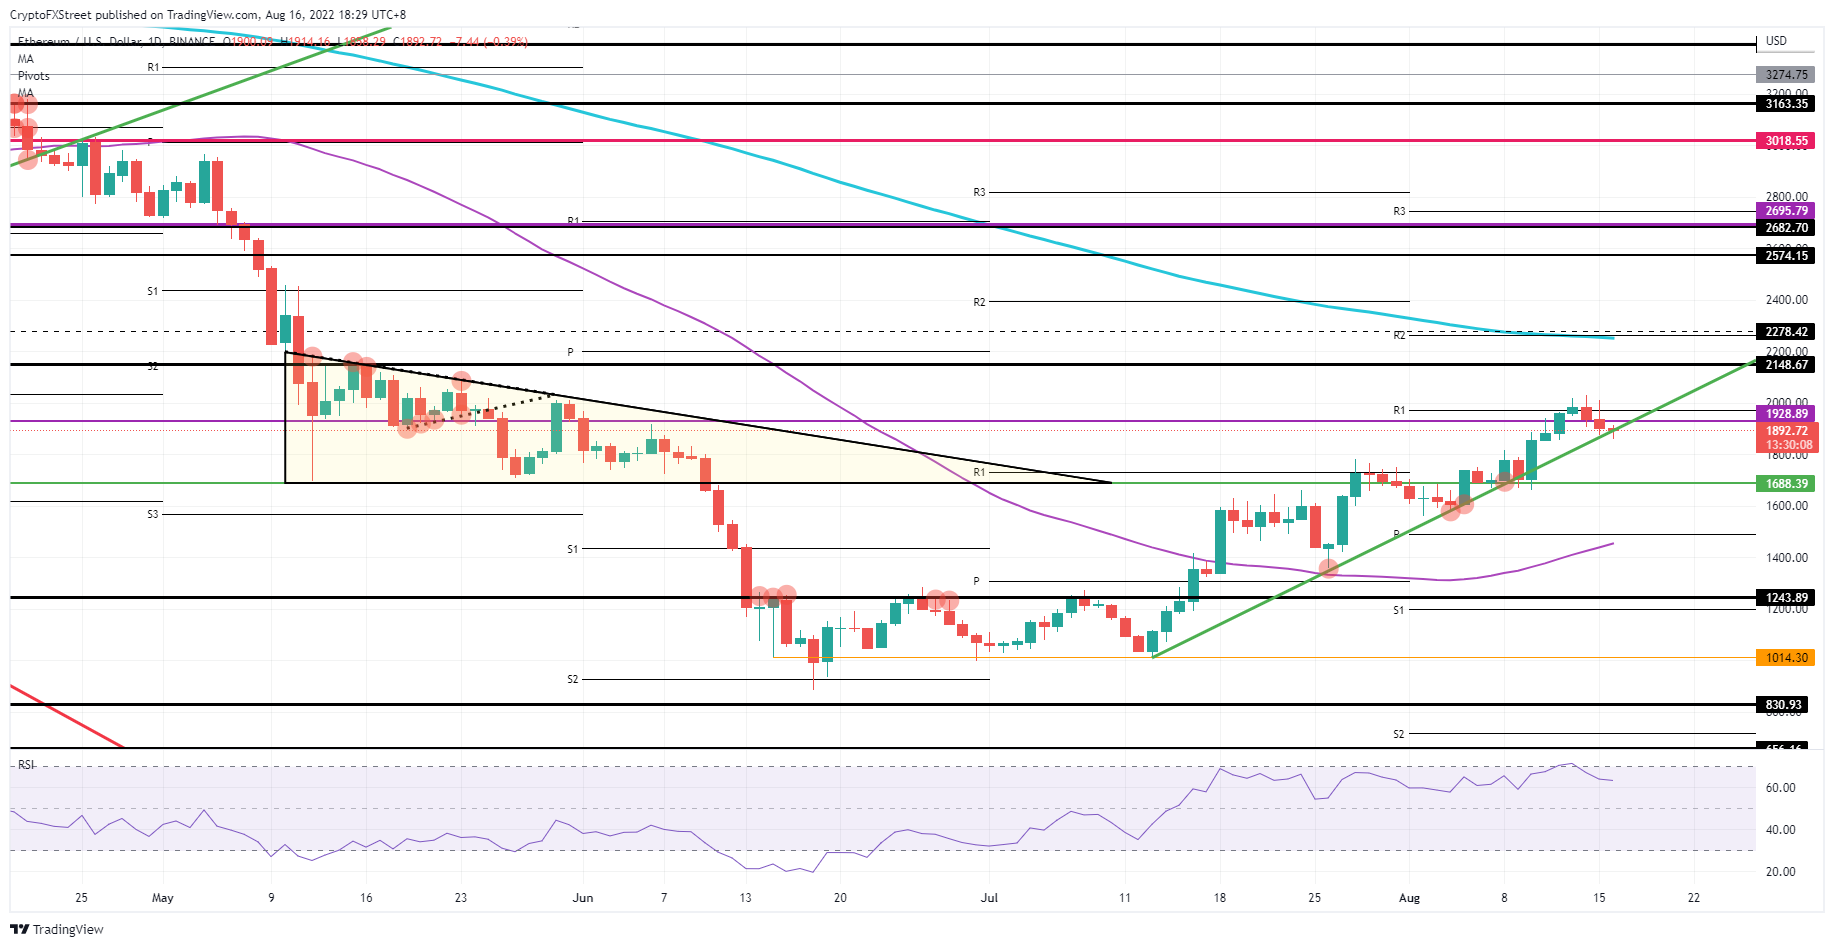
ETH/USD Daily chart

ETH/USD Daily chart

This short excursion below the summer rally support could be an easy bear trap, with price action quickly pulling back up towards $2,000 again. Once that level breaks firmly and price action moves substantially higher, expect a big squeeze on the short-sellers and a rally up to $2,278, with 19% of gains on the docket. At that level, the 200-day SMA is on the cusp of being broken to the upside and pointing to massive gains for the last quarter of 2022.


Information on these pages contains forward-looking statements that involve risks and uncertainties. Markets and instruments profiled on this page are for informational purposes only and should not in any way come across as a recommendation to buy or sell in these assets. You should do your own thorough research before making any investment decisions. FXStreet does not in any way guarantee that this information is free from mistakes, errors, or material misstatements. It also does not guarantee that this information is of a timely nature. Investing in Open Markets involves a great deal of risk, including the loss of all or a portion of your investment, as well as emotional distress. All risks, losses and costs associated with investing, including total loss of principal, are your responsibility. The views and opinions expressed in this article are those of the authors and do not necessarily reflect the official policy or position of FXStreet nor its advertisers. The author will not be held responsible for information that is found at the end of links posted on this page.

If not otherwise explicitly mentioned in the body of the article, at the time of writing, the author has no position in any stock mentioned in this article and no business relationship with any company mentioned. The author has not received compensation for writing this article, other than from FXStreet.

FXStreet and the author do not provide personalized recommendations. The author makes no representations as to the accuracy, completeness, or suitability of this information. FXStreet and the author will not be liable for any errors, omissions or any losses, injuries or damages arising from this information and its display or use. Errors and omissions excepted.

The author and FXStreet are not registered investment advisors and nothing in this article is intended to be investment advice.

Join Telegram

Recommended content


Recommended Content

Editors’ Picks

Here are the best and worst-performing cryptocurrencies in H1 2024

Here are the best and worst-performing cryptocurrencies in H1 2024

A recent report by Crypto Koryo on Wednesday revealed meme coins as the top performers among cryptocurrencies so far in 2024, with several altcoins coming in behind. The worst-performing tokens are DeFi and governance tokens.

More Cryptocurrencies News

Ethereum poised to follow Nvidia's steps as Bitwise files updated S-1 draft

Ethereum poised to follow Nvidia's steps as Bitwise files updated S-1 draft

Ethereum (ETH) is down 3% on Wednesday following Bitwise filing an updated S-1 draft and a wider market downturn with potential Mt. Gox BTC supply flooding the market. 

More Ethereum News

What to expect from altcoins as ETH ETF approval draws closer

What to expect from altcoins as ETH ETF approval draws closer

As the crypto market continues consolidating on Wednesday, altcoins show mixed signals ahead of the spot ETH ETF launch. Many have predicted that the alt season may not occur in this cycle following the market lull. However, two key metrics suggest otherwise.

More Cryptocurrencies News

PolitiFi meme coins surge as Biden support lowers

PolitiFi meme coins surge as Biden support lowers

Crypto prediction markets favor Kamala Harris over President Joe Biden as Democratic nominee in upcoming presidential elections. Meme coins based on Vice President Harris rallied amid BODEN token's 30% decline. Other tokens based on possible replacements for Biden experienced similar surges.

More Cryptocurrencies News

Bitcoin: BTC price correction could end in July, according to seasonal data

Bitcoin: BTC price correction could end in July, according to seasonal data

Bitcoin (BTC) price appears poised for a decline this week, influenced by slight outflows in US spot ETFs, selling activity among BTC miners, and a combined transfer of 4,690.28 BTC to centralized exchanges by the US and German governments.

Read full analysis

BTC

ETH

XRP