- VeChain has been in a pennant consolidation for ten consecutive days.
- A breakout looks likely in favor of the buyers for three technical reasons.
- With bulls in control, expect 28% gain by the end of September to $0.15.
VeChain (VET) has been in a sideways pennant for almost two weeks between $0.13 on the upside and $0.10 on the downside. With lower highs and higher lows, price is squeezed in from both ways, ready for the breakout. Buyers look to profit from that breakout, as three technical indicators are building the case in favor of the bulls.
VeChain’s break out of the pennant will see a quick pop higher toward $0.15
VeChain has been flip-flopping a little bit between buyers and sellers for the past few days and looks to have chosen sides now. Buyers got help from three technical elements that can give them enough build-up momentum for the break higher. First, there are the Simple Moving Averages (SMA). Both the 55-day and the 200-day SMA have been giving support to the price action since yesterday, and it is causing VET's price action to get pushed against the descending line of the pennant. With those two elements, bulls already have an essential supportive force.
Add to that the historical level at $0.11, originating from August 8, where the price is now closing solidly above for two trading sessions. This also shows that bulls are in the driving seat. General sentiment will help as stock markets are hinting toward further risk-on with US indices back in the green.
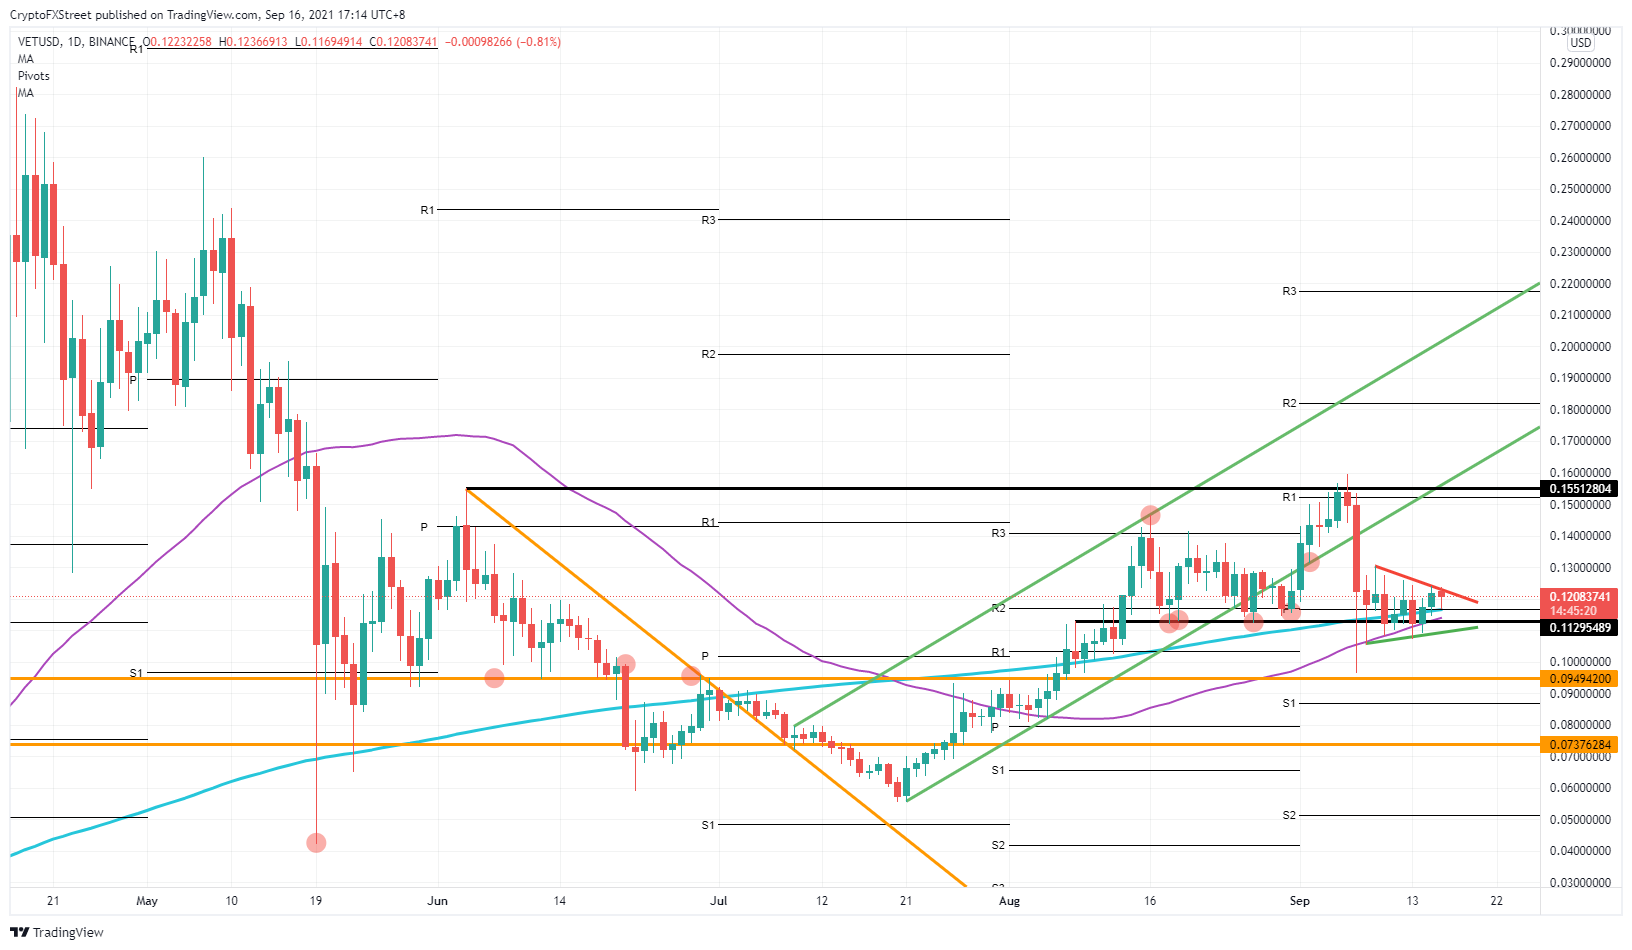
VET/USD daily chart
Expect further inflow from buyers once the pennant is being broken to the upside. From there, it will be a clear path towards $0.15, the high from September 6 in VeChain, as sellers do not have many entry points to provide some counterbalance.
Bears can, however, succeed in rolling over price action in VeChain and go for the break to the downside out of the pennant. In that case, expect a retest of $0.1 and $0.095 as the first halt for profit-taking.
Information on these pages contains forward-looking statements that involve risks and uncertainties. Markets and instruments profiled on this page are for informational purposes only and should not in any way come across as a recommendation to buy or sell in these assets. You should do your own thorough research before making any investment decisions. FXStreet does not in any way guarantee that this information is free from mistakes, errors, or material misstatements. It also does not guarantee that this information is of a timely nature. Investing in Open Markets involves a great deal of risk, including the loss of all or a portion of your investment, as well as emotional distress. All risks, losses and costs associated with investing, including total loss of principal, are your responsibility. The views and opinions expressed in this article are those of the authors and do not necessarily reflect the official policy or position of FXStreet nor its advertisers. The author will not be held responsible for information that is found at the end of links posted on this page.
If not otherwise explicitly mentioned in the body of the article, at the time of writing, the author has no position in any stock mentioned in this article and no business relationship with any company mentioned. The author has not received compensation for writing this article, other than from FXStreet.
FXStreet and the author do not provide personalized recommendations. The author makes no representations as to the accuracy, completeness, or suitability of this information. FXStreet and the author will not be liable for any errors, omissions or any losses, injuries or damages arising from this information and its display or use. Errors and omissions excepted.
The author and FXStreet are not registered investment advisors and nothing in this article is intended to be investment advice.
Recommended Content
Editors’ Picks
Ripple on-chain metrics show bullish signs amidst legal struggle with SEC, XRP eyes recovery
Ripple made a comeback above $0.48 on Tuesday and hovers above that level in Wednesday’s European session. Ripple on-chain metrics such as transaction volume and Network Realized Profit/Loss have turned bullish, supporting a recovery in the altcoin.
Bitcoin price falls amidst German government transfers, miners activity
Bitcoin (BTC) extends correction on Wednesday and hovers around $61,000 after finding resistance near the $64,000 level on Monday. Recent on-chain data indicates heightened selling activity from Bitcoin miners early in the week.
Crypto Today: Bitcoin erases gains from end of June, Ethereum declines while Ripple holds
Bitcoin wipes out gains from the last week of June and falls below $60,000 on Wednesday. Ethereum and top altcoins ranked by market capitalization erased gains as the inflation outlook worsened. Ripple holds on to recent gains and hovers above $0.48 on Wednesday.
Three reasons why altcoins could shake off losses this week
On-chain data from Santiment shows that altcoins are currently in the opportunity zone, or generating buy signals. The top three altcoins in the buy zone are Basic Attention Token (BAT), Chromia (CHR), and Highstreet (HIGH), per Santiment.
Bitcoin: BTC price correction could end in July, according to seasonal data
Bitcoin (BTC) price appears poised for a decline this week, influenced by slight outflows in US spot ETFs, selling activity among BTC miners, and a combined transfer of 4,690.28 BTC to centralized exchanges by the US and German governments.