![]() Sheldon McIntyre, CMT
Sheldon McIntyre, CMT
Independent Analyst
- VeChain price beats the Anchored VWAP from the beginning of 2021 and the 200-day simple moving average (SMA).
- VET has rallied over 20% since triggering the double bottom pattern on August 6.
- Intra-day Relative Strength Indexes (RSI) are now showing a bearish momentum divergence.
VeChain price struggled to overcome the Anchored VWAP at $0.087 from July 26 to August 4, raising doubts about the sustainability of the rebound from the July 20 low. The 6.18% gain on August 6 broke the resistance of the indicator and triggered the double bottom pattern. The resulting VET price action has been impressive, lifting the cryptocurrency above the 200-day SMA at $0.099 and, on course, to tag the measured move price target of the double bottom.
VeChain price consolidation clears weak holders
VeChain price was contained by the Anchored VWAP for nine sessions while simultaneously holding the 50-day SMA, creating the type of consolidation that weeded out the weak holders from the initial burst higher and established the foundation for the continuation of the rally. The resulting price compression proved strategic as VET defeated the trifecta of resistance that included the Anchored VWAP at $0.087, the double bottom trigger at $0.095 and the 200-day SMA at $0.099 in a couple of days.
With VeChain price above the trifecta of resistance, VET investors should prepare for a rally continuation to the double bottom measured move price target of $0.135, which is over 21% from the current price and almost 42% from the double bottom entry price. The target closely coincides with the 38.2% Fibonacci retracement of the May-June correction at $0.133.
To rally beyond the measured move price target to the 50% retracement at $0.162 will require considerable firepower as the target is overshadowed by several highs corresponding to the late May and early June periods.
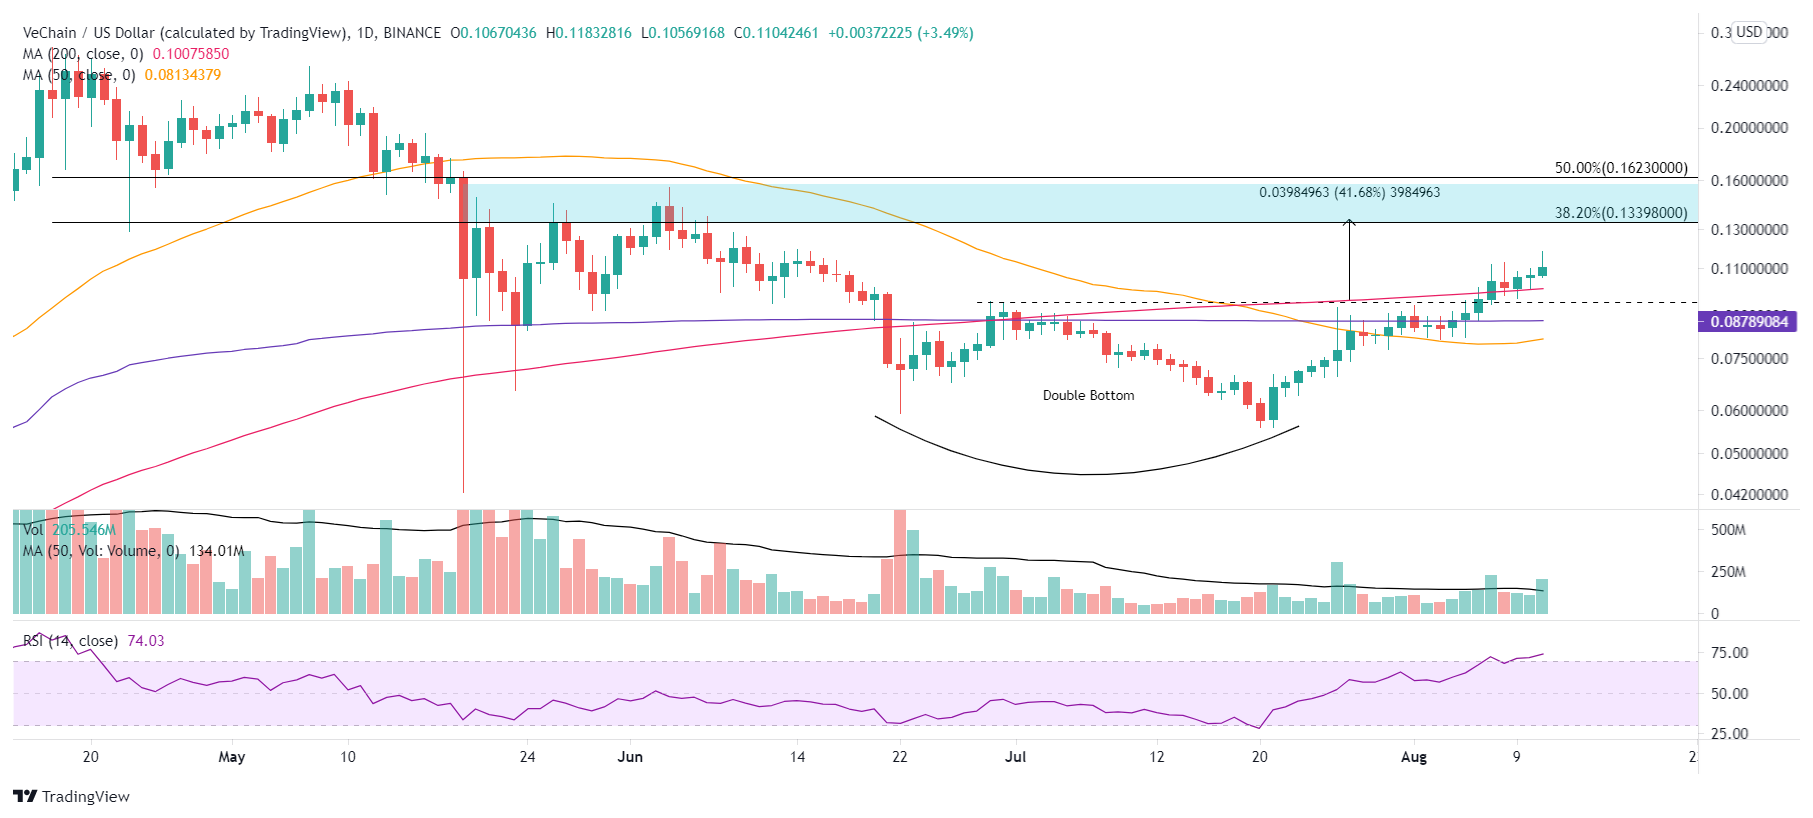
VET/USD daily chart
A negative development for VeChain price is the appearance of a bearish momentum divergence on the intra-day charts. It points to declining VET momentum over the last few days and the potential for a test of the double bottom breakout price of $0.095.
If the divergence introduces a pullback, VeChain price is well supported by the previous trifecta of resistance, ranging from $0.087 to $0.100, representing a VET pullback of 15-20%
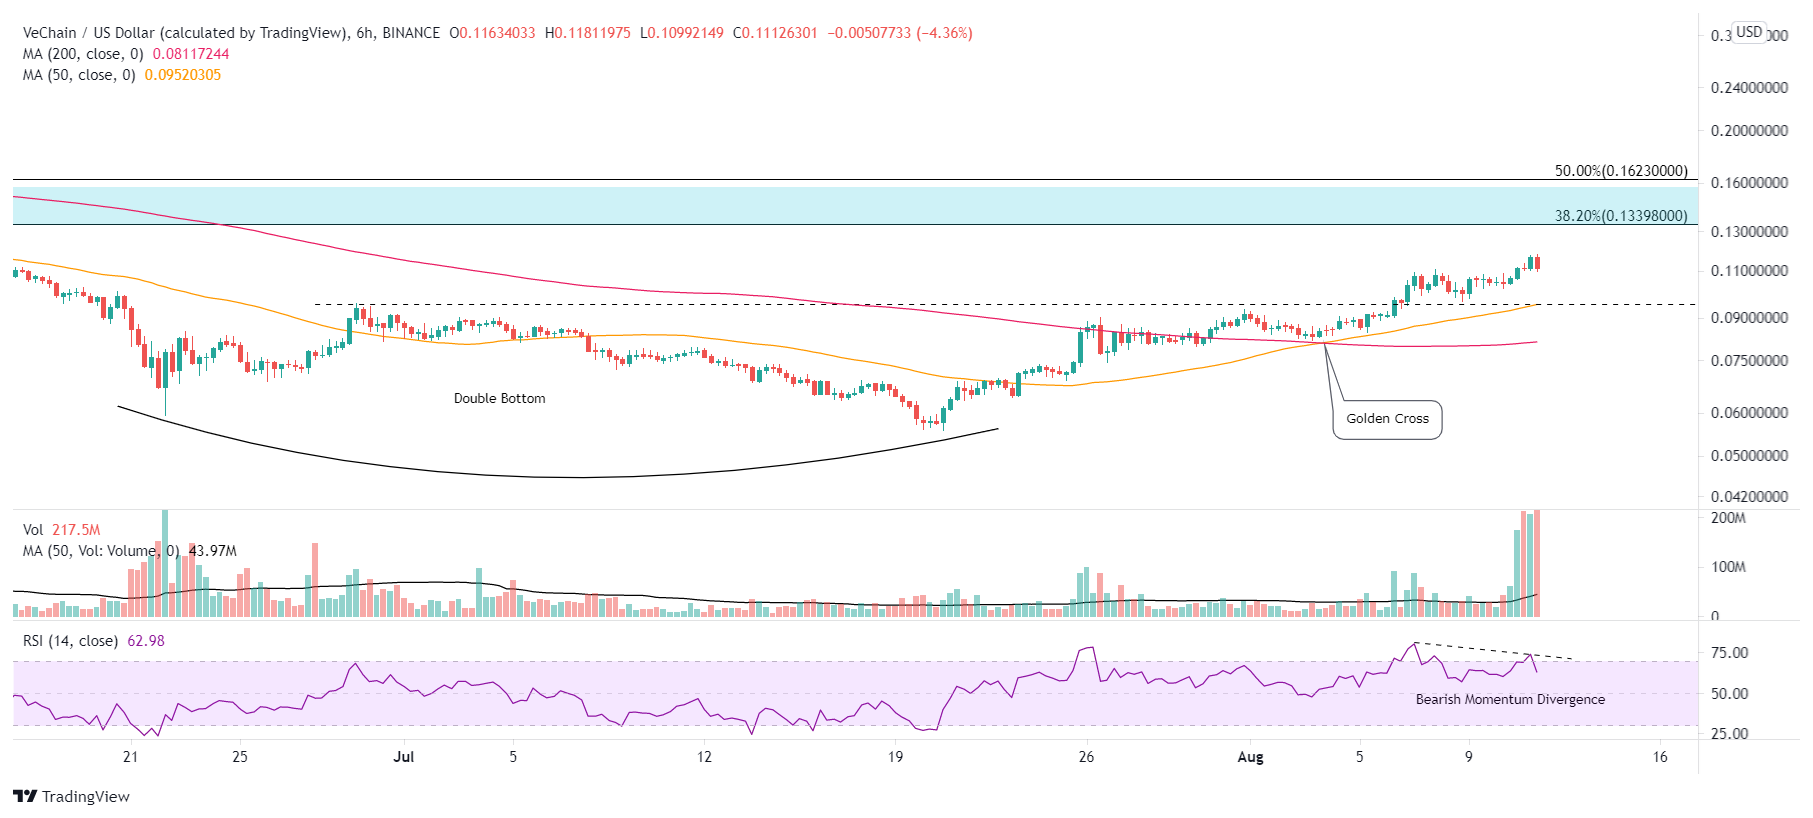
VET/USD 6-hour chart.
The VeChain price action and the volume profile following the breakout indicate accumulation by VET speculators. It supports higher prices and a test of the measured move target of $0.135 in the short term.
Note: All information on this page is subject to change. The use of this website constitutes acceptance of our user agreement. Please read our privacy policy and legal disclaimer. Opinions expressed at FXstreet.com are those of the individual authors and do not necessarily represent the opinion of FXstreet.com or its management. Risk Disclosure: Trading foreign exchange on margin carries a high level of risk, and may not be suitable for all investors. The high degree of leverage can work against you as well as for you. Before deciding to invest in foreign exchange you should carefully consider your investment objectives, level of experience, and risk appetite. The possibility exists that you could sustain a loss of some or all of your initial investment and therefore you should not invest money that you cannot afford to lose. You should be aware of all the risks associated with foreign exchange trading, and seek advice from an independent financial advisor if you have any doubts.
Recommended Content
Editors’ Picks

Monero Price Forecast: XMR soars over 19% amid rising demand for privacy coins
Monero (XMR) price is extending its gains by 19% at the time of writing on Monday, following a 9.33% rally the previous week. On-chain metrics support this price surge, with XMR’s open interest reaching its highest level since December 20.

Top 3 Price Prediction Bitcoin, Ethereum, Ripple: BTC and ETH stabilize while XRP shows strength
Bitcoin (BTC) and Ethereum (ETH) prices are stabilizing at around $93,500 and $1,770 at the time of writing on Monday, following a rally of over 10% and 12% the previous week. Ripple (XRP) price also rallied 8.3% and closed above its key resistance level last week, indicating an uptrend ahead.

Ethereum Price Forecast: ETH ETFs post first weekly inflows since February
Ethereum (ETH) recovered the $1,800 price level on Saturday after US spot Ether ETFs (exchange-traded funds) recorded their first weekly inflows since February.

Defi Development Corporation files to offer $1 billion in securities to boost its Solana holdings
Defi Development Corporation (formerly Janover) filed a registration statement with the Securities & Exchange Commission (SEC) on Friday, signaling its intent to offer and sell a wide range of securities, including common and preferred stock, debt instruments and warrants for the purchase of equity

Bitcoin Weekly Forecast: BTC consolidates after posting over 10% weekly surge
Bitcoin (BTC) price is consolidating around $94,000 at the time of writing on Friday, holding onto the recent 10% increase seen earlier this week.

The Best brokers to trade EUR/USD
SPONSORED Discover the top brokers for trading EUR/USD in 2025. Our list features brokers with competitive spreads, fast execution, and powerful platforms. Whether you're a beginner or an expert, find the right partner to navigate the dynamic Forex market.