- VeChain price action has soared on favorable tailwinds in cryptocurrencies.
- Since the beginning of the week, price action has dropped, and VeChain is struggling to hold gains.
- Supporting factors are present to keep VeChain in check and try to push price action to $0.15.
Unlike the rallies that have seen many of the crypto majors climb swiftly out of their Summer swoons, VeChain is a bit of an outlier as profits remained muted compared to other alt-cryptocurrencies.
Buyers look to refrain from stepping in and supporting the correction that started at the beginning of the week. VET tried to push beyond the monthly R3 resistance level at $0.14 but could not stay above. Buyers were relatively quick to unwind their positions and take profit, hurting VeChain with a third consecutive negative trading day.
VeChain will see buying appetite reemerge once the fundamentals kick in
Buyers do not have much reason to go long for the moment as the monthly R2 resistance level at $0.12 is not proving very much support either. It almost looks like a small head and shoulders pattern starting from August 13. Next to that, there is not much in the way for price action to pick up anytime soon. Buyers will need to look further down before picking up some VeChain in their portfolio. Around $0.11, a few technical elements are in favor of just that.
VeChain has the green ascending supporting trend line in place that is the backbone of the rally since July 21. Add to that the monthly R1 resistance that is now turning to support and has already showed its importance on August 12, where sellers could not push VET price any further down. Price rebounded and moved further up from there.
Last but not least, the 200-day Simple Moving Average (SMA) is falling in line as well with the monthly R1 and trend line. Thus, buyers have three solid reasons to buy and step into the rally.
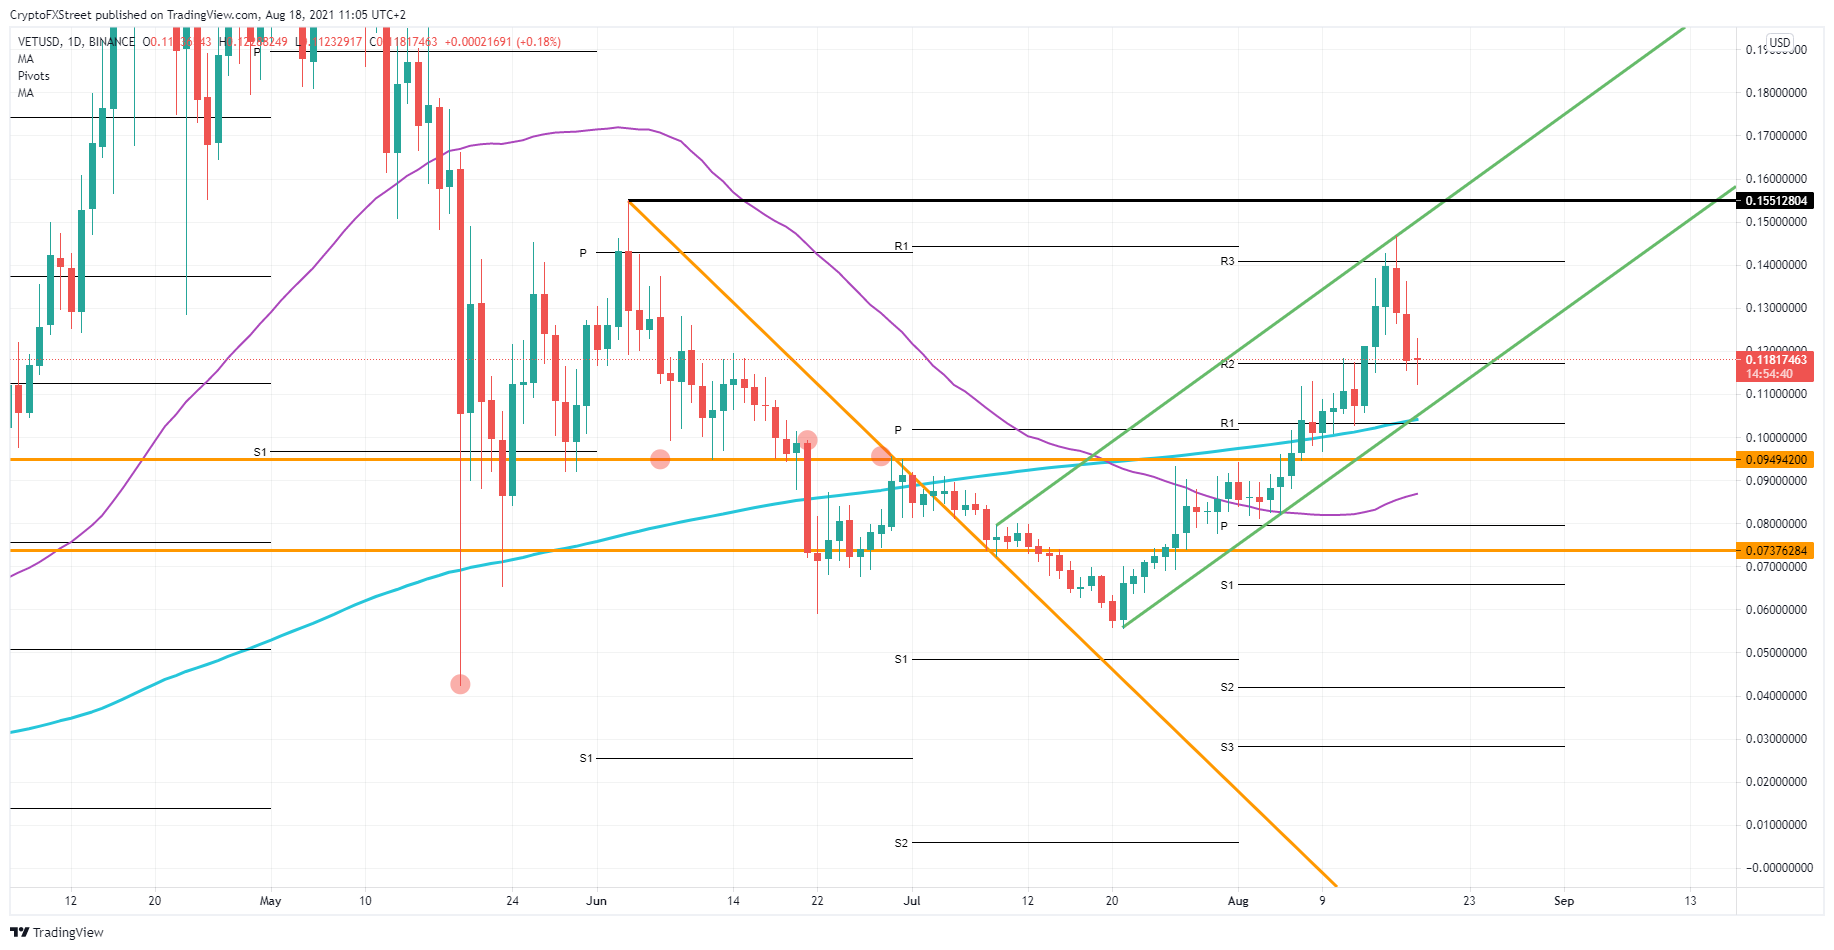
VET/USD daily chart
To the upside, expect a retest of the upper bound of the trend channel formation. Just above there, near-term, VeT is facing $0.15 that looks set to form a double bottom first, before a next leg higher.
If sentiment sours and markets turn to the downside, expect a break of the trend channel. First support comes in at $0.095 with the 55-day SMA just below around $0.09.
Information on these pages contains forward-looking statements that involve risks and uncertainties. Markets and instruments profiled on this page are for informational purposes only and should not in any way come across as a recommendation to buy or sell in these assets. You should do your own thorough research before making any investment decisions. FXStreet does not in any way guarantee that this information is free from mistakes, errors, or material misstatements. It also does not guarantee that this information is of a timely nature. Investing in Open Markets involves a great deal of risk, including the loss of all or a portion of your investment, as well as emotional distress. All risks, losses and costs associated with investing, including total loss of principal, are your responsibility. The views and opinions expressed in this article are those of the authors and do not necessarily reflect the official policy or position of FXStreet nor its advertisers. The author will not be held responsible for information that is found at the end of links posted on this page.
If not otherwise explicitly mentioned in the body of the article, at the time of writing, the author has no position in any stock mentioned in this article and no business relationship with any company mentioned. The author has not received compensation for writing this article, other than from FXStreet.
FXStreet and the author do not provide personalized recommendations. The author makes no representations as to the accuracy, completeness, or suitability of this information. FXStreet and the author will not be liable for any errors, omissions or any losses, injuries or damages arising from this information and its display or use. Errors and omissions excepted.
The author and FXStreet are not registered investment advisors and nothing in this article is intended to be investment advice.
Recommended Content
Editors’ Picks

Crypto fraud soars as high-risk addresses on Ethereum, TRON networks receive $278 billion
The cryptocurrency industry is growing across multiple facets, including tokenized real-world assets, futures and spot ETFs, stablecoins, Artificial Intelligence (AI), and its convergence with blockchain technology, as well as the dynamic decentralized finance (DeFi) sector.

Bitcoin eyes $100,000 amid Arizona Reserve plans, corporate demand, ETF inflows
Bitcoin price is stabilizing around $95,000 at the time of writing on Tuesday, and a breakout suggests a rally toward $100,000. The institutional and corporate demand supports a bullish thesis, as US spot ETFs recorded an inflow of $591.29 million on Monday, continuing the trend since April 17.

Meme coins to watch as Bitcoin price steadies
Bitcoin price hovers around $95,000, supported by continued spot BTC ETFs’ inflows. Trump Official is a key meme coin to watch ahead of a stakeholder dinner to be attended by President Donald Trump. Dogwifhat price is up 47% in April and looks set to post its first positive monthly returns this year.

Cardano Lace Wallet integrates Bitcoin, boosting cross-chain capabilities
Cardano co-founder Charles Hoskinson announced Monday that Bitcoin is integrated into the Lace Wallet, expanding Cardano’s ecosystem and cross-chain capabilities. This integration enables users to manage BTC alongside Cardano assets, providing support for multichain functionality.
Bitcoin Weekly Forecast: BTC consolidates after posting over 10% weekly surge
Bitcoin (BTC) price is consolidating around $94,000 at the time of writing on Friday, holding onto the recent 10% increase seen earlier this week.

The Best brokers to trade EUR/USD
SPONSORED Discover the top brokers for trading EUR/USD in 2025. Our list features brokers with competitive spreads, fast execution, and powerful platforms. Whether you're a beginner or an expert, find the right partner to navigate the dynamic Forex market.