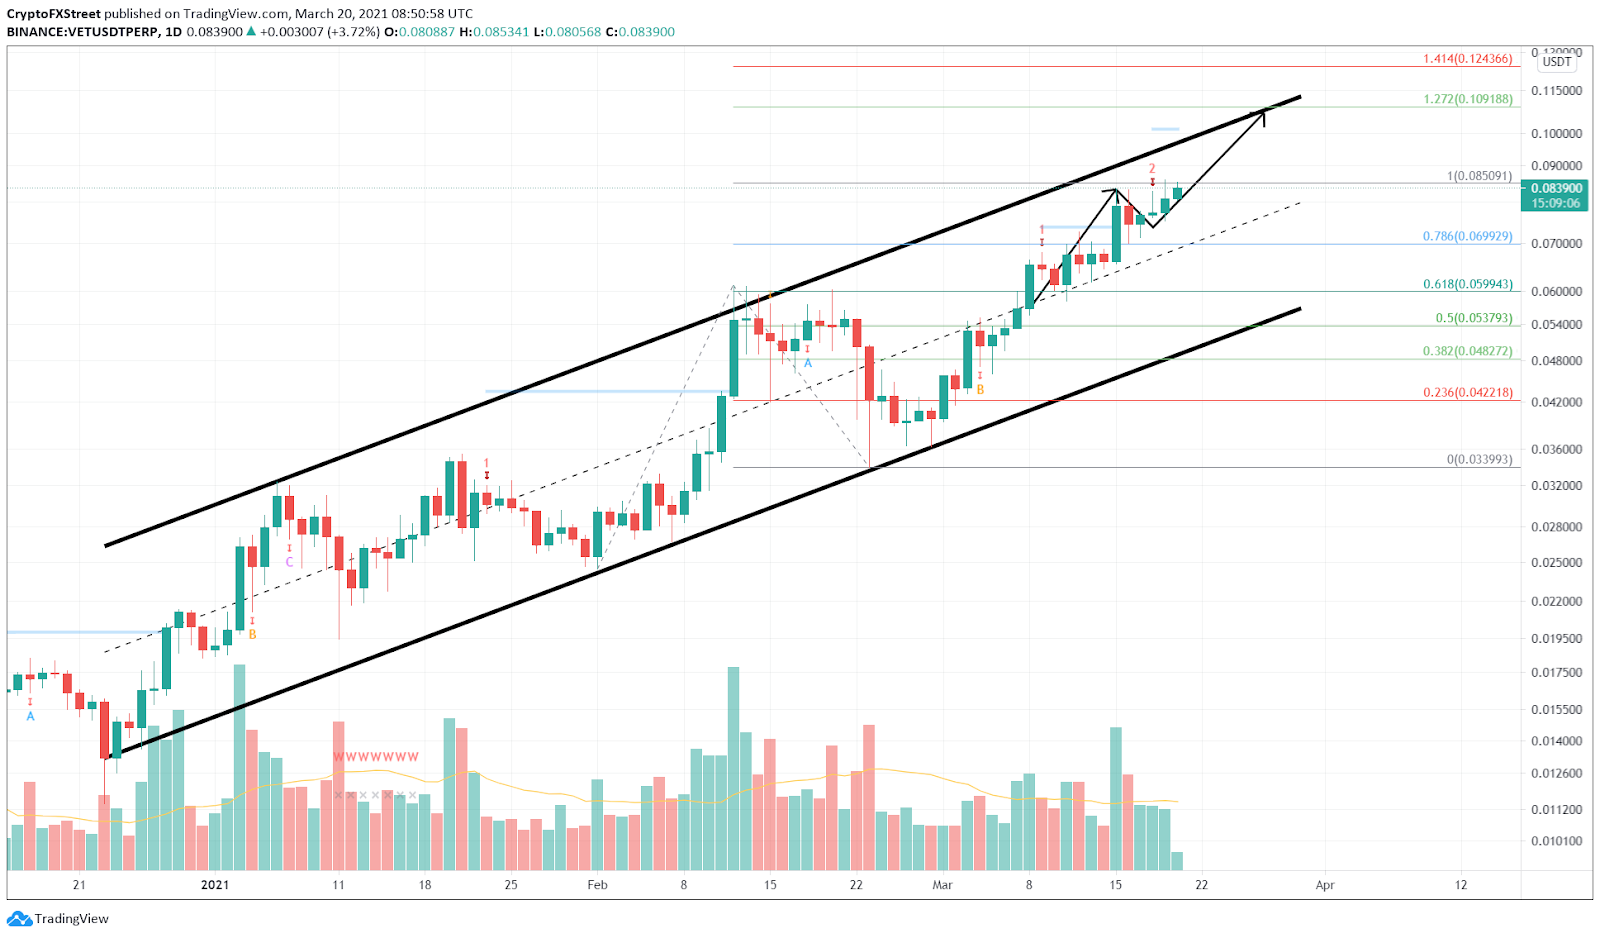
- VeChain price hints at an explosive last phase if it slices through the $0.085 barrier.
- The resulting breakout will be a 28% upswing that puts VET at $0.11.
- The Momentum Reversal Indicator’s (MRI) breakout line at $0.10 could deter this uptrend.
VeChain price shows signs of continuing its stellar momentum as it approaches the end of a 220% bull rally.
VeChain price aims higher
VeChain price has appreciated over 40% in the last week as it hovers around $0.08. Interestingly, this zone coincides with the 100% Fibonacci retracement level, and breaching it could trigger the final 28% ascent.
From late December 2020 to-date, VeChain price has been on a constant bull rally with higher highs and higher lows, creating an ascending parallel channel.
The recent tap at the lower trendline of this setup was seen on February 28. Since this bounce, VET bulls have pushed the price up by 145% to $0.080. Hence, VET's market value needs to appreciate by another 28% to hit its intended target at $0.11, coinciding with the 127.2% Fibonacci retracement level.
Nonetheless, the MRI’s breakout line at $0.10 could be a double-edged sword that could affect the rally. If bulls conquer it, VeChain has a high likelihood of continuing its ascent. Else, the altcoin could tumble.
Therefore, a spike in buying pressure, leading to a decisive daily candlestick close above this barrier, is crucial.
VET/USDT 1-day chart
However, investors need to note that the MRI indicator has flashed not one but two “cycle top” signals and suggest that the rally is overextended.
So, if VET drops below 78.6% Fibonacci retracement level at $0.069, it could invalidate the bullish outlook. In such a scenario, VeChain price could continue its descent to 61.8% Fibonacci retracement level at $0.059.
Information on these pages contains forward-looking statements that involve risks and uncertainties. Markets and instruments profiled on this page are for informational purposes only and should not in any way come across as a recommendation to buy or sell in these assets. You should do your own thorough research before making any investment decisions. FXStreet does not in any way guarantee that this information is free from mistakes, errors, or material misstatements. It also does not guarantee that this information is of a timely nature. Investing in Open Markets involves a great deal of risk, including the loss of all or a portion of your investment, as well as emotional distress. All risks, losses and costs associated with investing, including total loss of principal, are your responsibility. The views and opinions expressed in this article are those of the authors and do not necessarily reflect the official policy or position of FXStreet nor its advertisers. The author will not be held responsible for information that is found at the end of links posted on this page.
If not otherwise explicitly mentioned in the body of the article, at the time of writing, the author has no position in any stock mentioned in this article and no business relationship with any company mentioned. The author has not received compensation for writing this article, other than from FXStreet.
FXStreet and the author do not provide personalized recommendations. The author makes no representations as to the accuracy, completeness, or suitability of this information. FXStreet and the author will not be liable for any errors, omissions or any losses, injuries or damages arising from this information and its display or use. Errors and omissions excepted.
The author and FXStreet are not registered investment advisors and nothing in this article is intended to be investment advice.
Recommended Content
Editors’ Picks

Bitcoin Weekly Forecast: BTC nosedives below $95,000 as spot ETFs record highest daily outflow since launch
Bitcoin price continues to edge down, trading below $95,000 on Friday after declining more than 9% this week. Bitcoin US spot ETFs recorded the highest single-day outflow on Thursday since their launch in January.

Bitcoin crashes to $96,000, altcoins bleed: Top trades for sidelined buyers
Bitcoin (BTC) slipped under the $100,000 milestone and touched the $96,000 level briefly on Friday, a sharp decline that has also hit hard prices of other altcoins and particularly meme coins.

Solana Price Forecast: SOL’s technical outlook and on-chain metrics hint at a double-digit correction
Solana (SOL) price trades in red below $194 on Friday after declining more than 13% this week. The recent downturn has led to $38 million in total liquidations, with over $33 million coming from long positions.

SEC approves Hashdex and Franklin Templeton's combined Bitcoin and Ethereum crypto index ETFs
The SEC approved Hashdex's proposal for a crypto index ETF. The ETF currently features Bitcoin and Ethereum, with possible additions in the future. The agency also approved Franklin Templeton's amendment to its Cboe BZX for a crypto index ETF.

Bitcoin: 2025 outlook brightens on expectations of US pro-crypto policy
Bitcoin price has surged more than 140% in 2024, reaching the $100K milestone in early December. The rally was driven by the launch of Bitcoin Spot ETFs in January and the reduced supply following the fourth halving event in April.

Best Forex Brokers with Low Spreads
VERIFIED Low spreads are crucial for reducing trading costs. Explore top Forex brokers offering competitive spreads and high leverage. Compare options for EUR/USD, GBP/USD, USD/JPY, and Gold.