- VeChain price is consolidating a multi-year ascending parallel channel, awaiting a breakout.
- A close above the channel’s upper trendline at $0.085 projects at a 250% bull rally towards $0.030.
- However, a failure to close above this critical supply barrier projects a 55% downswing towards the channel’s lower trendline.
VeChain price shows a 365% surge since testing the ascending parallel channel lower trendline on December 23, 2020. At the time of writing, VET has broken out of the channel’s middle line, hinting at a retest of the upper trendline soon.
VeChain price primed to retest a critical level at $0.085
VeChain price broke out from a month-long consolidation near the channel’s middle line on February 9. This breakout resulted in a nearly 100% upswing to $0.050, where VET is currently trading.
VET price fell prey to the overall market crash and has dropped nearly 5%, which is relatively better than other altcoins. Indeed, a spike in buying pressure here suggests that the altcoin could retest the channel’s upper trendline around the $0.085 price level.
However, only a 3-day candlestick close above the said level seals VeChain’s bullish outlook and projects a 250% bull rally towards $0.300.
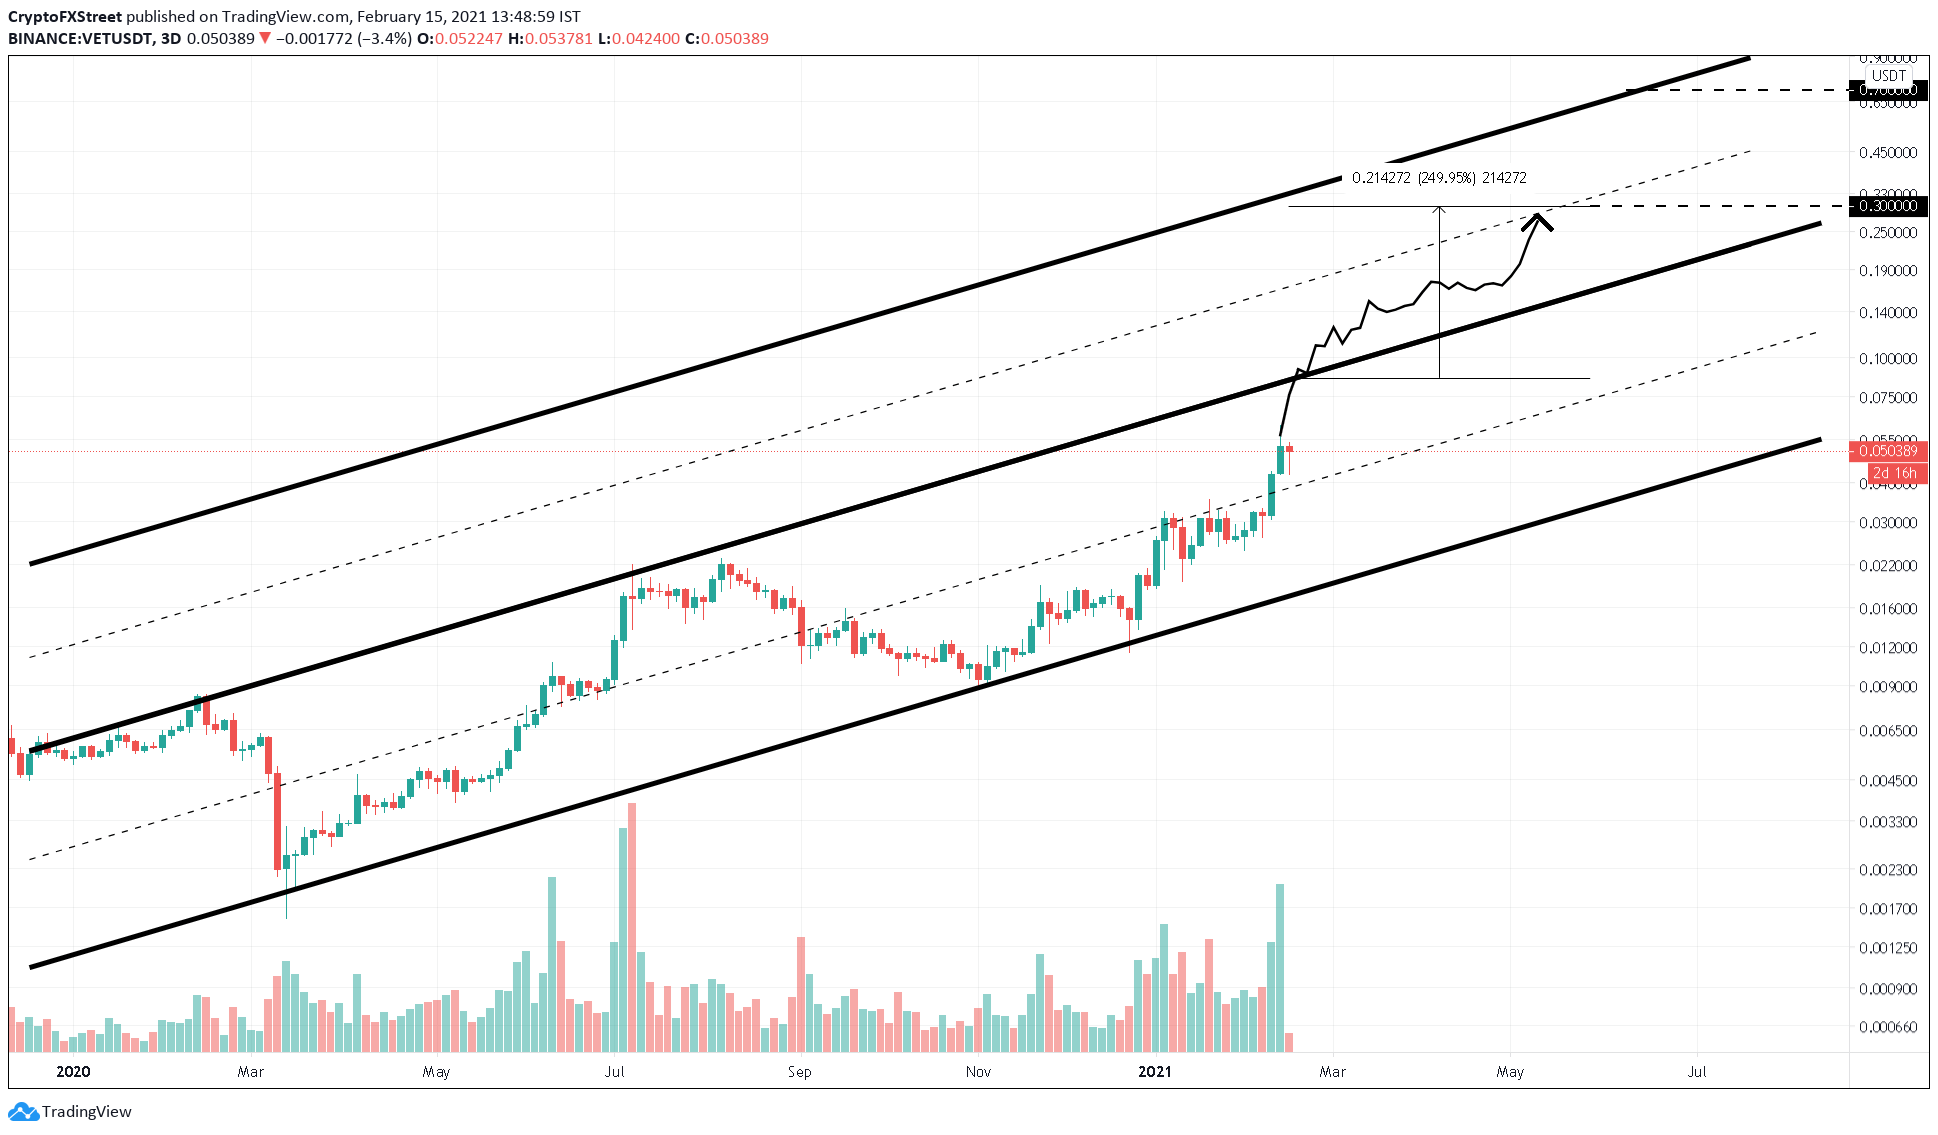
VET/USDT 3-day chart
Adding credence to this bullish outlook is the lack of VeChain’s social volume. Typically, a spike in social volume suggests FOMO among users, which only happens after the price has already surged massively. Hence, a spike in social volume can be used to predict rally tops or reversals.
Therefore, VET’s lack of social volume suggests a bullish outlook from a counter sentiment perspective.
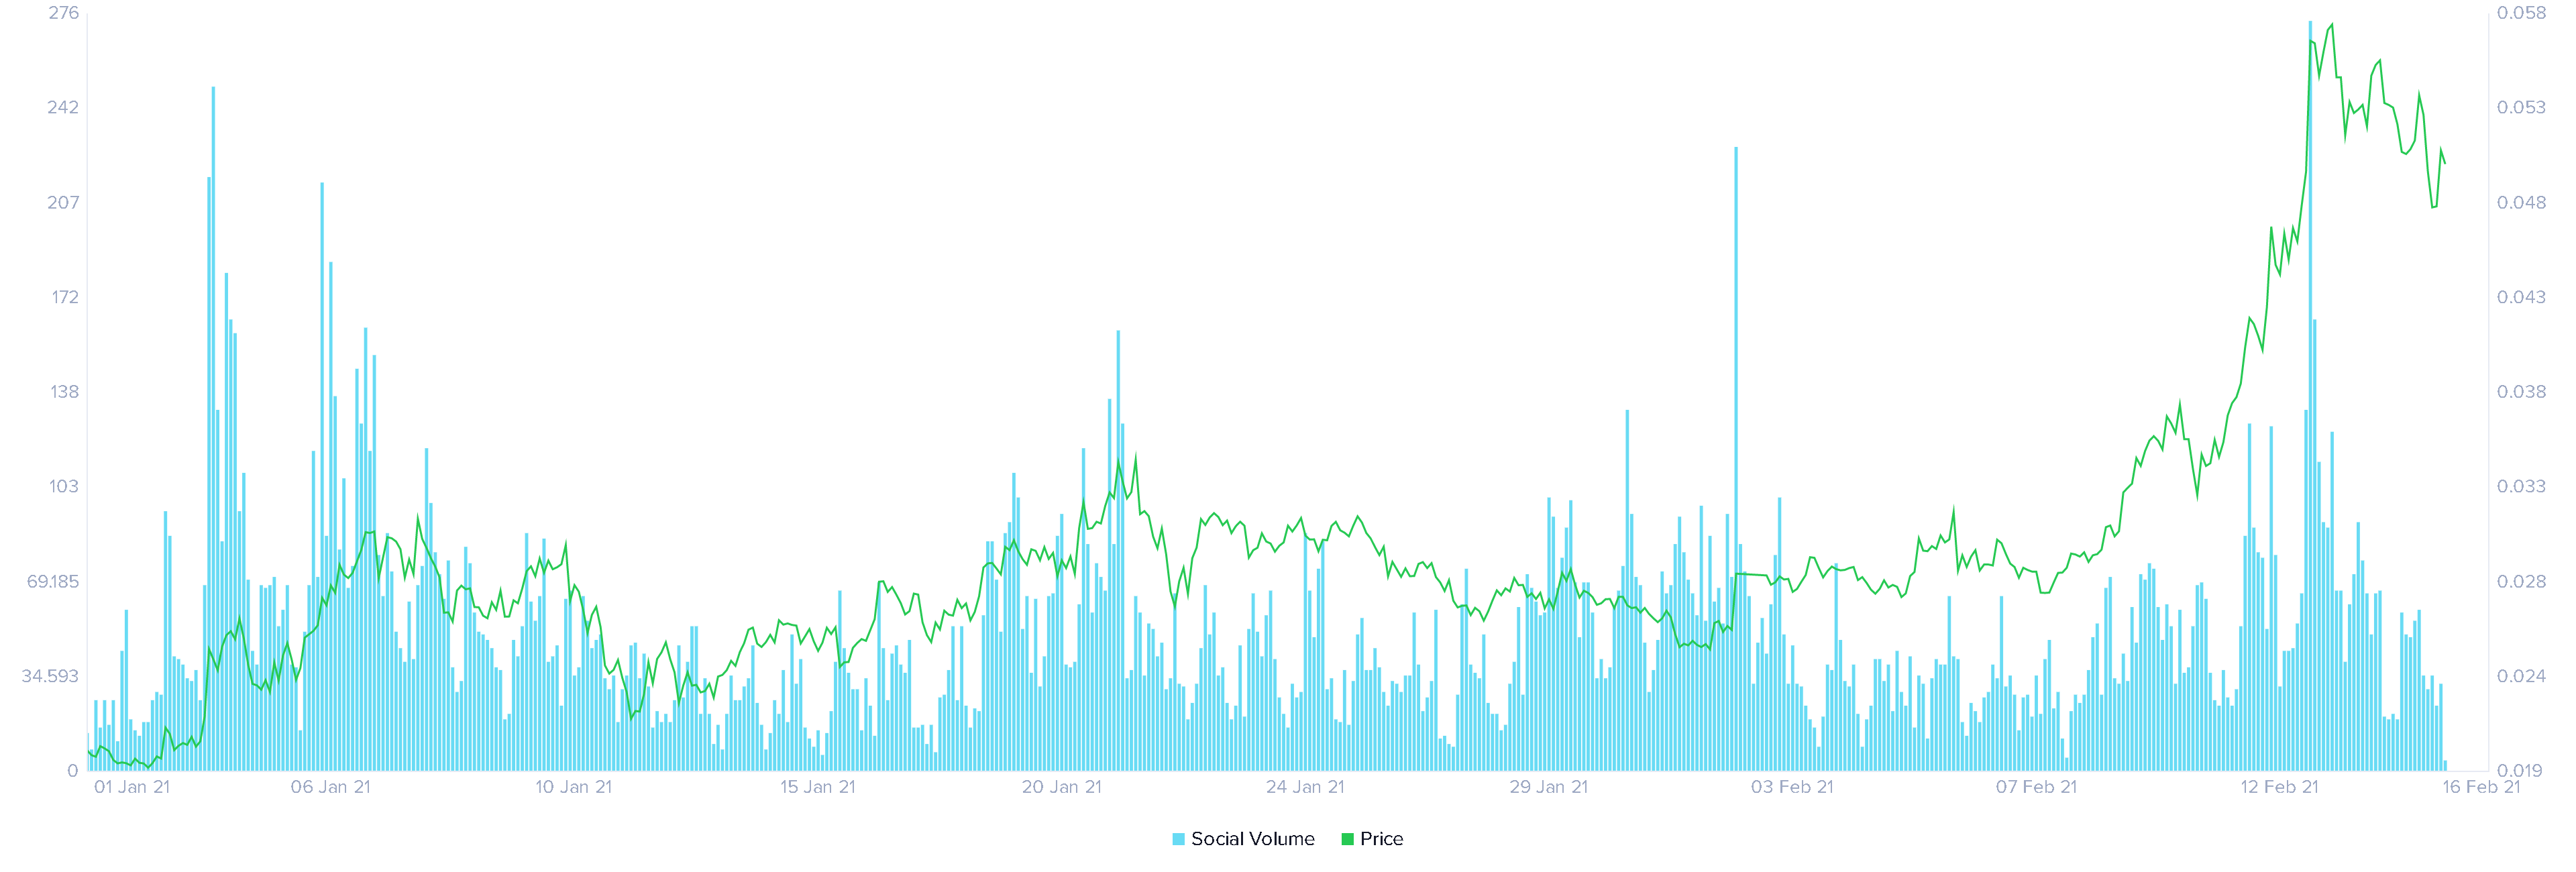
VeChain Social Volume chart
However, a rejection at the channel’s upper trendline could prove fatal to VET. In such a case, VeChain price might continue its descent towards the immediate support, which is the middle line of the ascending parallel channel at $0.037.
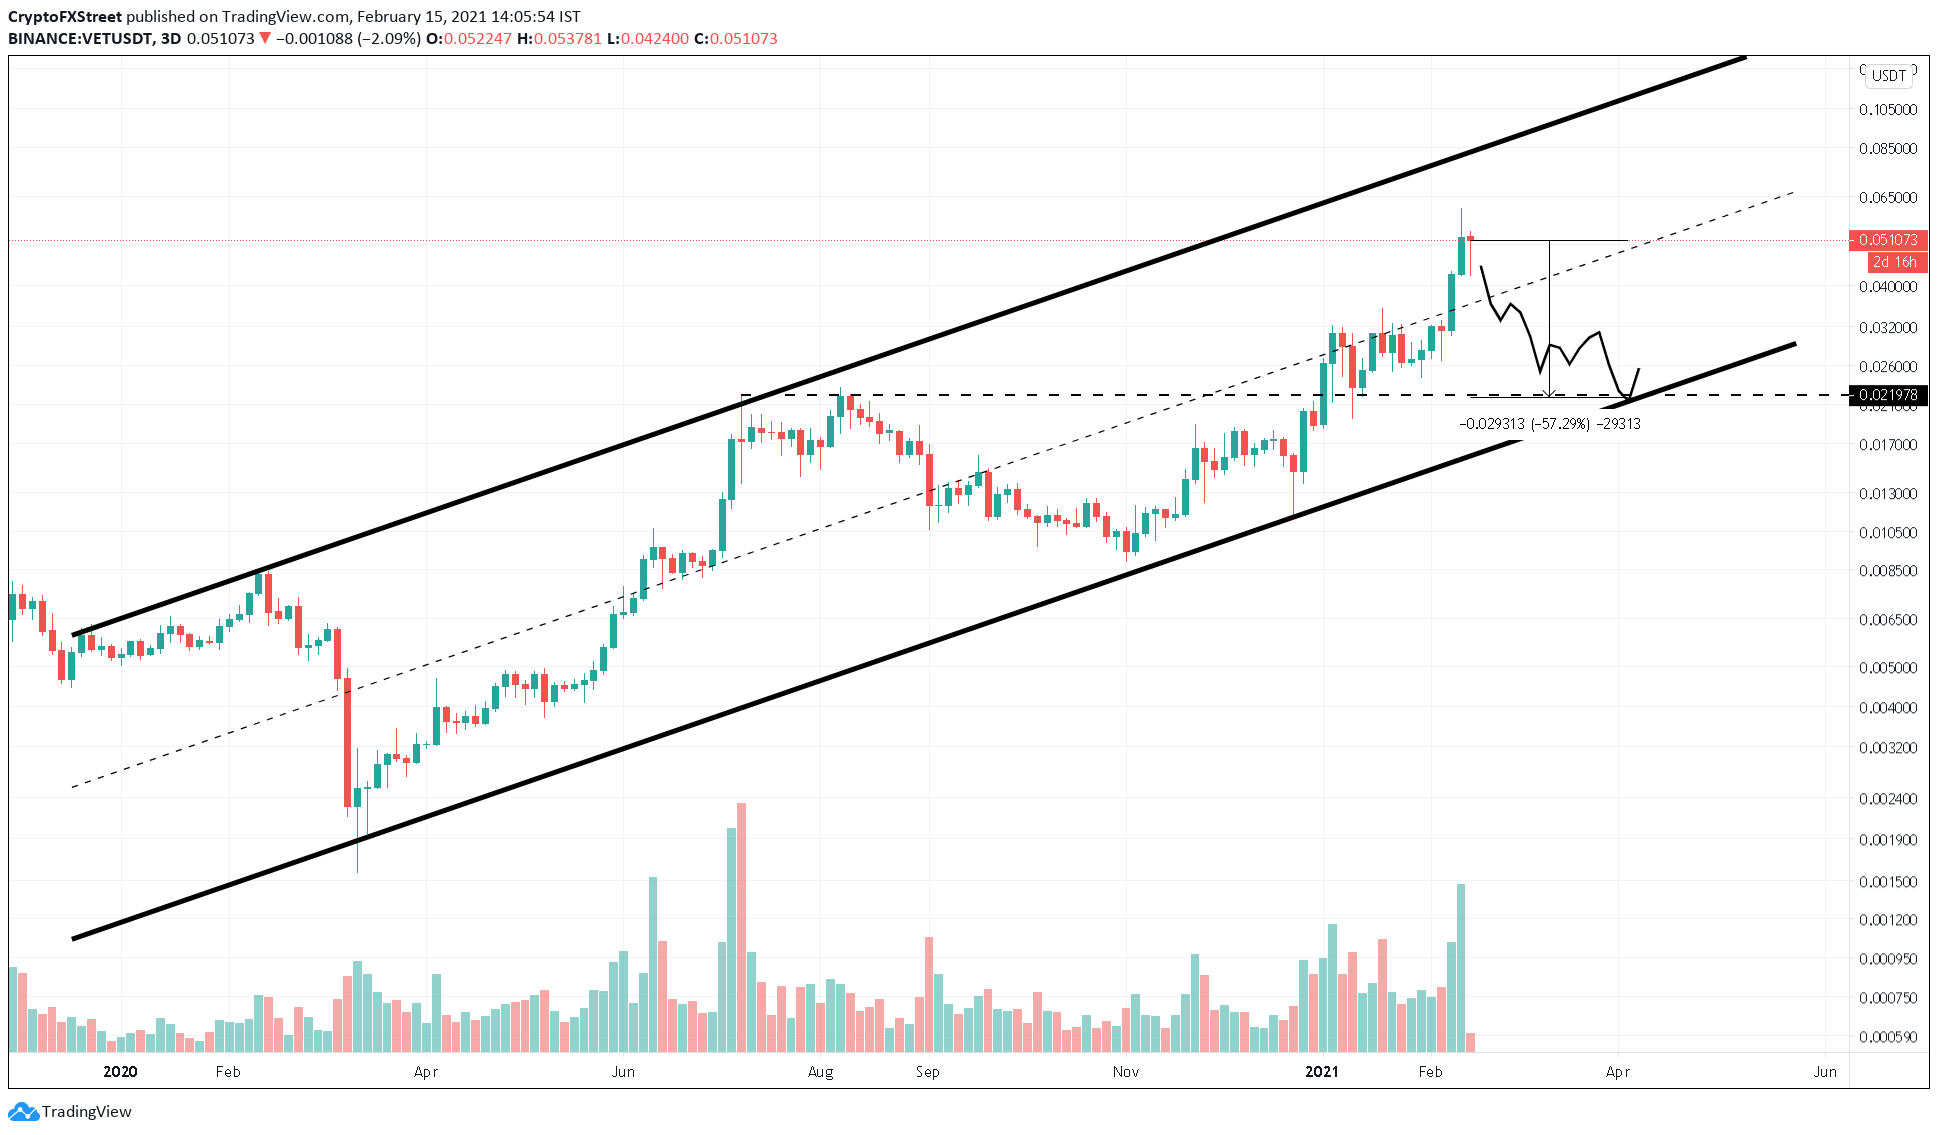
VET/USDT 3-day chart
Supporting this bearish scenario is Santiment's developer activity index. A spike in this metric may be interpreted as a bullish sign by investors who assume it as a precursor to new updates or developmental rollouts.
However, VeChain’s developer activity index crashed by 94% to 0.12 starting from February 9. Considering that the VET price surged 61% between this period, investors may assume that the drop in developer activity may not be priced in yet.
Hence, it is likely that token holders might sell their tokens, pushing VET lower.
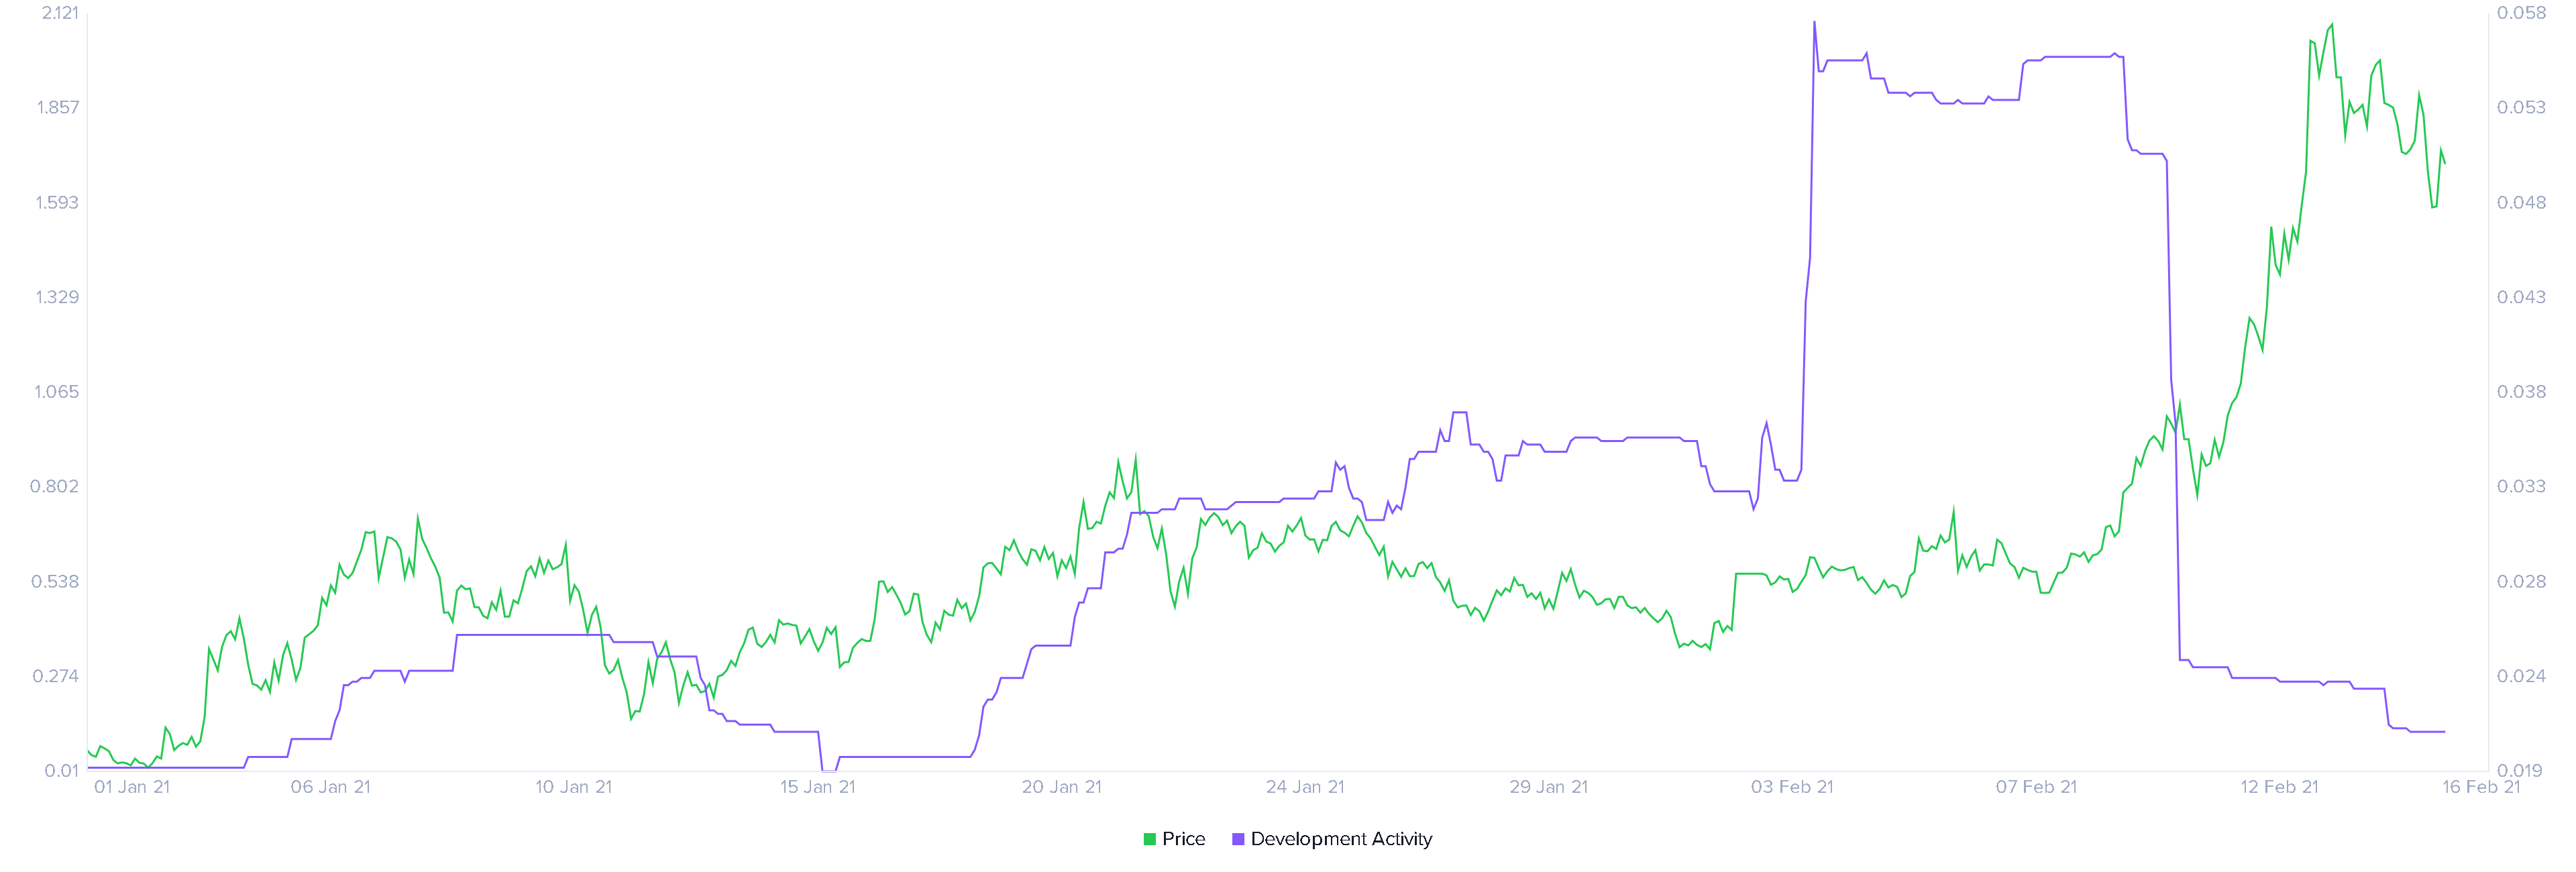
VeChain Developer Activity chart
Therefore, a rejection of the immediate support at the channel’s middle-line could lead to a steep correction to $0.022.
Information on these pages contains forward-looking statements that involve risks and uncertainties. Markets and instruments profiled on this page are for informational purposes only and should not in any way come across as a recommendation to buy or sell in these assets. You should do your own thorough research before making any investment decisions. FXStreet does not in any way guarantee that this information is free from mistakes, errors, or material misstatements. It also does not guarantee that this information is of a timely nature. Investing in Open Markets involves a great deal of risk, including the loss of all or a portion of your investment, as well as emotional distress. All risks, losses and costs associated with investing, including total loss of principal, are your responsibility. The views and opinions expressed in this article are those of the authors and do not necessarily reflect the official policy or position of FXStreet nor its advertisers. The author will not be held responsible for information that is found at the end of links posted on this page.
If not otherwise explicitly mentioned in the body of the article, at the time of writing, the author has no position in any stock mentioned in this article and no business relationship with any company mentioned. The author has not received compensation for writing this article, other than from FXStreet.
FXStreet and the author do not provide personalized recommendations. The author makes no representations as to the accuracy, completeness, or suitability of this information. FXStreet and the author will not be liable for any errors, omissions or any losses, injuries or damages arising from this information and its display or use. Errors and omissions excepted.
The author and FXStreet are not registered investment advisors and nothing in this article is intended to be investment advice.
Recommended Content
Editors’ Picks

Bitcoin Weekly Forecast: BTC nosedives below $95,000 as spot ETFs record highest daily outflow since launch
Bitcoin price continues to edge down, trading below $95,000 on Friday after declining more than 9% this week. Bitcoin US spot ETFs recorded the highest single-day outflow on Thursday since their launch in January.

Bitcoin crashes to $96,000, altcoins bleed: Top trades for sidelined buyers
Bitcoin (BTC) slipped under the $100,000 milestone and touched the $96,000 level briefly on Friday, a sharp decline that has also hit hard prices of other altcoins and particularly meme coins.

Solana Price Forecast: SOL’s technical outlook and on-chain metrics hint at a double-digit correction
Solana (SOL) price trades in red below $194 on Friday after declining more than 13% this week. The recent downturn has led to $38 million in total liquidations, with over $33 million coming from long positions.

SEC approves Hashdex and Franklin Templeton's combined Bitcoin and Ethereum crypto index ETFs
The SEC approved Hashdex's proposal for a crypto index ETF. The ETF currently features Bitcoin and Ethereum, with possible additions in the future. The agency also approved Franklin Templeton's amendment to its Cboe BZX for a crypto index ETF.

Bitcoin: 2025 outlook brightens on expectations of US pro-crypto policy
Bitcoin (BTC) price has surged more than 140% in 2024, reaching the $100K milestone in early December. The rally was driven by the launch of Bitcoin Spot Exchange Traded Funds (ETFs) in January and the reduced supply following the fourth halving event in April.

Best Forex Brokers with Low Spreads
VERIFIED Low spreads are crucial for reducing trading costs. Explore top Forex brokers offering competitive spreads and high leverage. Compare options for EUR/USD, GBP/USD, USD/JPY, and Gold.