VeChain Price Prediction: VET eyes 25% upswing
- VeChain price is stabilizing as bulls contemplate an uptrend.
- A potential spike in buying pressure might propel VET by 25% to the resistance level at $0.102.
- The MRI indicator suggests that a downswing is likely before a full-blown uptrend.

VeChain price is consolidating near the range low, hinting at a minor pullback prior to a move higher. The MRI indicator adds credence to the short-term correction for VET.
VeChain price to create equal lows before heading higher
VeChain price slid below the 50% Fibonacci retracement level at $0.106 on June 18 and has stayed under it since then. The recent VET price action suggests that a breakout from the tight consolidation range is possible.
The Momentum Reversal Indicator (MRI) has flashed a sell signal in the form of a red ‘one’ candlestick on the 4-hour chart, which forecasts a one-to-four candlestick correction.
Therefore, investors can expect VeChain price to create the third equal low at the $0.071 support level. In some cases, VET could sweep below these lows to collect liquidity.
Such a development is a bullish sign and is typically followed by a quick bounce.
If this were to occur, Vechain price would tag the June 23 swing high at $0.084, followed by the resistance level at $0.092.
If the buying pressure continues to pour in, VET will retest $0.102 and the 50% Fibonacci retracement level at $0.106.
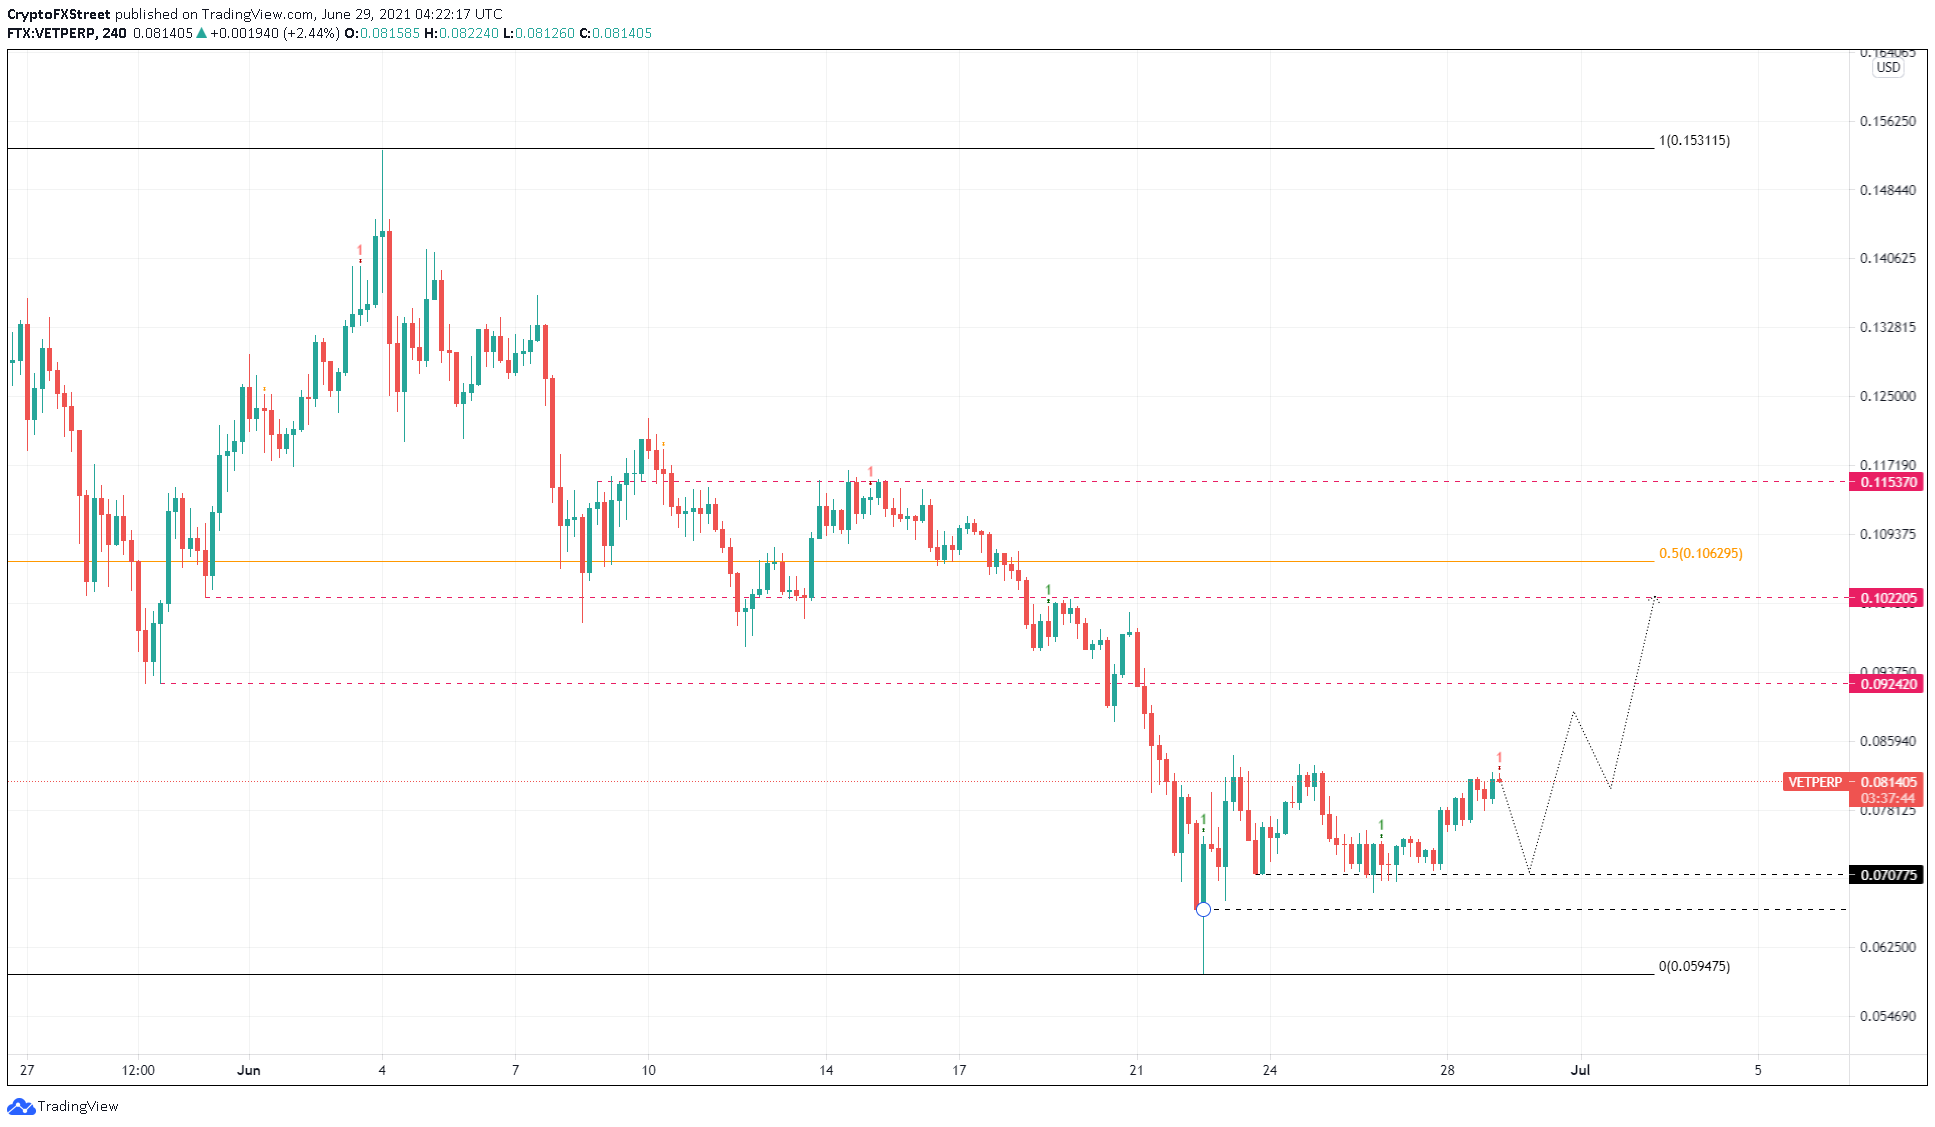
VET/USDT 4-hour chart
On the other hand, if VeChain price fails to climb above $0.071 after sweeping the lows, it will signal weak bulls or insufficient buying pressure.
A breakdown of the support barrier at $0.067 will create a lower low and invalidate the bullish thesis. In such a case, the sellers might trigger an 11% downswing that pushes VET to the range low at $0.059.
Author

Akash Girimath
FXStreet
Akash Girimath is a Mechanical Engineer interested in the chaos of the financial markets. Trying to make sense of this convoluted yet fascinating space, he switched his engineering job to become a crypto reporter and analyst.