• VeChain price is correcting after its 25% rally and is now above a key support level.
  • Breakdown of the $0.0166 foothold could trigger a 10% correction to $0.0147.
  • A daily candlestick close above $0.0178 will invalidate the bearish thesis.

VeChain price is slowly undoing the gains witnessed in the second and third weeks of September. If this trend continues, VET could stand to trigger a steep correction in the near future.

Also read: VeChain Price Forecast: Comeback from VET bulls could trigger 13% rally

VeChain price at crossroads 

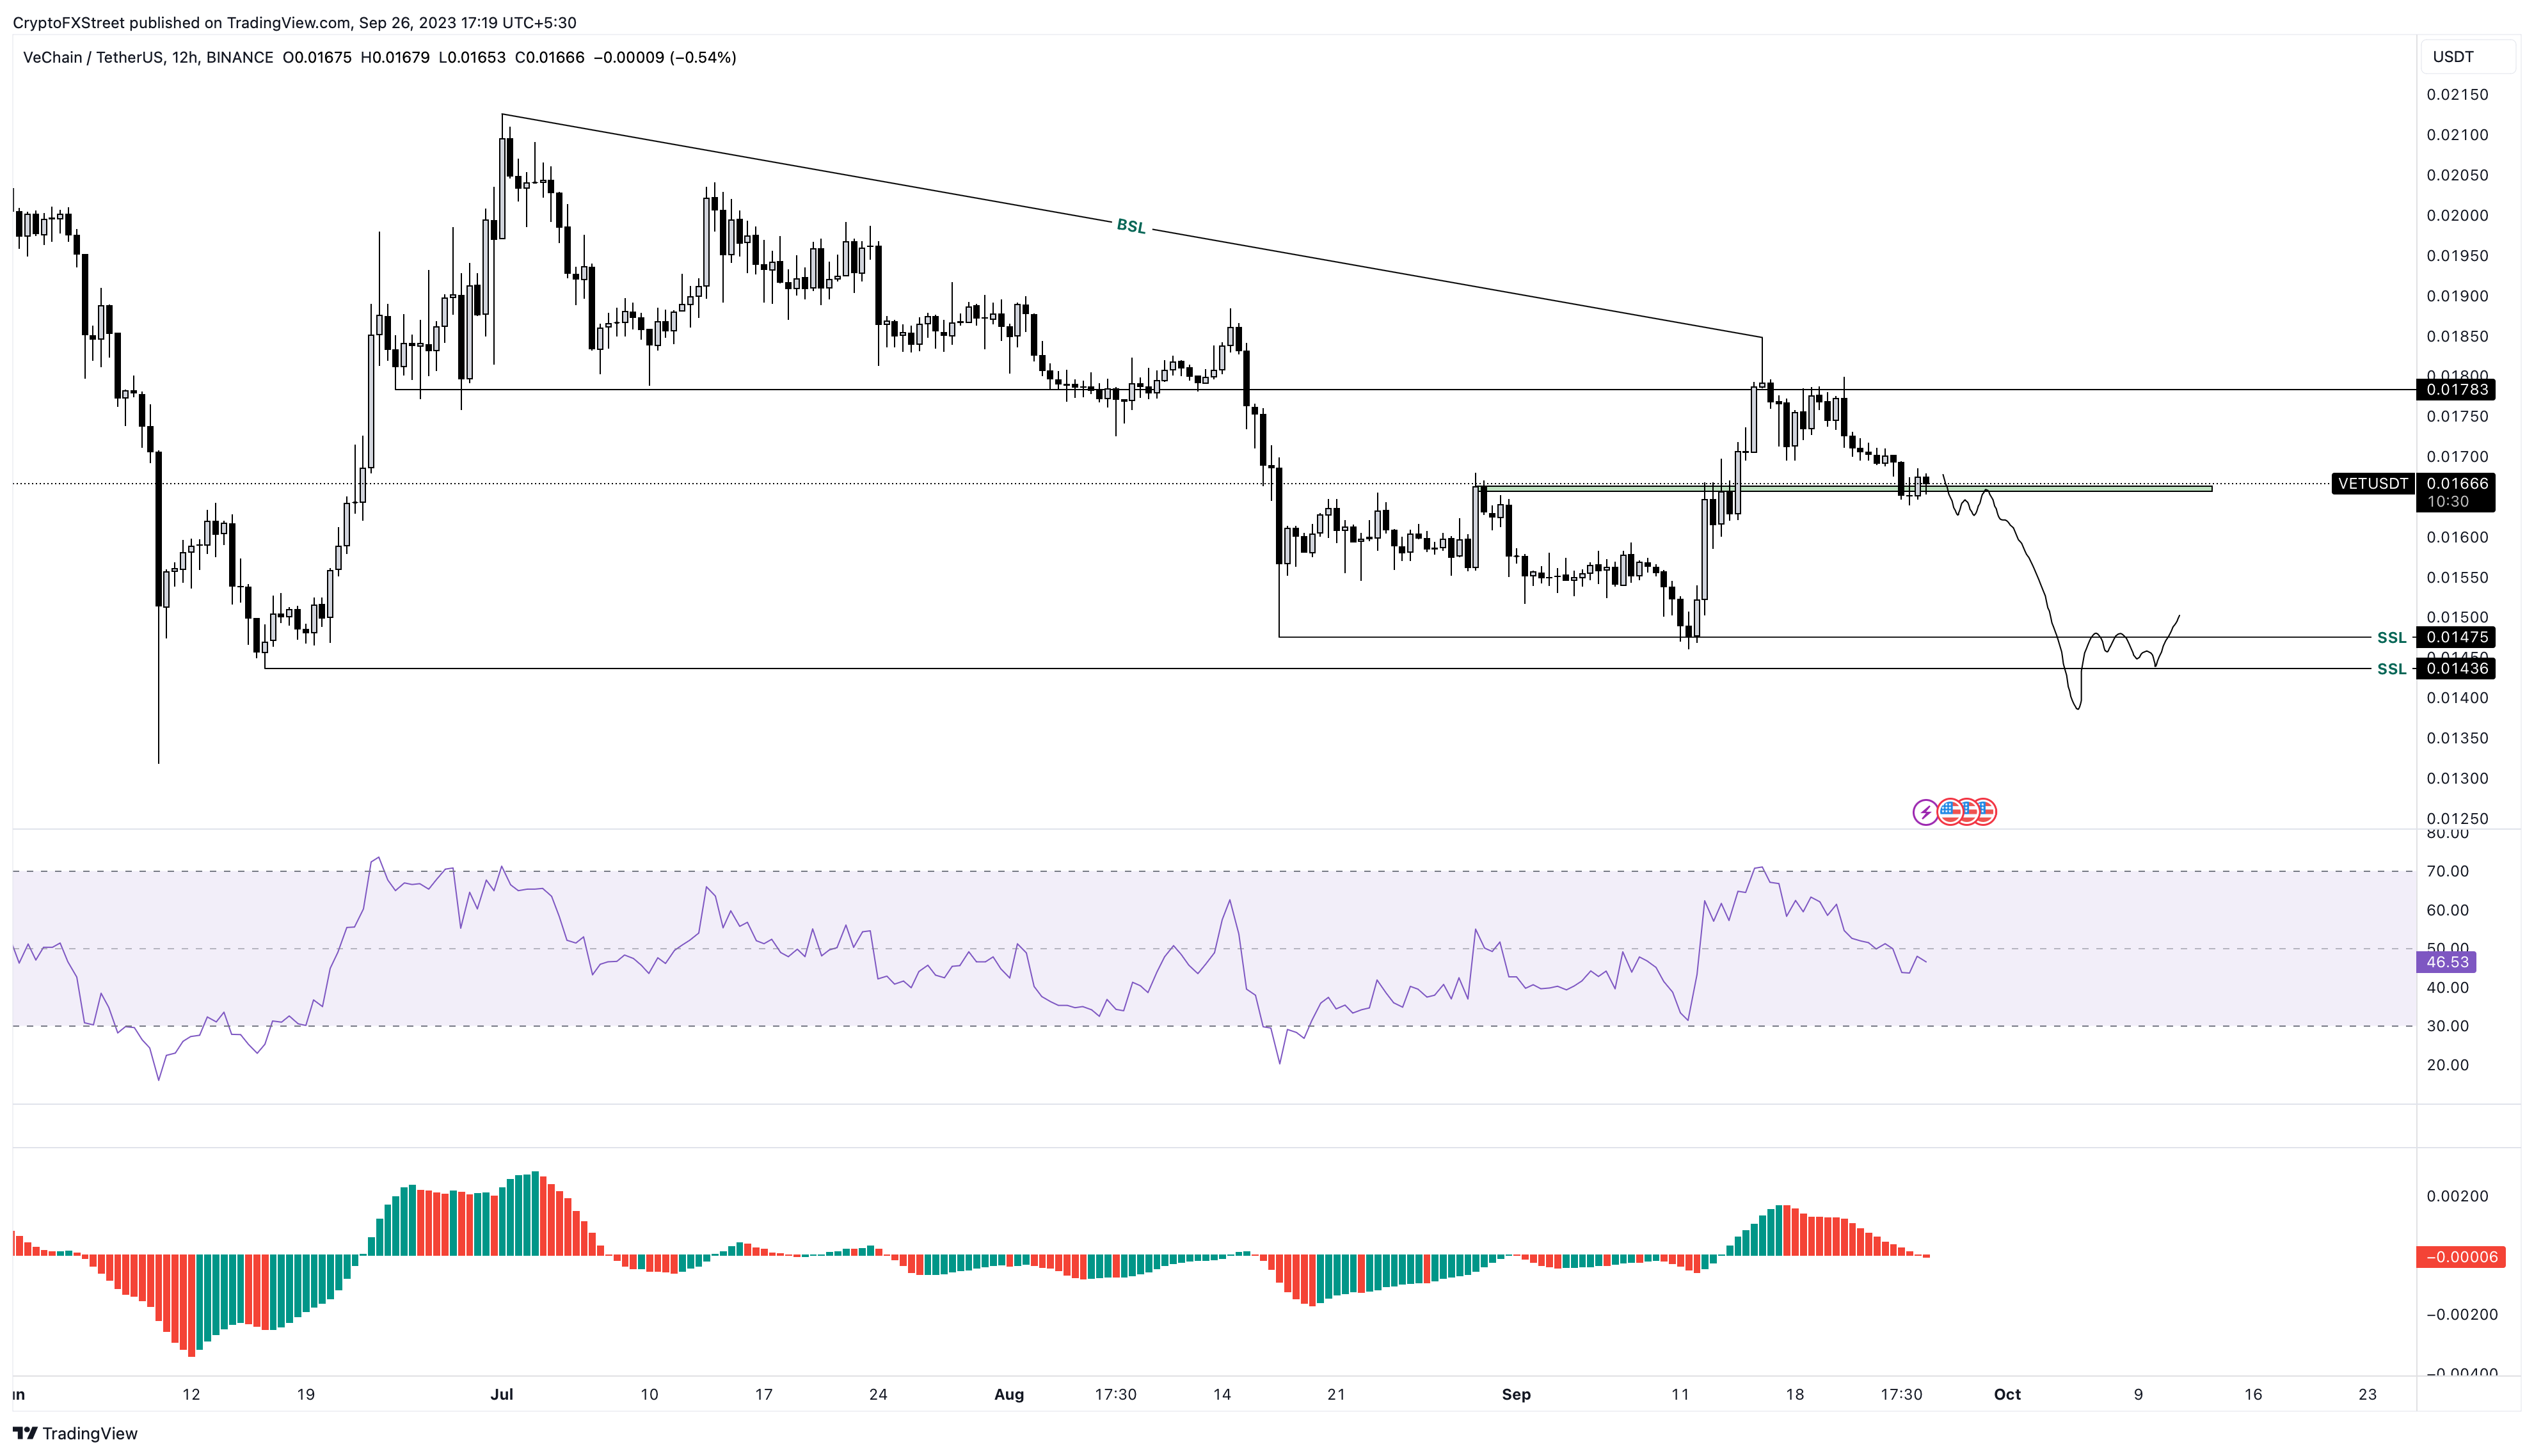
VeChain price rallied 25% between September 11 and September 16 and created a local top at $0.0184. However, the lack of buying pressure coupled with the bearish market conditions allowed VET to start a countertrend rally. The altcoin has now shed nearly 10% and currently sits atop the $0.0166 support level, which is key in determining where the cryptocurrency will head next.

A decisive daily candlestick close below this level would be a telltale sign of waning buying pressure and a takeover from sellers. In such a case, the VeChain price could trigger another 10% correction and tag the next key levels at $0.0147 and $0.0143. 

The Relative Strength Index (RSI) and the Awesome Oscillator (AO) have both lost their respective mean levels, which further adds credence to the bearish outlook.

VET/USDT 1-day chart

VET/USDT 1-day chart

The bearish outlook for the VeChain price is logical and is contingent on the breakdown of the key support level at $0.0166. On the other hand, a bounce from the aforementioned level that produces a daily candlestick close above $0.0178 will invalidate the bearish thesis. 

In such a case, the VeChain price could target the buy-side liquidity resting above the lower highs produced between July 1 and September 16. The nearest targets for VET bulls would be the sweep of the September 16 high at $0.0184 and the August 14 swing high at $0.0188.

Read more: Bitcoin Cash Price Forecast: BCH traders can bank on short-term bounce to $228


Information on these pages contains forward-looking statements that involve risks and uncertainties. Markets and instruments profiled on this page are for informational purposes only and should not in any way come across as a recommendation to buy or sell in these assets. You should do your own thorough research before making any investment decisions. FXStreet does not in any way guarantee that this information is free from mistakes, errors, or material misstatements. It also does not guarantee that this information is of a timely nature. Investing in Open Markets involves a great deal of risk, including the loss of all or a portion of your investment, as well as emotional distress. All risks, losses and costs associated with investing, including total loss of principal, are your responsibility. The views and opinions expressed in this article are those of the authors and do not necessarily reflect the official policy or position of FXStreet nor its advertisers. The author will not be held responsible for information that is found at the end of links posted on this page.

If not otherwise explicitly mentioned in the body of the article, at the time of writing, the author has no position in any stock mentioned in this article and no business relationship with any company mentioned. The author has not received compensation for writing this article, other than from FXStreet.

FXStreet and the author do not provide personalized recommendations. The author makes no representations as to the accuracy, completeness, or suitability of this information. FXStreet and the author will not be liable for any errors, omissions or any losses, injuries or damages arising from this information and its display or use. Errors and omissions excepted.

The author and FXStreet are not registered investment advisors and nothing in this article is intended to be investment advice.

Recommended content


Recommended Content

Editors’ Picks

Shiba Inu has potential for rally but faces key technical hurdles

Shiba Inu has potential for rally but faces key technical hurdles

Shiba Inu is down 0.1% on Wednesday following loss of a key accumulation zone. Meanwhile, its on-chain and technical indicators suggest potential for a brief rally. According to data from IntoTheBlock, nearly 73% of SHIB tokens are held at a loss.

More Shiba News

Trump tokens dip following interview with Elon Musk, Kamala Harris gains support on Polymarket

Trump tokens dip following interview with Elon Musk, Kamala Harris gains support on Polymarket

Meme tokens based on former President Donald Trump experienced sell-offs on Tuesday following no mention of crypto during his interview with Tesla CEO Elon Musk on Monday.

More Cryptocurrencies News

Ethereum risks 25% decline if it fails to overcome key trendline as investor accumulation continues

Ethereum risks 25% decline if it fails to overcome key trendline as investor accumulation continues

Ethereum is up more than 2% on Tuesday following minor inflows across ETH ETFs. ETH technical indicators suggest that its price could approach the $2,000 psychological level in the coming weeks, but investors' accumulation may prevail.

More Ethereum News

Bitcoin shows signs of recovery as Bitgo begins final Mt. Gox distribution

Bitcoin shows signs of recovery as Bitgo begins final Mt. Gox distribution

Bitcoin (BTC) is up over 3% on Tuesday as investors reacted positively to the final lap of Mt. Gox supply pressure. Meanwhile, Glassnode data reveals investors have resumed accumulation, hoping to see Bitcoin record higher prices.

More Bitcoin News

Bitcoin: Can BTC bounce back from recent market crash?

Bitcoin: Can BTC bounce back from recent market crash?

Bitcoin (BTC) trades above $60,000 on Friday after a 7.2% decline and a dip below the $50,000 level earlier in the week, following a test of its daily support level at around $49,900 on Monday.

Read full analysis

BTC

ETH

XRP