- VeChain price is preparing for a 22% rally as the token continues to trend higher.
- As long as the critical line of defense at $0.133 holds, the bullish target is still on the radar.
- VET may be confronted by two major levels of resistance prior to tagging the optimistic target.
VeChain price appears ready for an ascent as the altcoin continues to hold above key levels of support. The governing technical pattern presented by VET suggests that the token is ready for a bounce of 22%.
VeChain price steadies ahead of ascent toward $0.164
VeChain price is gearing up for a considerable climb within the prevailing ascending parallel channel on the 4-hour chart. VET has found a reliable foothold above critical levels of support and is now ready for a 22% bounce toward $0.164.
Investors should also note that VeChain price recently sliced above the multi-month descending trend line on October 21, suggesting a bullish outlook for VET.
The next obstacle for VeChain price is at the middle boundary of the governing technical pattern at $0.140, coinciding with the October 29 high.
The Arms Index (TRIN), which gauges overall market sentiment, indicates a reading in favor of the bulls, suggesting that there are more buyers than sellers in the market.
An additional hurdle may emerge for VET price at the resistance line given by the Momentum Reversal Indicator (MRI) at $0.147, corresponding to the October 26 high before reaching the aforementioned bullish target.
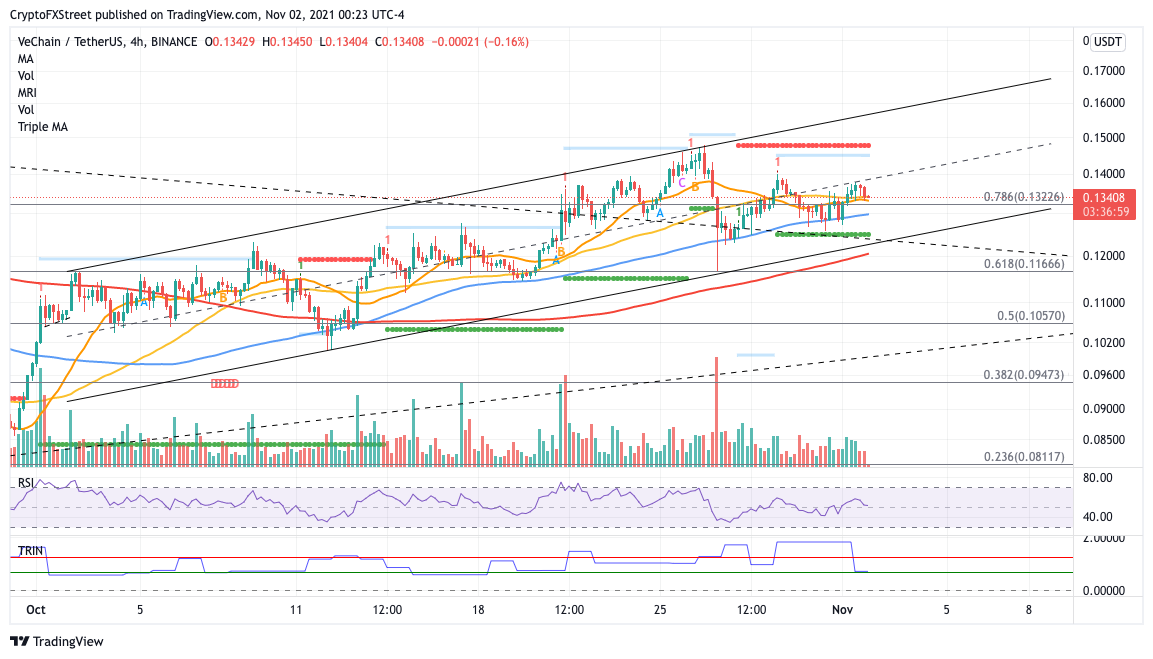
VET/USDT 4-hour chart
VeChain price is currently supported by the 21 and 50 four-hour Simple Moving Averages (SMAs) at $0.133. If VET continues to tread above this level, it could give the buyers more confidence in reaching the aforementioned optimistic target at $0.164.
However, if a spike in sell orders emerges, VeChain price would discover its next line of defense at the 78.6% Fibonacci retracement level at $0.132, then at the 100 four-hour SMA at $0.129. Additional selling pressure may push VET down toward the support line given by the MRI at $0.124, near the lower boundary of the parallel channel and the multi-month trend line.
If VeChain price slices below the downside trend line of the prevailing chart pattern, the bullish outlook may be voided.
Note: All information on this page is subject to change. The use of this website constitutes acceptance of our user agreement. Please read our privacy policy and legal disclaimer. Opinions expressed at FXstreet.com are those of the individual authors and do not necessarily represent the opinion of FXstreet.com or its management. Risk Disclosure: Trading foreign exchange on margin carries a high level of risk, and may not be suitable for all investors. The high degree of leverage can work against you as well as for you. Before deciding to invest in foreign exchange you should carefully consider your investment objectives, level of experience, and risk appetite. The possibility exists that you could sustain a loss of some or all of your initial investment and therefore you should not invest money that you cannot afford to lose. You should be aware of all the risks associated with foreign exchange trading, and seek advice from an independent financial advisor if you have any doubts.
Recommended Content
Editors’ Picks
Ripple on-chain metrics show bullish signs amidst legal struggle with SEC, XRP eyes recovery
![Ripple on-chain metrics show bullish signs amidst legal struggle with SEC, XRP eyes recovery](https://editorial.fxstreet.com/images/Markets/Currencies/Cryptocurrencies/Coins/Ripple/Ripple_Coin_31_02_XtraSmall.jpg)
Ripple made a comeback above $0.48 on Tuesday and hovers above that level in Wednesday’s European session. Ripple on-chain metrics such as transaction volume and Network Realized Profit/Loss have turned bullish, supporting a recovery in the altcoin.
Bitcoin price falls amidst German government transfers, miners activity
![Bitcoin price falls amidst German government transfers, miners activity](https://editorial.fxstreet.com/images/Markets/Currencies/Digital%20Currencies/Bitcoin/bit-coin-symbol-flag-3d-illustration-59931110_XtraSmall.jpg)
Bitcoin (BTC) extends correction on Wednesday and hovers around $61,000 after finding resistance near the $64,000 level on Monday. Recent on-chain data indicates heightened selling activity from Bitcoin miners early in the week.
Crypto Today: Bitcoin erases gains from end of June, Ethereum declines while Ripple holds
![Crypto Today: Bitcoin erases gains from end of June, Ethereum declines while Ripple holds](https://editorial.fxstreet.com/images/Markets/Currencies/Digital%20Currencies/Bitcoin/Bitcoin_2_XtraSmall.jpg)
Bitcoin wipes out gains from the last week of June and falls below $60,000 on Wednesday. Ethereum and top altcoins ranked by market capitalization erased gains as the inflation outlook worsened. Ripple holds on to recent gains and hovers above $0.48 on Wednesday.
Three reasons why altcoins could shake off losses this week
![Three reasons why altcoins could shake off losses this week](https://editorial.fxstreet.com/images/Markets/Currencies/Cryptocurrencies/cryptos_XtraSmall.jpg)
On-chain data from Santiment shows that altcoins are currently in the opportunity zone, or generating buy signals. The top three altcoins in the buy zone are Basic Attention Token (BAT), Chromia (CHR), and Highstreet (HIGH), per Santiment.
Bitcoin: BTC price correction could end in July, according to seasonal data
![Bitcoin: BTC price correction could end in July, according to seasonal data](https://editorial.fxstreet.com/images/Markets/Currencies/Digital%20Currencies/Bitcoin/bitcoin_5_XtraSmall.jpg)
Bitcoin (BTC) price appears poised for a decline this week, influenced by slight outflows in US spot ETFs, selling activity among BTC miners, and a combined transfer of 4,690.28 BTC to centralized exchanges by the US and German governments.