VeChain Price Forecast: VET targets $0.032 after slicing through critical resistance
- Vechain price seems to have formed a W pattern on the 4-hour chart.
- The digital asset could quickly jump towards $0.032 if the pattern is confirmed.
- VET faces very weak resistance on the way up above $0.03.

Vechain price is currently trading at $0.029 and it’s under a consolidation period after hitting a high of $0.035 on January 21. The digital asset is up by 156% since December 23, 2020 with a market capitalization of $1.9 billion.
Vechain price aims for $0.032 but could jump even higher
On the 4-hour chart, Vechain seems to have formed a W pattern with the first low located at $0.0259 and the second at $0.0264. The digital asset has seen a significant rebound and established an uptrend on the 4-hour chart.
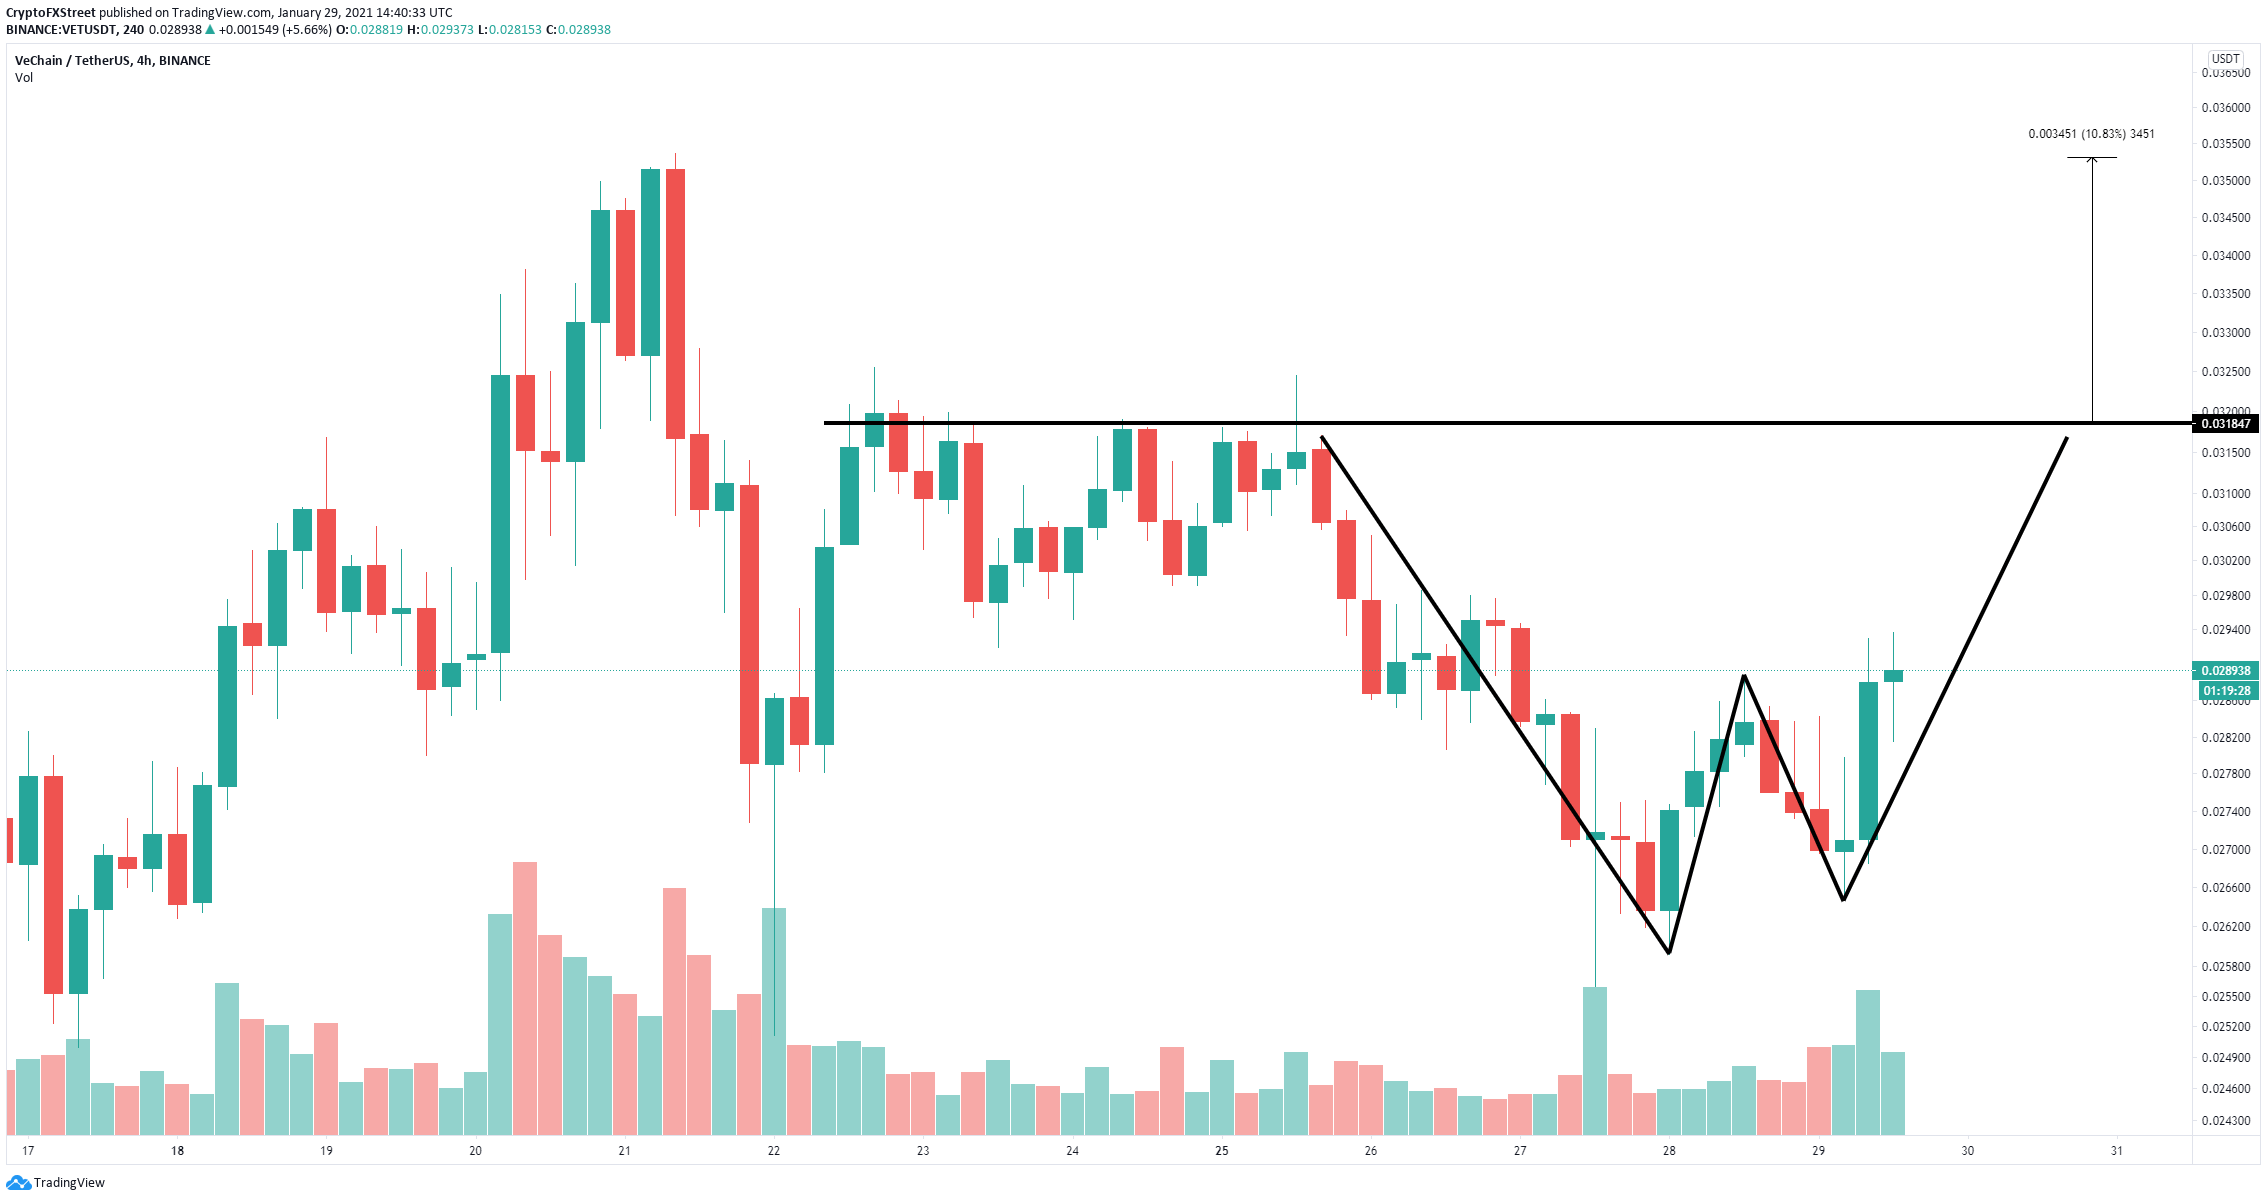
VET/USD 4-hour chart
The next price target is $0.032 which is the resistance trendline formed by the pattern. However, a breakout above this point would push Vechain even higher up to the last high of $0.035 as there is almost no resistance on the way up.
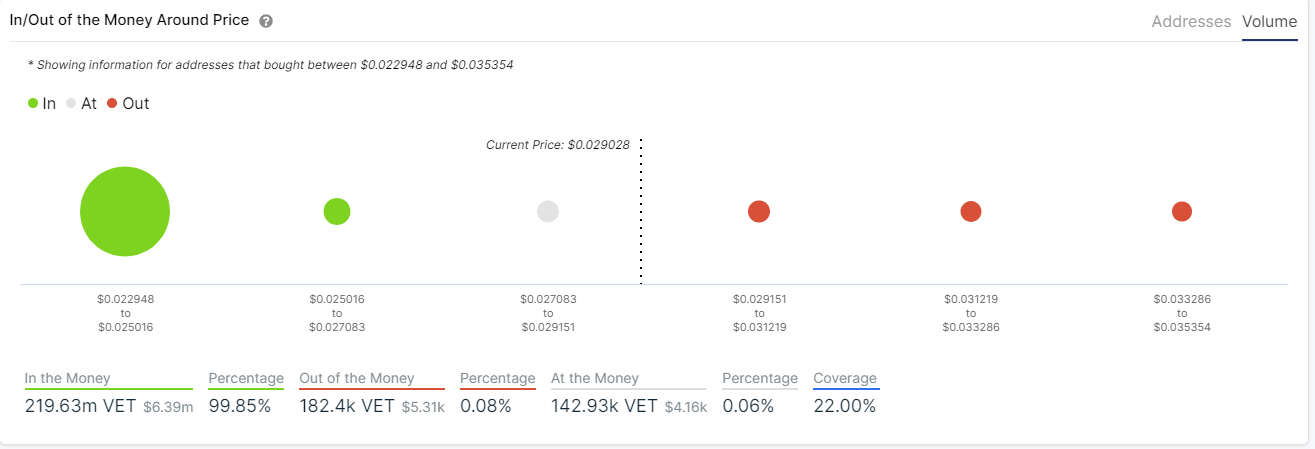
VET IOMAP chart
The In/Out of the Money Around Price (IOMAP) chart shows practically no strong resistance levels above $0.03, in comparison to a robust support area located between $0.022 and $0.025.
%20[15.41.58,%2029%20Jan,%202021]-637475282649381225.png)
VET Social Volume
However, Vechain has experienced several significant spikes in Social volume over the past week which can usually indicate a strong pullback is underway. This happened on January 6, July 11, 2020, June 2020, and in several other occasions. According to the IOMAP, Vechain price could fall as a low as $0.022.
Author

Lorenzo Stroe
Independent Analyst
Lorenzo is an experienced Technical Analyst and Content Writer who has been working in the cryptocurrency industry since 2012. He also has a passion for trading.


