- Vechain price was contained inside a descending parallel channel on the 4-hour chart.
- The breakout has a price target of $0.034 which is a 20% move from current levels.
- The digital asset has a lot of bullish momentum behind it.
After a rally towards $0.035 that peaked on January 21, Vechain has been under a consolidation period hitting a low of $0.024 on February 1. Since then, the digital asset has recovered significantly and broke out of a parallel channel.
Vechain price has no barriers to prevent it from reaching $0.034
On February 3, Vechain price broke out of a descending parallel channel and briefly re-tested the previous resistance trendline, managing to hold it. The digital asset is primed for a 20% move towards $0.034.
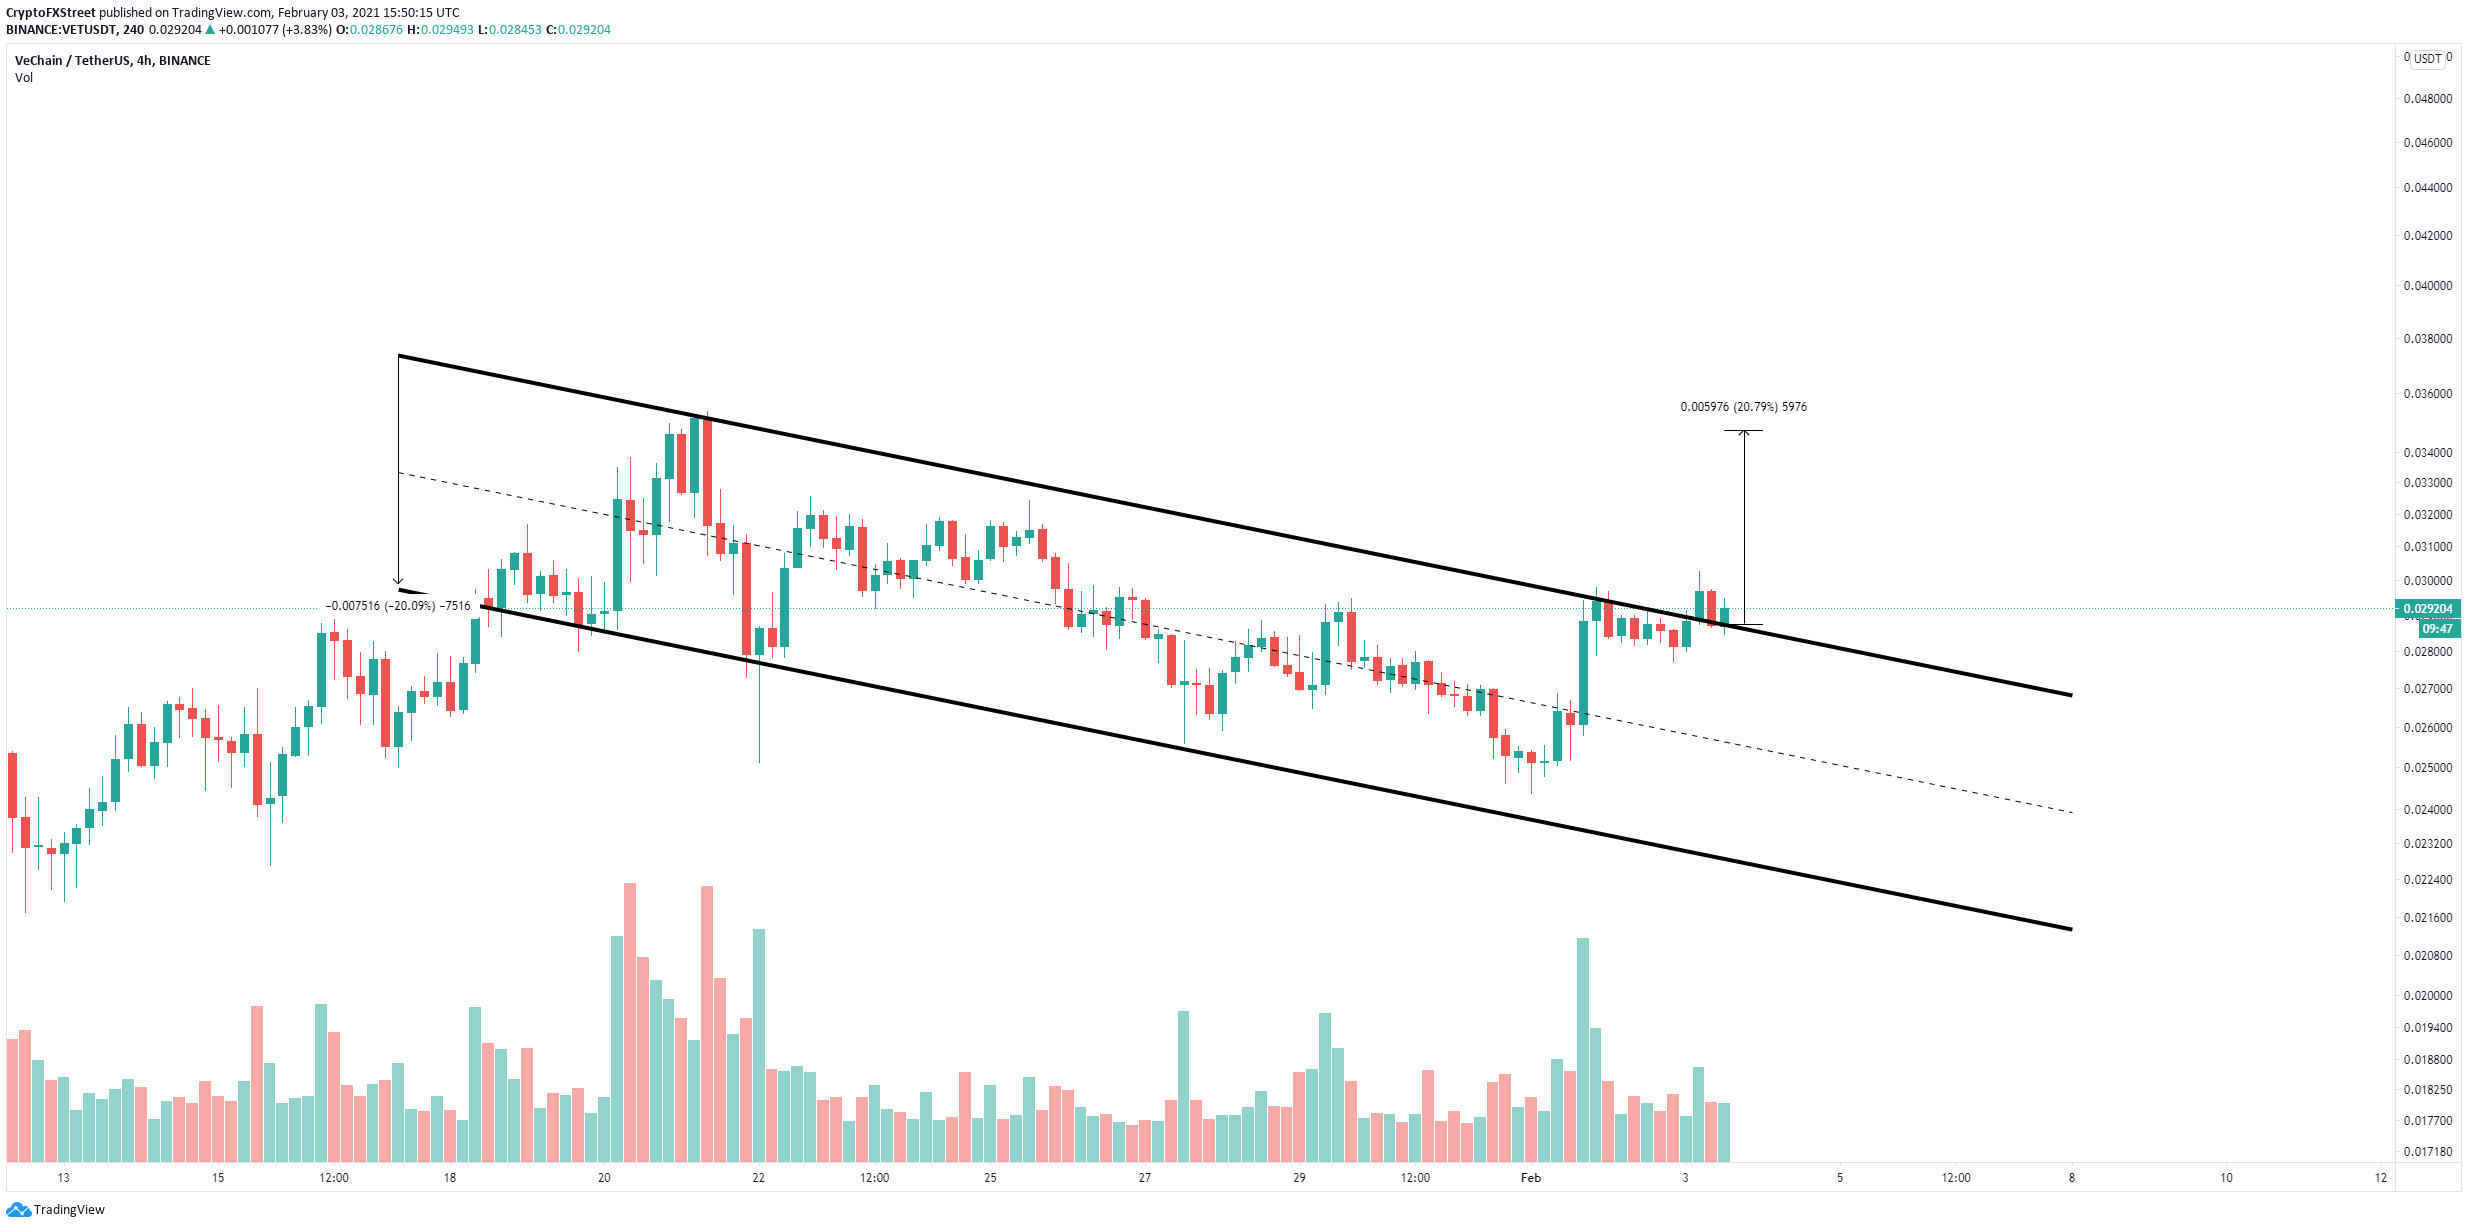
VET/USD 4-hour chart
Additionally, on the 1-hour chart, Vechain seems to have formed an inverse head and shoulders pattern which is a bullish indicator. A breakout above $0.03 gives us similar price targets as the pattern above, which adds more credence to the bullish outlook.
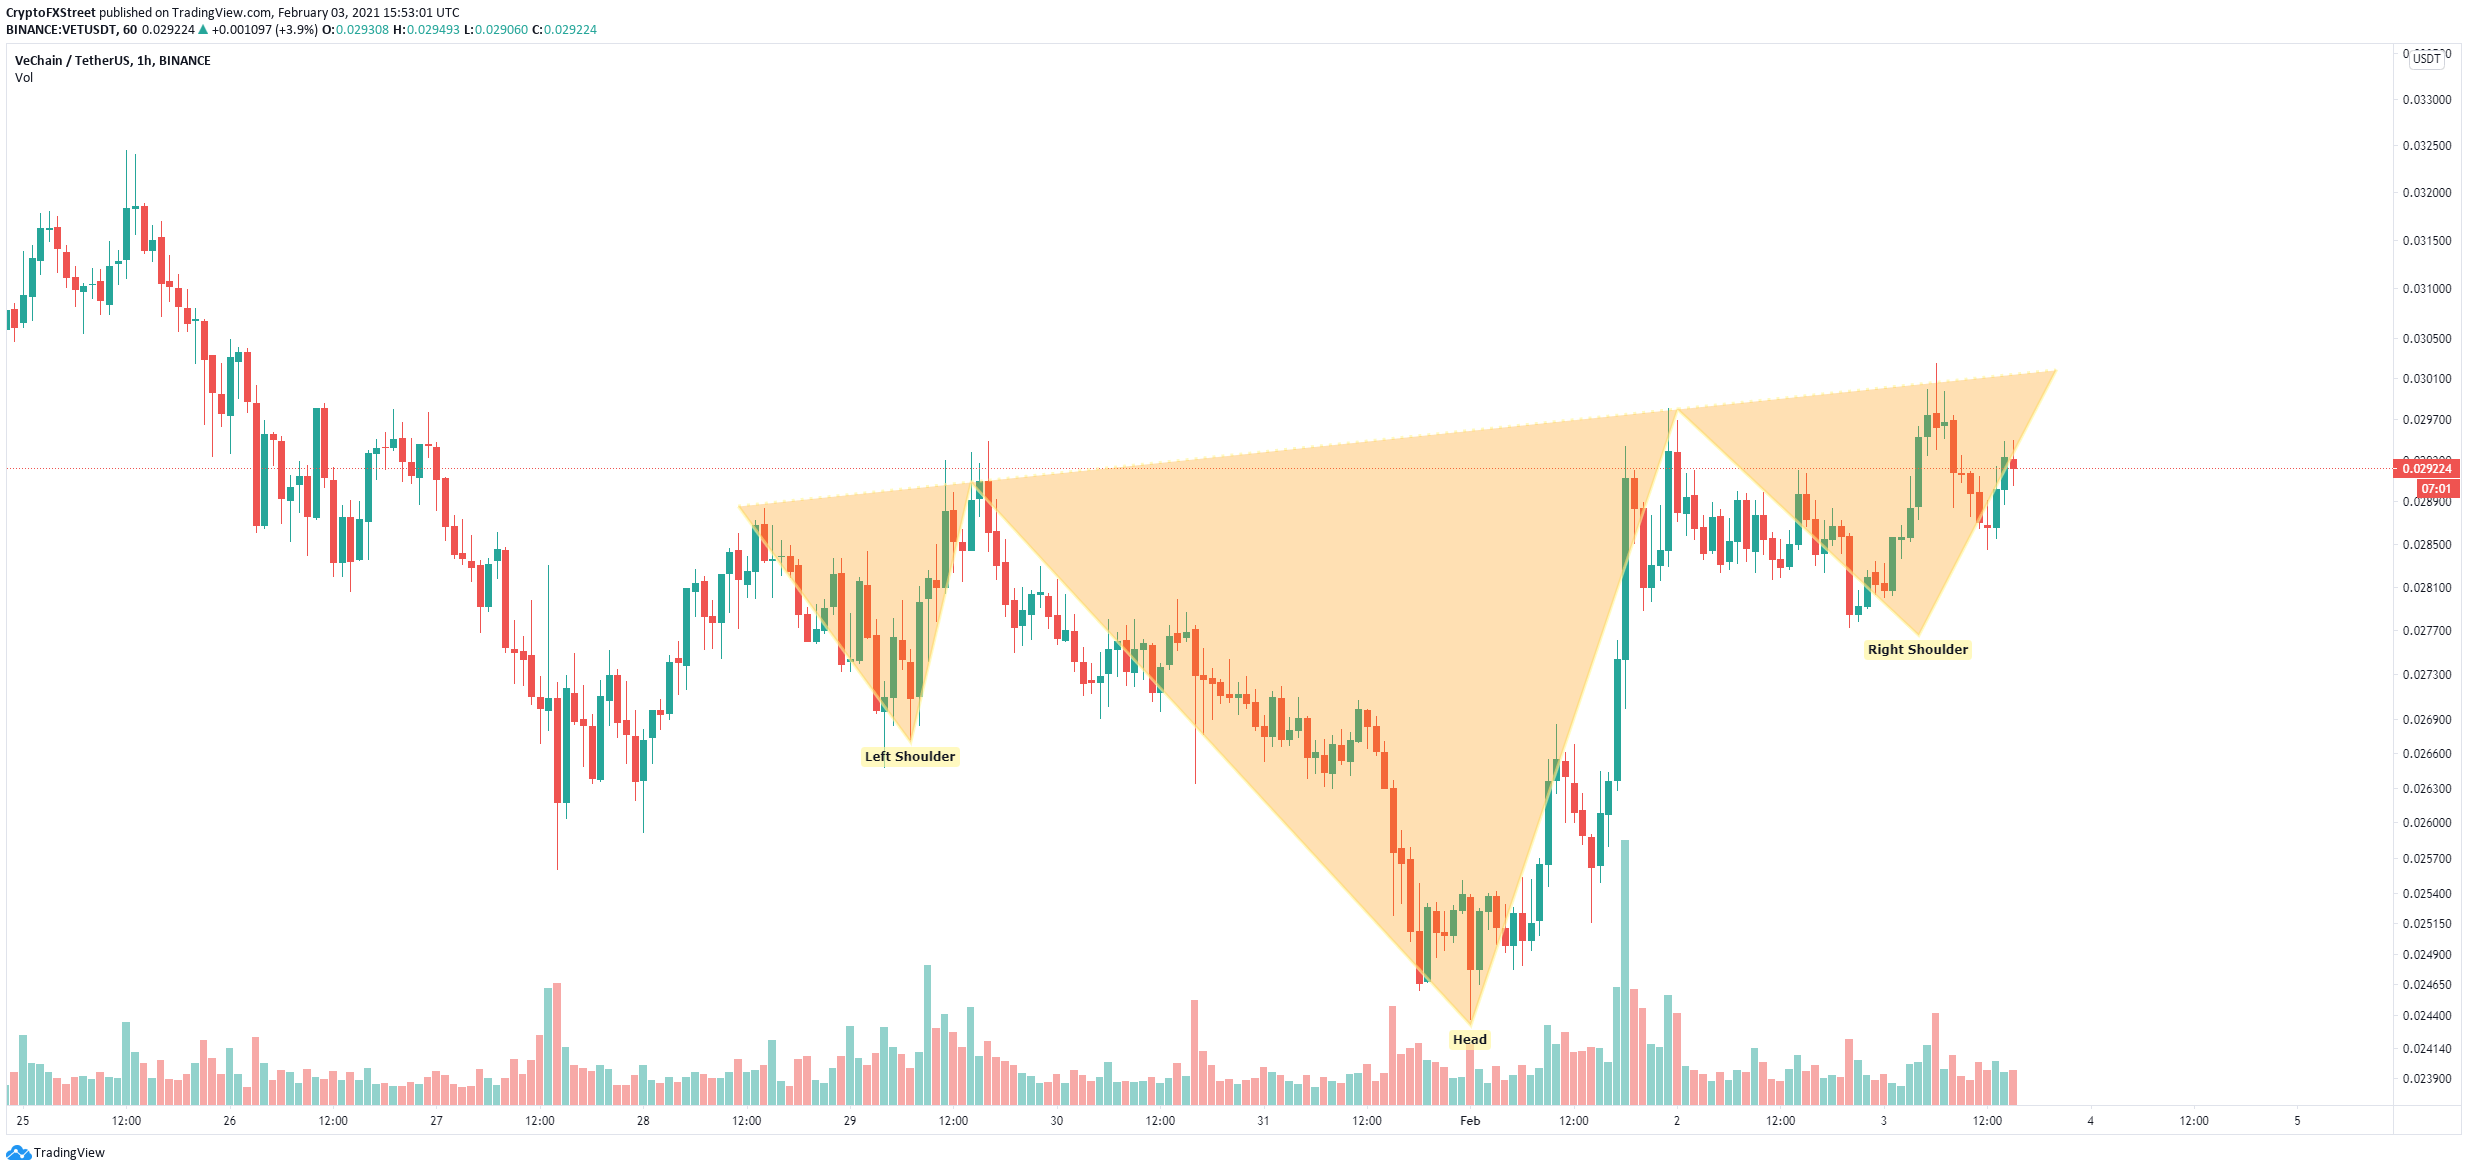
VET/USD 1-hour chart
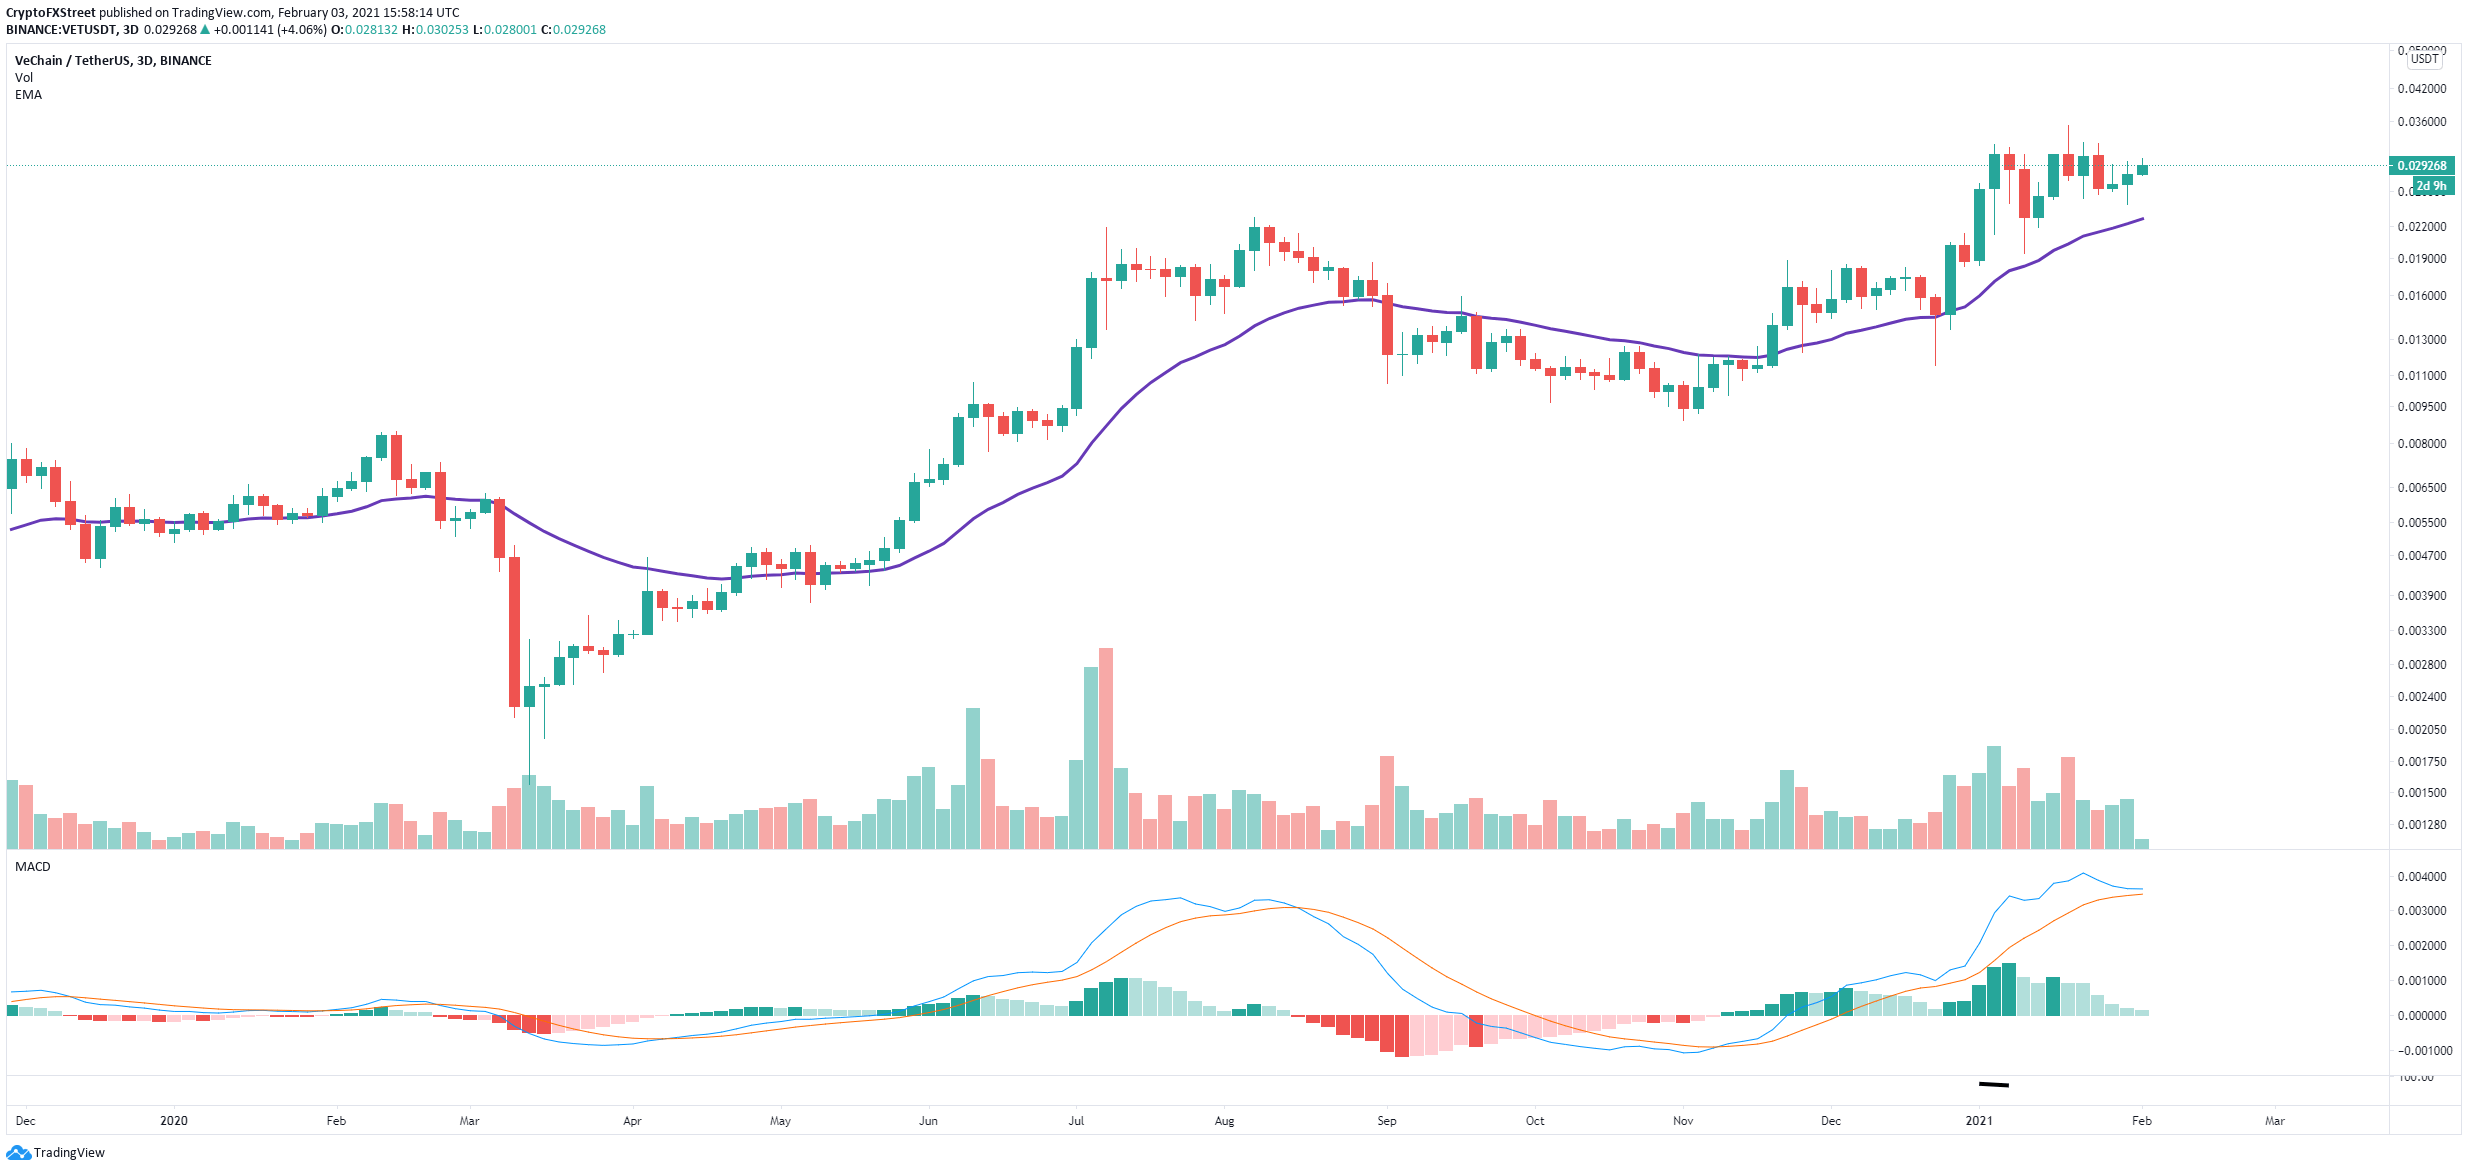
However, on the 3-day chart, Vechain price seems to have topped out as it has failed to close above $0.03 for the past two weeks. Additionally, the MACD is on the verge of a bear cross for the first time since August 16, 2020.
VET/USD 3-day chart
If VET gets rejected from $0.03 again, it could fall towards the 26-EMA on the 3-day chart which is currently located at $0.022.
Note: All information on this page is subject to change. The use of this website constitutes acceptance of our user agreement. Please read our privacy policy and legal disclaimer. Opinions expressed at FXstreet.com are those of the individual authors and do not necessarily represent the opinion of FXstreet.com or its management. Risk Disclosure: Trading foreign exchange on margin carries a high level of risk, and may not be suitable for all investors. The high degree of leverage can work against you as well as for you. Before deciding to invest in foreign exchange you should carefully consider your investment objectives, level of experience, and risk appetite. The possibility exists that you could sustain a loss of some or all of your initial investment and therefore you should not invest money that you cannot afford to lose. You should be aware of all the risks associated with foreign exchange trading, and seek advice from an independent financial advisor if you have any doubts.
Recommended Content
Editors’ Picks
Ripple on-chain metrics show bullish signs amidst legal struggle with SEC, XRP eyes recovery
![Ripple on-chain metrics show bullish signs amidst legal struggle with SEC, XRP eyes recovery](https://editorial.fxstreet.com/images/Markets/Currencies/Cryptocurrencies/Coins/Ripple/Ripple_Coin_31_02_XtraSmall.jpg)
Ripple made a comeback above $0.48 on Tuesday and hovers above that level in Wednesday’s European session. Ripple on-chain metrics such as transaction volume and Network Realized Profit/Loss have turned bullish, supporting a recovery in the altcoin.
Bitcoin price falls amidst German government transfers, miners activity
![Bitcoin price falls amidst German government transfers, miners activity](https://editorial.fxstreet.com/images/Markets/Currencies/Digital%20Currencies/Bitcoin/bit-coin-symbol-flag-3d-illustration-59931110_XtraSmall.jpg)
Bitcoin (BTC) extends correction on Wednesday and hovers around $61,000 after finding resistance near the $64,000 level on Monday. Recent on-chain data indicates heightened selling activity from Bitcoin miners early in the week.
Crypto Today: Bitcoin erases gains from end of June, Ethereum declines while Ripple holds
![Crypto Today: Bitcoin erases gains from end of June, Ethereum declines while Ripple holds](https://editorial.fxstreet.com/images/Markets/Currencies/Digital%20Currencies/Bitcoin/Bitcoin_2_XtraSmall.jpg)
Bitcoin wipes out gains from the last week of June and falls below $60,000 on Wednesday. Ethereum and top altcoins ranked by market capitalization erased gains as the inflation outlook worsened. Ripple holds on to recent gains and hovers above $0.48 on Wednesday.
Three reasons why altcoins could shake off losses this week
![Three reasons why altcoins could shake off losses this week](https://editorial.fxstreet.com/images/Markets/Currencies/Cryptocurrencies/cryptos_XtraSmall.jpg)
On-chain data from Santiment shows that altcoins are currently in the opportunity zone, or generating buy signals. The top three altcoins in the buy zone are Basic Attention Token (BAT), Chromia (CHR), and Highstreet (HIGH), per Santiment.
Bitcoin: BTC price correction could end in July, according to seasonal data
![Bitcoin: BTC price correction could end in July, according to seasonal data](https://editorial.fxstreet.com/images/Markets/Currencies/Digital%20Currencies/Bitcoin/bitcoin_5_XtraSmall.jpg)
Bitcoin (BTC) price appears poised for a decline this week, influenced by slight outflows in US spot ETFs, selling activity among BTC miners, and a combined transfer of 4,690.28 BTC to centralized exchanges by the US and German governments.