VeChain price at a critical state, VET 60% rally on pause
- VeChain price breakout from an ascending triangle pattern is quickly rebuffed by influential moving average.
- Emergence at the apex of the triangle dampens the potential for the pattern to evolve into noteworthy returns.
- A decline below $0.092 will confirm a bearish outlook for VET, as a death cross looms on the 12-hour chart.

VeChain price sits at a critical junction on the 12-hour chart, fighting off the resistance of the 50 twelve-hour simple moving average (SMA) and 61.8% Fibonacci retracement of the April-May correction while hanging on to the 200 twelve-hour SMA. It is unclear which path VET will take.
VeChain price recovery from the May 19 low was compelling, but not enough
VeChain price tumbled 80% from the April high to the May low, logging its worst weekly decline since 2018 and making it one of the largest losses in the cryptocurrency complex in May.
VET responded to the remarkable correction with a notable 220% rebound from the May 19 low into the May 20 high. Following the rebound, VeChain price orchestrated an ascending triangle pattern that triggered yesterday.
The measured move of the pattern is 67% from the triangle’s upper trend line at $0.140, setting VeChain price on course to rally close to the May high at $0.250.
However, VeChain price followed up the triangle breakout with a sharp 12% reversal and a bearish outside bar on the twelve-hour chart. The pullback comes after clashing with the 50 twelve-hour SMA at $0.137 and the 61.8% retracement at $0.140.
Adding to the uncertainty of the breakout is the fact that it occurred at the apex of the ascending triangle. Based on historical precedent, late breakouts lessen the vigor of an advance and increase the odds of it failing.
VeChain price is at an inflection point not only for the pattern’s eventual resolution but for the larger rally from the May 19 low. VET needs a daily close above $0.152 to confirm the upside breakout and introduce an advance to the 78.6% retracement of the April-May correction at $0.189.
A successful break above the retracement level leaves VET poised to reach the measured move target of $0.235.
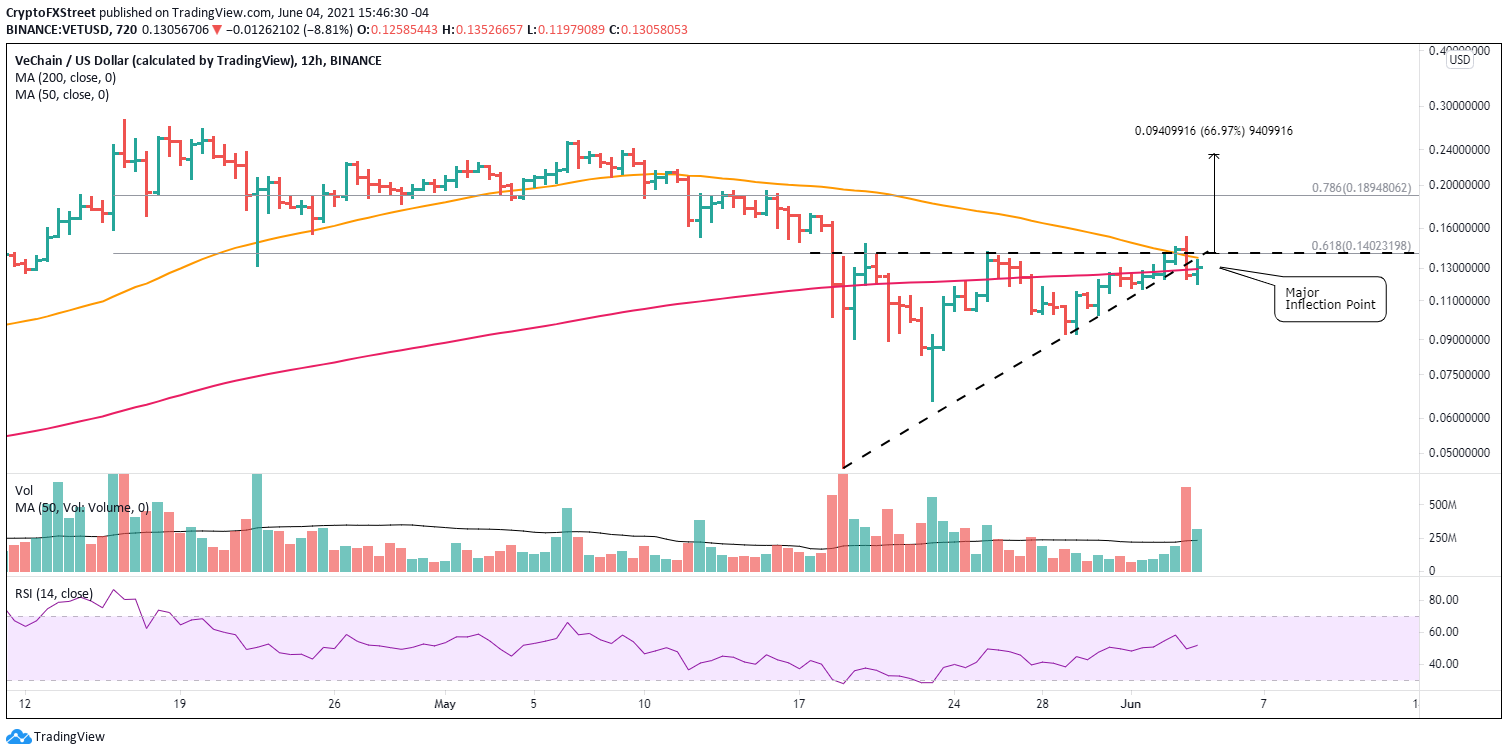
VET/USD 12-hour chart
If VeChain price falls below $0.092 on a twelve-hour close, market operators should pivot their trading direction to the short side. Adding to the suspense and potential for a bearish evolution of the VET price action is the looming death cross. A death cross occurs when the faster moving average crosses below the slower moving average. In this case, it is the 50 twelve-hour SMA crossing below the 200 twelve-hour SMA.
The mix of a death cross, a significant Fibonacci retracement level and a bearish engulfing bar has put the ascending triangle breakout on pause. Nevertheless, investors should not be surprised if VeChain price turns down with momentum moving forward.
Author

Sheldon McIntyre, CMT
Independent Analyst
Sheldon has 24 years of investment experience holding various positions in companies based in the United States and Chile. His core competencies include BRIC and G-10 equity markets, swing and position trading and technical analysis.


