VeChain Price Analysis: VET looking to re-test $0.017 in the short-term
- VET is currently trading at $0.0147 after a notable bounce from its low in September at $0.01.
- VET price is facing some resistance in the form of the 12-EMA at $0.0148.

VeChain had a steep correction after its peak on August 7, and it’s still down 36% since then. Bulls are looking for a clear breakout while bears are waiting to continue with the robust downtrend formed.
VET/USD 3-day chart
-637360459719165878.png)
On the 3-day chart, the TD Sequential indicator created a strong buy signal on September 9, which has been confirmed now after two consecutive green candlesticks. The 12-EMA resistance level is right around the current price, and the MACD looks to be on the path of a bullish cross.
VET IOMAP Chart
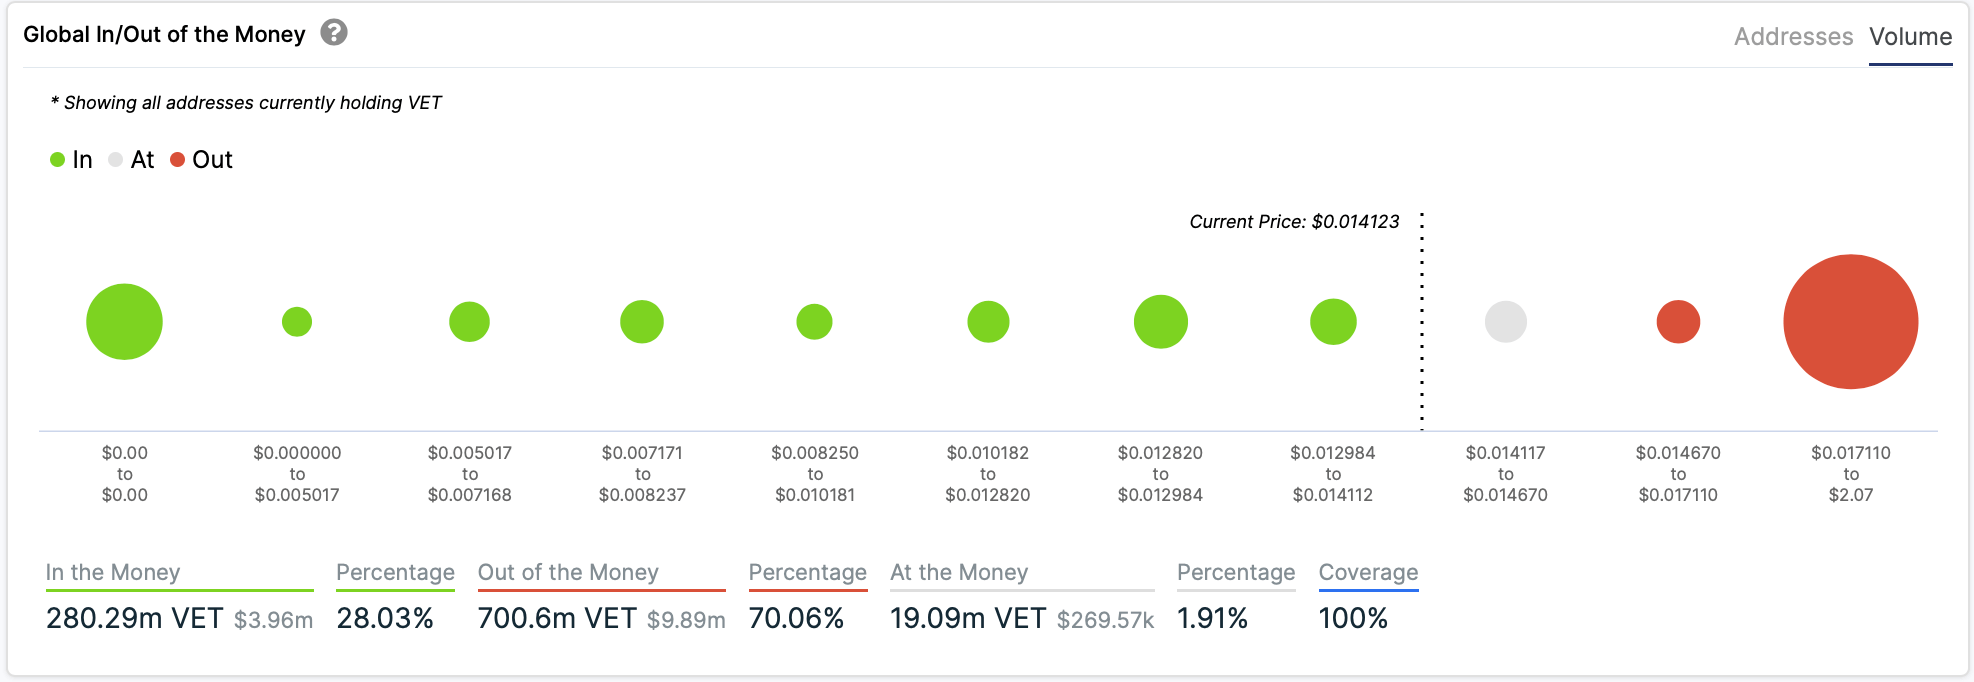
Source: IntoTheBlock
Furthermore, looking at the IOMAP chart, we can notice that there is very little resistance between $0.014 and $0.017; however, above this last level, there is a massive resistance cluster.
VET/USD daily chart
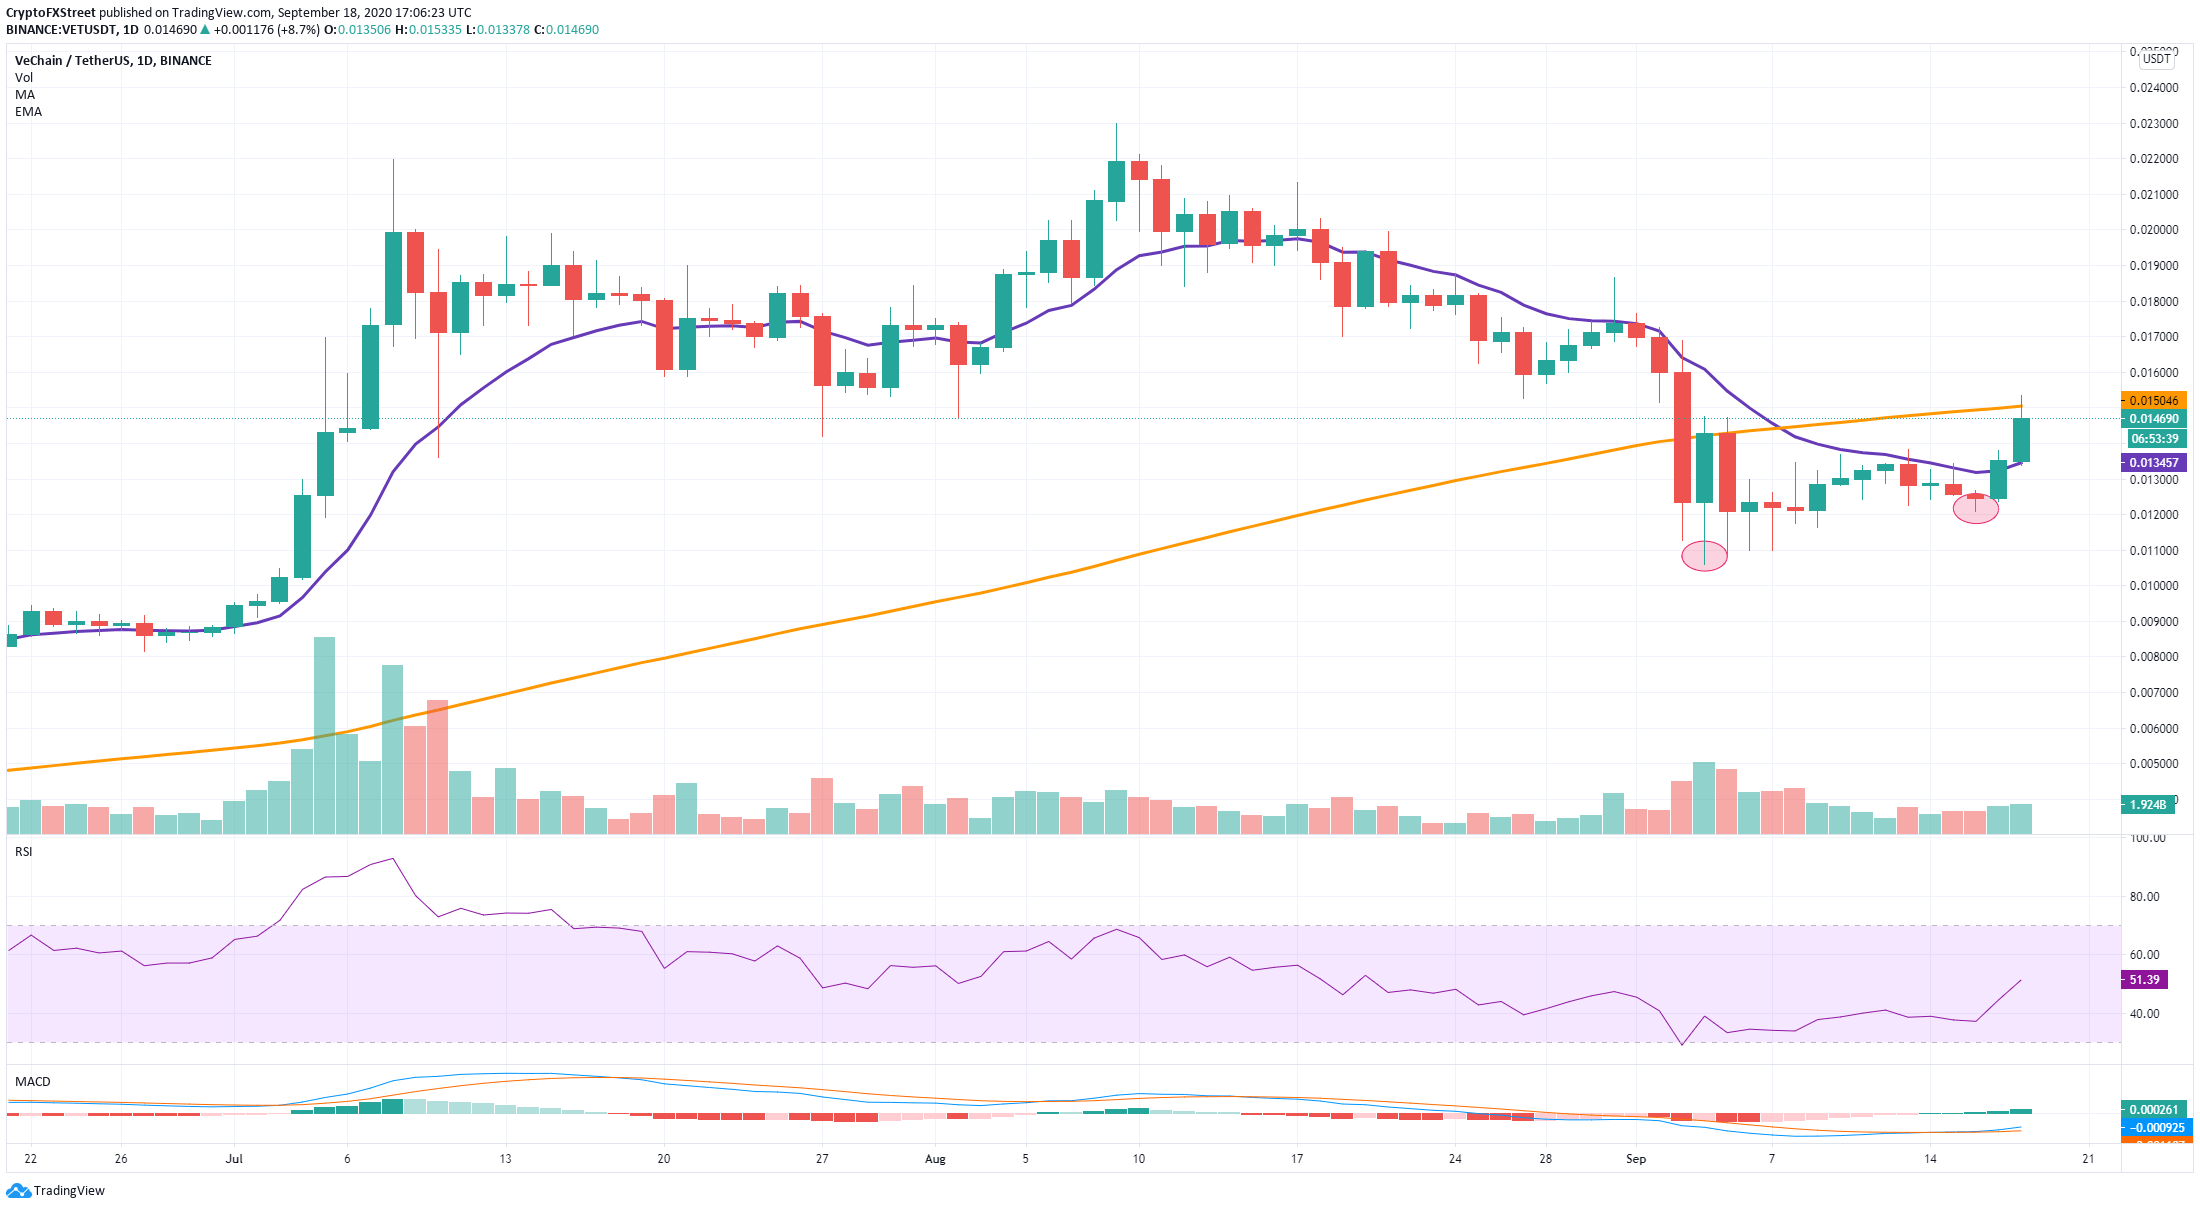
VET's daily chart is looking more bullish now that the price established a higher low and a higher high. The MACD also turned bullish, but the 100-MA is acting as a strong resistance level.
VET New Addresses
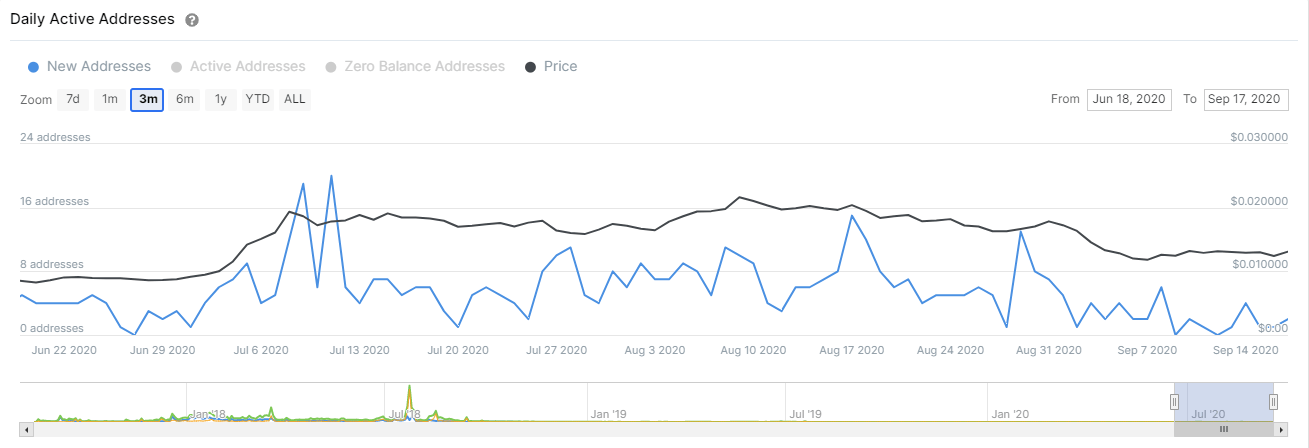
Source: IntoTheBlock
Unfortunately, even if the bulls can push VET towards $0.017, the colossal resistance cluster at that level will most likely push it back down. However, the interest in VET seems to be fading away as the number of new addresses has been declining since July. Similarly, the number of transactions is also down.
The most critical resistance level remains at $0.017, while support is at $0.01.
Author

Lorenzo Stroe
Independent Analyst
Lorenzo is an experienced Technical Analyst and Content Writer who has been working in the cryptocurrency industry since 2012. He also has a passion for trading.


