VeChain Elliott Wave technical analysis [Video]
![VeChain Elliott Wave technical analysis [Video]](https://editorial.fxstreet.com/images/Markets/Currencies/Cryptocurrencies/VeChain/vechain-150x150logo-637399983192838290_XtraLarge.png)
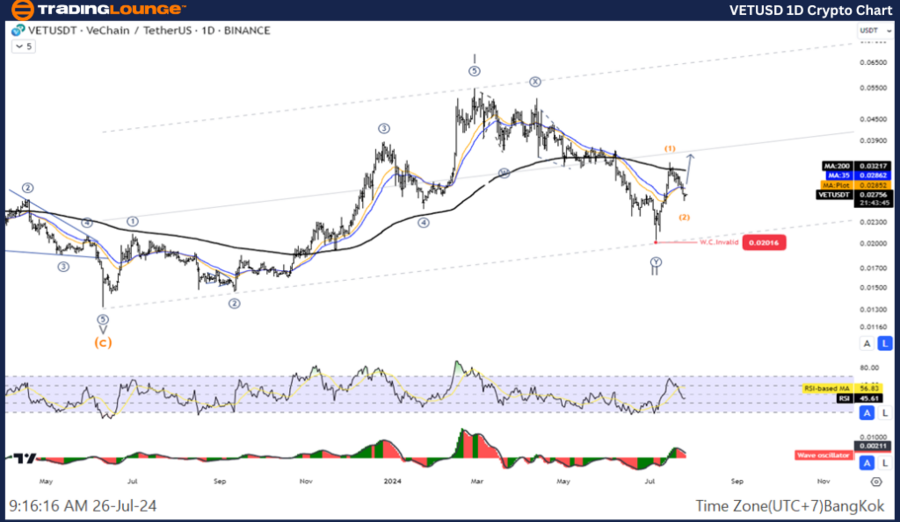
VET/USD Elliott Wave technical analysis
Function: Counter trend.
Mode: Corrective.
Structure: Double Corrective.
Position: Wave ((Y)).
Direction Next higher Degrees: Wave II of Impulse.
Wave cancel invalid level: 0.2100.
Details: Wave II May is complete and the price increase again in Wave III.
VeChain / U.S. dollar (VETUSD) trading strategy: VeChain's trend seems to be over as the price action in Wave 1 is likely to be over. The price is entering a correction in Wave 2, which is likely to test the 50-61.8% level of Wave 1 before rising again in Wave 3. So, look for an opportunity to rejoin the trend.
VeChain / U.S. dollar (VETUSD) technical indicators: The price is below the MA200 indicating a Downtrend, The Wave Oscillator is a Bullish Momentum.
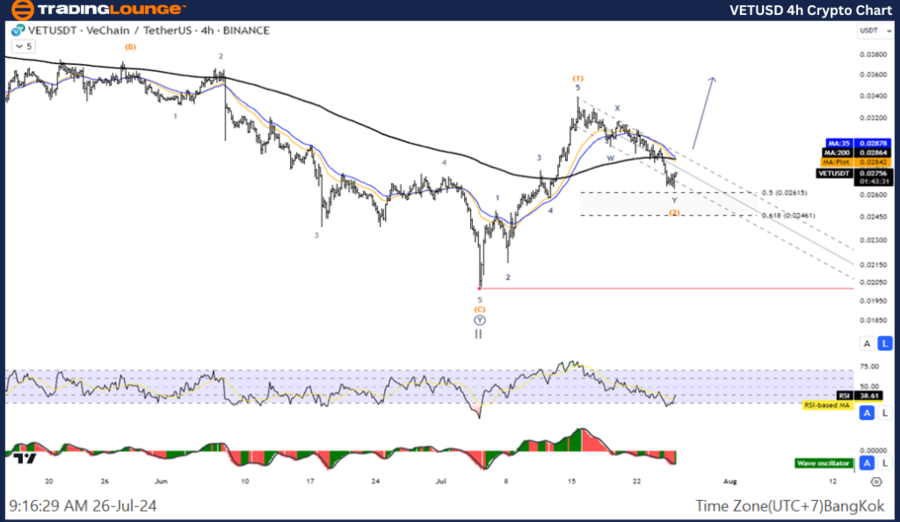
VET/USD Elliott Wave technical analysis four-hour chart
Function: Counter trend.
Mode: Corrective.
Structure: Double Corrective.
Position: Wave Y.
Direction next higher degrees: Wave (2) of Impulse.
Wave cancel invalid level: 0.2100.
Details: Wave(2)I May is complete and the price increase again in Wave (3).
VeChain / U.S. dollar (VETUSD) trading strategy: VeChain's trend seems to be over as the price action in Wave 1 is likely to be over. The price is entering a correction in Wave 2, which is likely to test the 50-61.8% level of Wave 1 before rising again in Wave 3. So, look for an opportunity to rejoin the trend.
VeChain / U.S. dollar (VETUSD) technical indicators: The price is below the MA200 indicating a Downtrend, The Wave Oscillator is a Bearish Momentum.
VeChain Elliott Wave technical analysis [Video]
Author

Peter Mathers
TradingLounge
Peter Mathers started actively trading in 1982. He began his career at Hoei and Shoin, a Japanese futures trading company.


