Vechain Elliott Wave technical analysis [Video]
![Vechain Elliott Wave technical analysis [Video]](https://editorial.fxstreet.com/images/Markets/Currencies/Cryptocurrencies/VeChain/vechain-150x150logo-637399983192838290_XtraLarge.png)
Elliott Wave Analysis TradingLounge
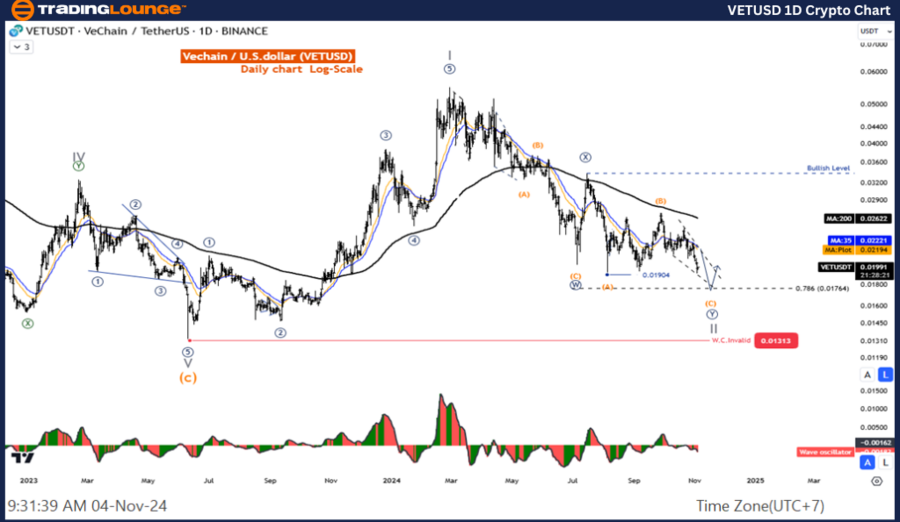
Vechain/ U.S. dollar(VETUSD)
VET/USD Elliott Wave technical analysis
Function: Counter trend.
Mode: Corrective.
Structure: Double Corrective.
Position: Wave ((Y)).
Direction next higher degrees: Wave II of Impulse.
Wave cancel invalid level:
Details: Wave II may not be complete, price is likely to be below 0.01781.
Vechain/ U.S. dollar(VETUSD)Trading Strategy:
The wave II correction is entering the late decline phase, so the overall picture is a short-term correction to continue up in wave III. Look for an opportunity to join the uptrend when the correction is complete.
Vechain/ U.S. dollar(VETUSD)Technical Indicators: The price is below the MA200 indicating a downtrend, The Wave Oscillator is a Bearish Momentum.
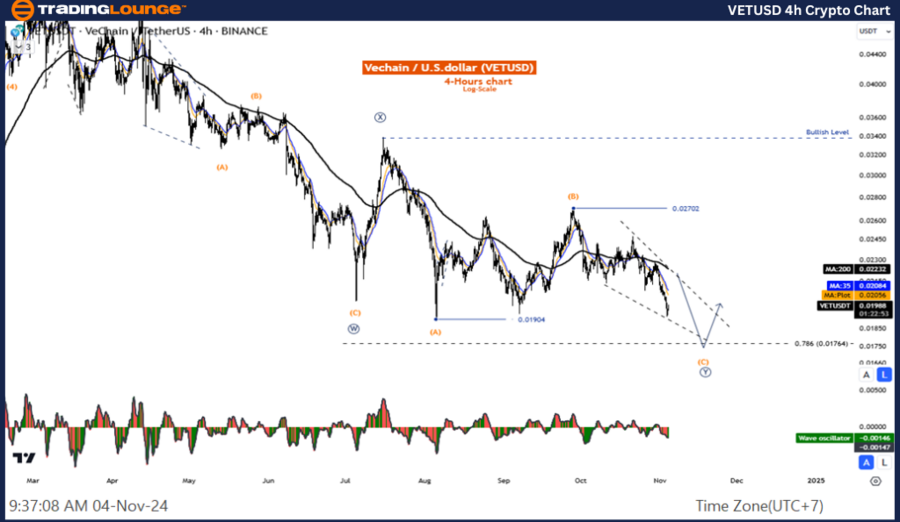
Technical analyst: Kittiampon Somboonsod.
VET/USD Elliott Wave technical analysis [Video]
Author

Peter Mathers
TradingLounge
Peter Mathers started actively trading in 1982. He began his career at Hoei and Shoin, a Japanese futures trading company.


