'Up only' for BTC fundamentals – Five things to watch in Bitcoin this week
Bitcoin (BTC) starts the week with a slow drag downhill towards pivotal support at $40,000.
After bulls had something to celebrate last week, the current environment looks like a fresh dose of reality as BTC battles nervous stock markets, a resurgent U.S. dollar and more.
The picture is, as always, mixed — while spot price may not look too impressive, under the hood, Bitcoin is stronger than ever, and network participants are doubling down on their long-term commitments.
Add to that the slow decline of risky behavior on derivatives markets and the stage could be set for some sustainable price growth. Will it happen this week?
Cointelegraph presents five factors to consider in the coming days for BTC/USD.
Bitcoin tests new 50-day moving average support
After ten days of recovery, Bitcoin is now reckoning with the resistance levels absent from bulls' radar since the middle of January.
Having passed $45,500 late last week, the weekend saw relatively calm conditions as the daily chart nonetheless saw a series of lower lows.
The weekly close, the topic of interest Sunday as price action stayed practically in an identical place to the end of last week, ultimately disappointed — BTC/USD set a lower close of just under $42,000.
With that, however, comes the possibility of short-term upside to fill the CME futures "gap" now above spot price at near $42,400.
"Bitcoin is still just sitting in between support and resistance," popular commentator Matthew Hyland summarized Monday, adding that he was "relaxing" in the face of current price moves.
With support and resistance levels close by, trader and analyst Rekt Capital meanwhile reiterated BTC's relative weakness when it comes to reclaiming support levels on a macro scale.
Previously, he had identified two moving averages which needed to be reconfirmed as support in order for Bitcoin to have a shot at its all-time high from November.
Closer to home, the 50-day moving average is being challenged as the new week begins after a week of action above, data from Cointelegraph Markets Pro and TradingView shows.
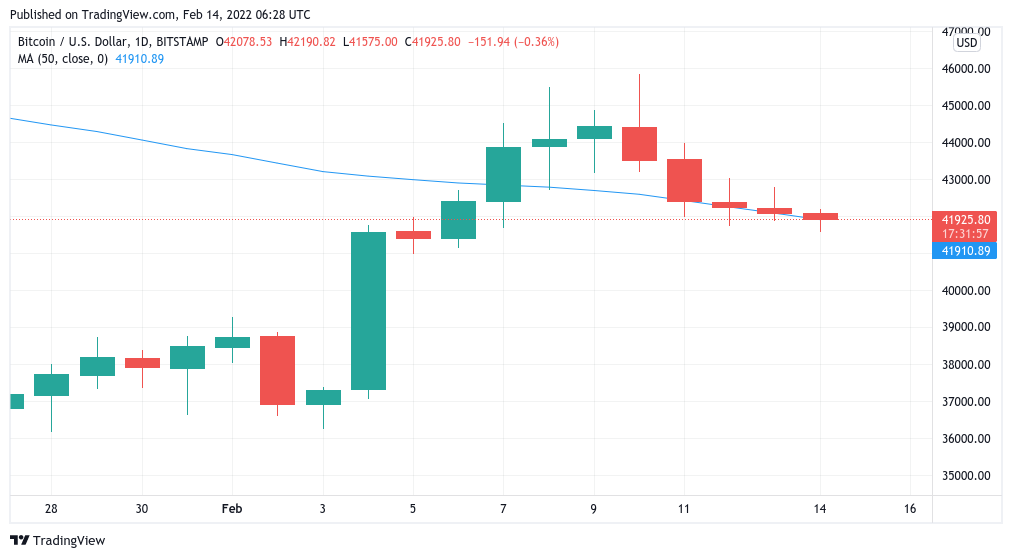
BTC/USD 1-day candle chart (Bitstamp) with 50-day MA. Source: TradingView
DXY sours risk asset mood
Bitcoin's reversal toward $40,000 may not be helped by an advancing U.S. dollar.
Since Feb. 4, the U.S. dollar currency index (DXY) has been on the rebound, cancelling a steep downtrend which had characterized the week prior.
That traditionally spells problems for risk assets, and as of Monday, DXY was trading back above the 96 mark.
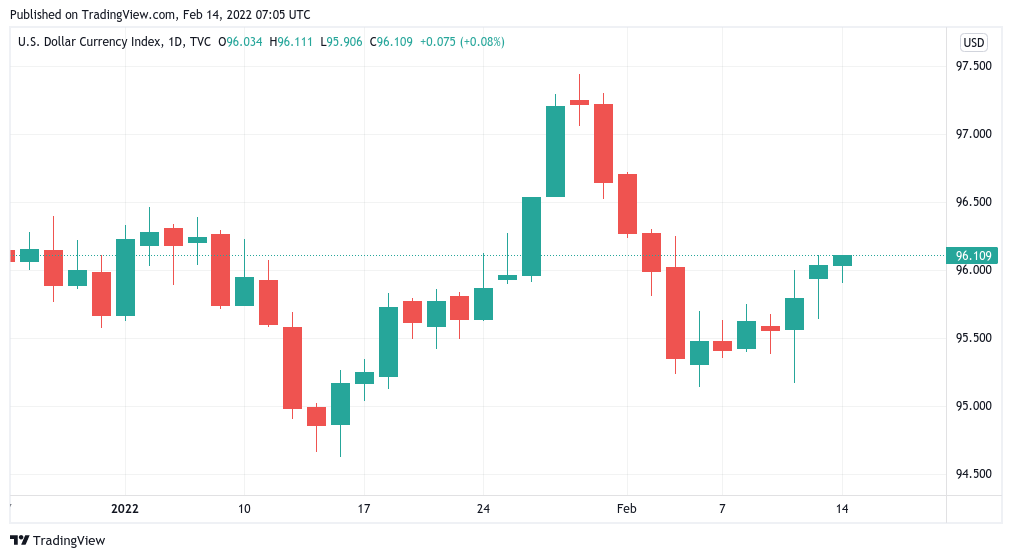
U.S. dollar currency index (DXY) 1-day candle chart. Source: TradingView
For stocks, already uninspired by the potential for Federal Reserve rate hikes in March, the geopolitical situation involving Ukraine and Russia remains a factor providing nervousness this week.
"Over the past century, there were only four years where both stocks and bonds had a negative year," analyst Lyn Alden meanwhile noted.
Obviously it is super early, but so far both stocks and bonds have had negative returns in 2022."
Oil meanwhile continued on its journey to the $100 mark on the same tensions, Brent Crude futures passing $96 a barrel Monday.
As Cointelegraph reported, both oil and Bitcoin remain a macro pick for this year.
Spot price starts leading futures
Amid the rise to and the comedown from local highs, interesting activity has been taking place on Bitcoin derivatives markets.
As noted by Twitter monitors including Glassnode lead analyst Checkmate, open interest leverage has been disappearing from futures markets — and with it the risk of getting deleveraged or "liquidated."
This time, however, the reduction is not coming from a sweeping change in price knocking out positions. Instead, investors themselves are choosing to change their strategy.
"Bitcoin futures leverage has fallen significantly this week, falling from 2.0% of Market cap, to 1.75%," Checkmate tweeted Sunday alongside a chart showing the de-risking.
"However, this was NOT the liquidation cascade we all know and love. This is from traders choosing to close out their positions, far healthier. I expect spot to lead now."
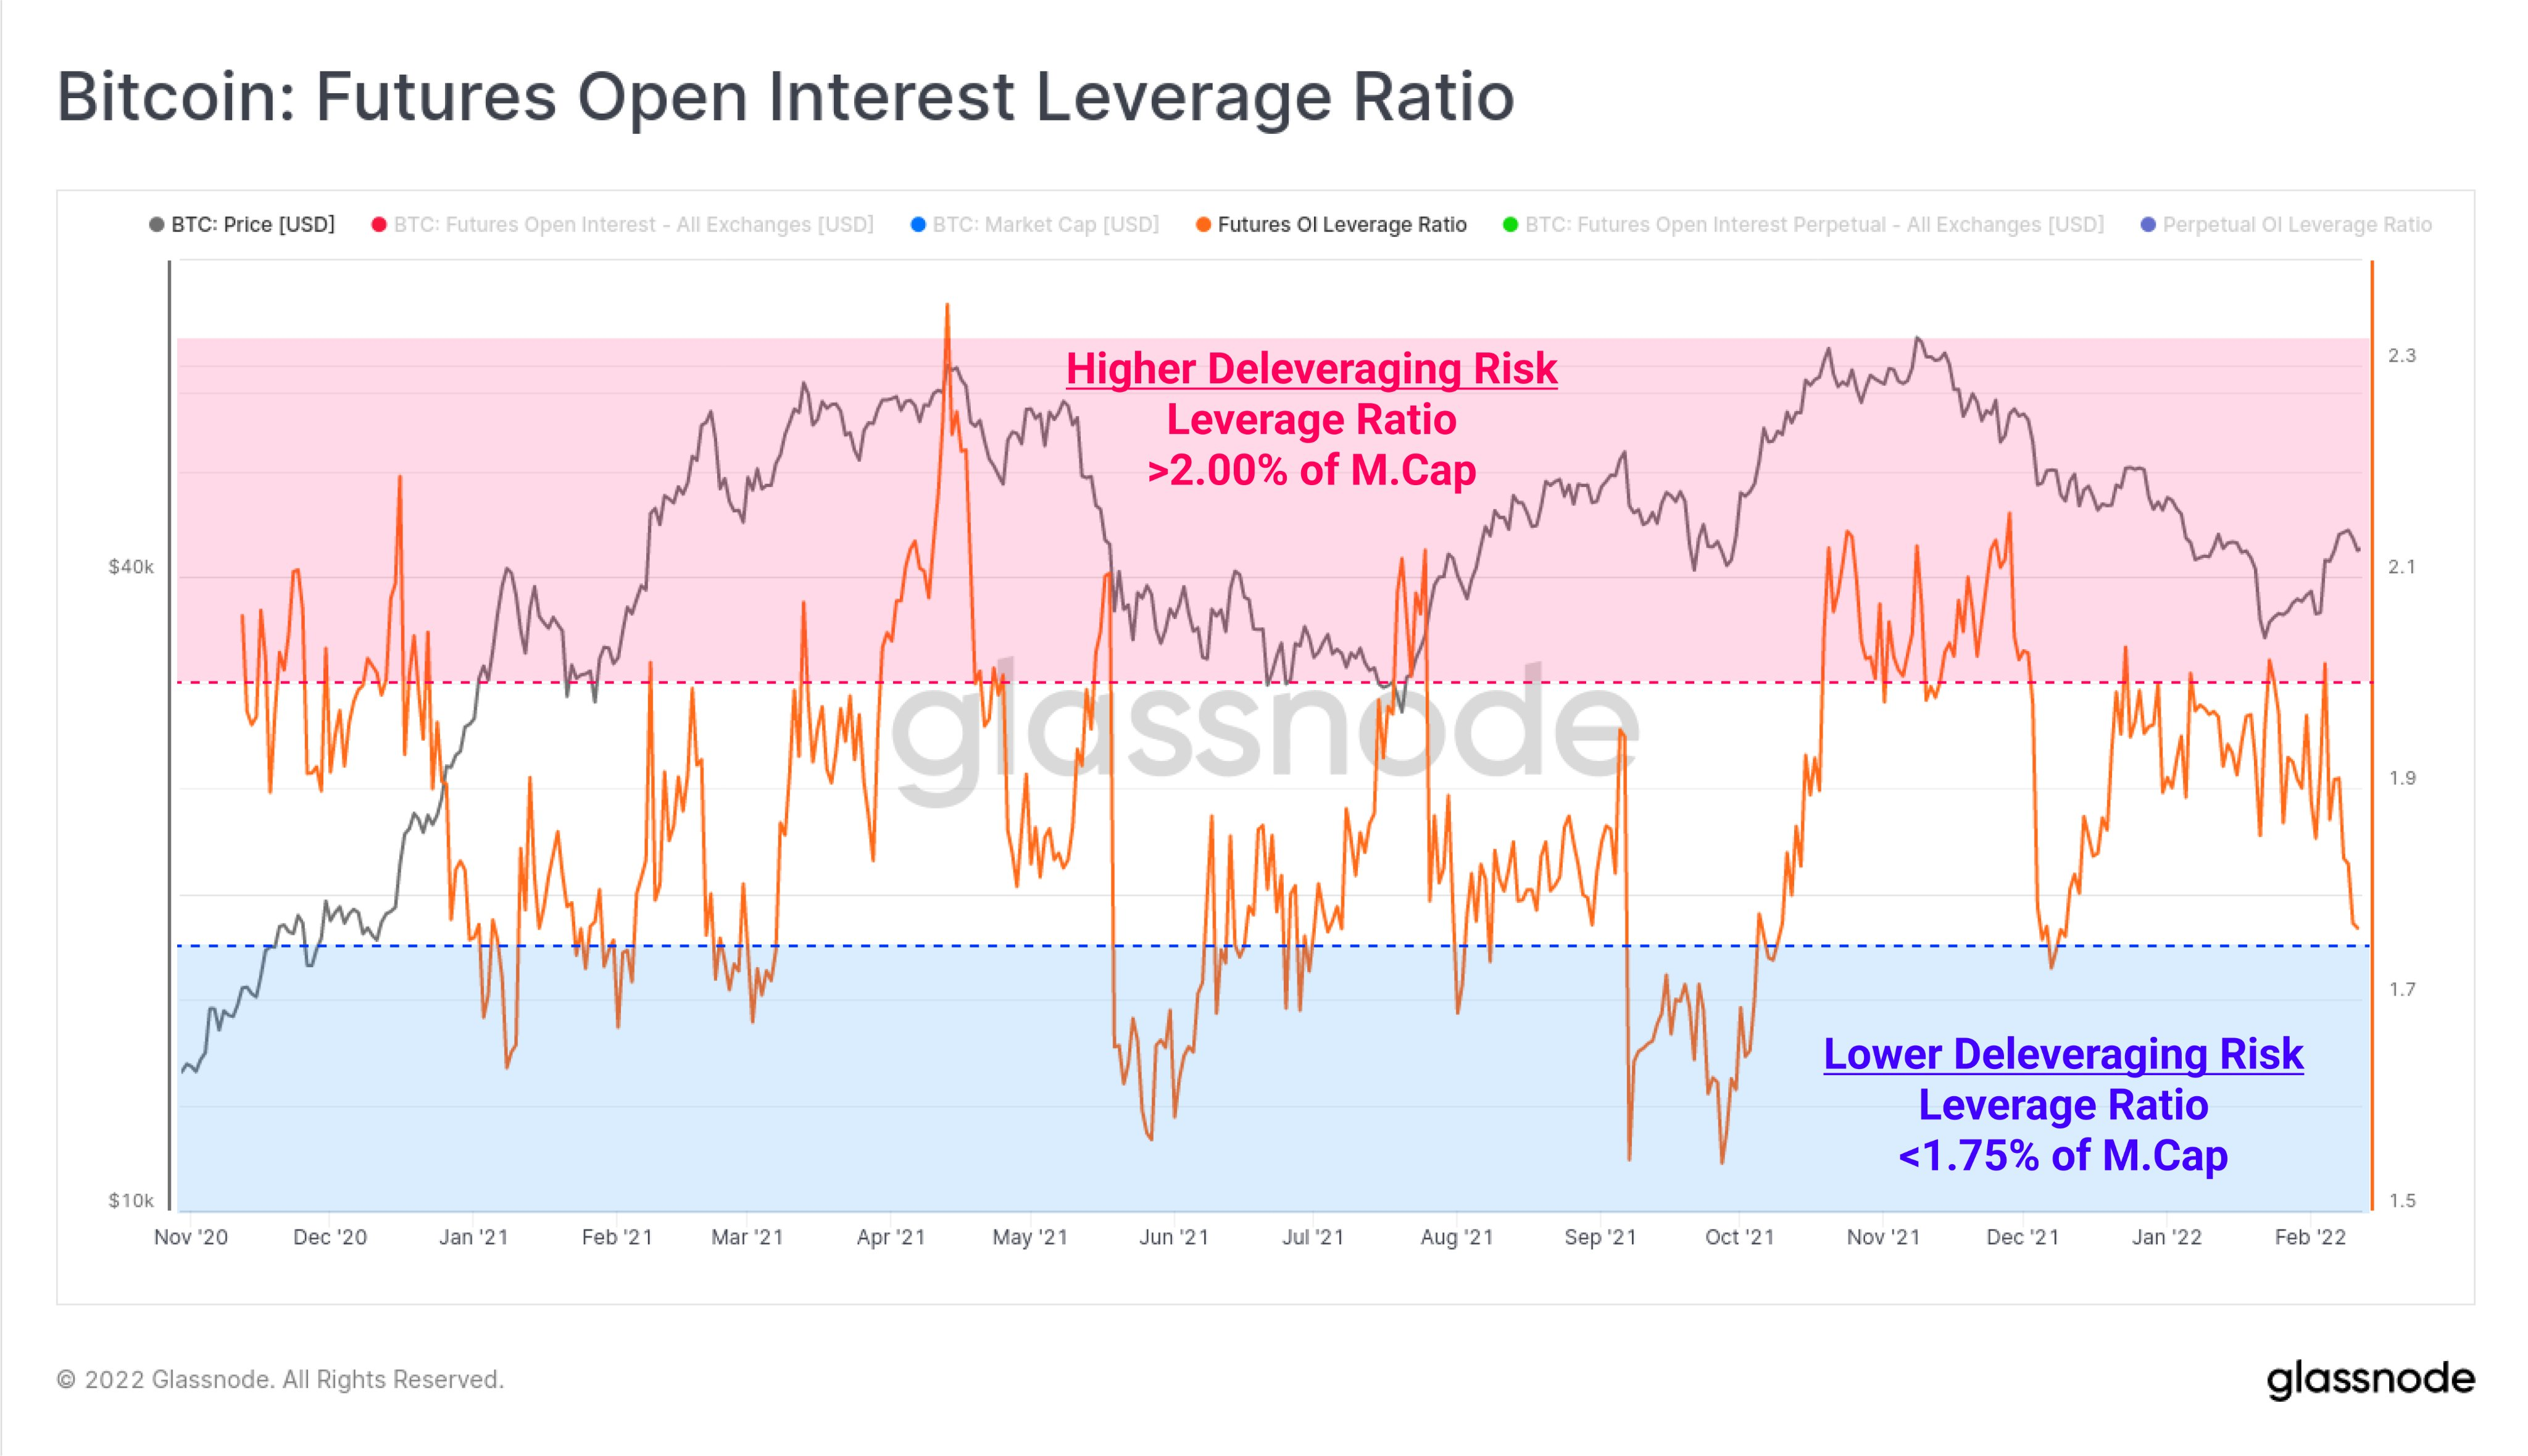
Bitcoin futures open interest leverage ratio vs. BTC/USD annotated chart. Source: Checkmate/ Twitter
Regarding the relationship between spot and futures prices, fellow commentator Byzantine General added that there is now the potential for futures to begin trading below, rather than above spot price.
The divergence between the futures basis and spot is already "pretty significant," he added in his own post overnight.
At the time of writing, CME futures were trading around $200 below spot price at exactly $42,000.
Hash rate follows difficulty to all-time highs
It's been a straight winning year for Bitcoin's network fundamentals so far, and this week is no exception.
Over the weekend, hash rate charts — an estimate of the processing power dedicated to mining — surged to new all-time highs.
While knowing the exact level of hashing power active on the Bitcoin network is impossible, hash rate estimates have shown a clear uptrend since the middle of last year, and the ecosystem took a matter of months to fully cancel out the impact of China's enforced miner migration.
Now, with the U.S. taking center stage for mining, it appears that it is a race to the top for participants.
More easily measurable is Bitcoin's mining difficulty, which has also recovered fully after diving to take into account the reduced hashing activity post-China.
As of Monday, difficulty stood at 26.69 trillion, but moreover, its next automated adjustment will send it even higher still — over 27 trillion for the first time.
The adjustment will kick in in around three days, and represent approximately a 2.2% increase.
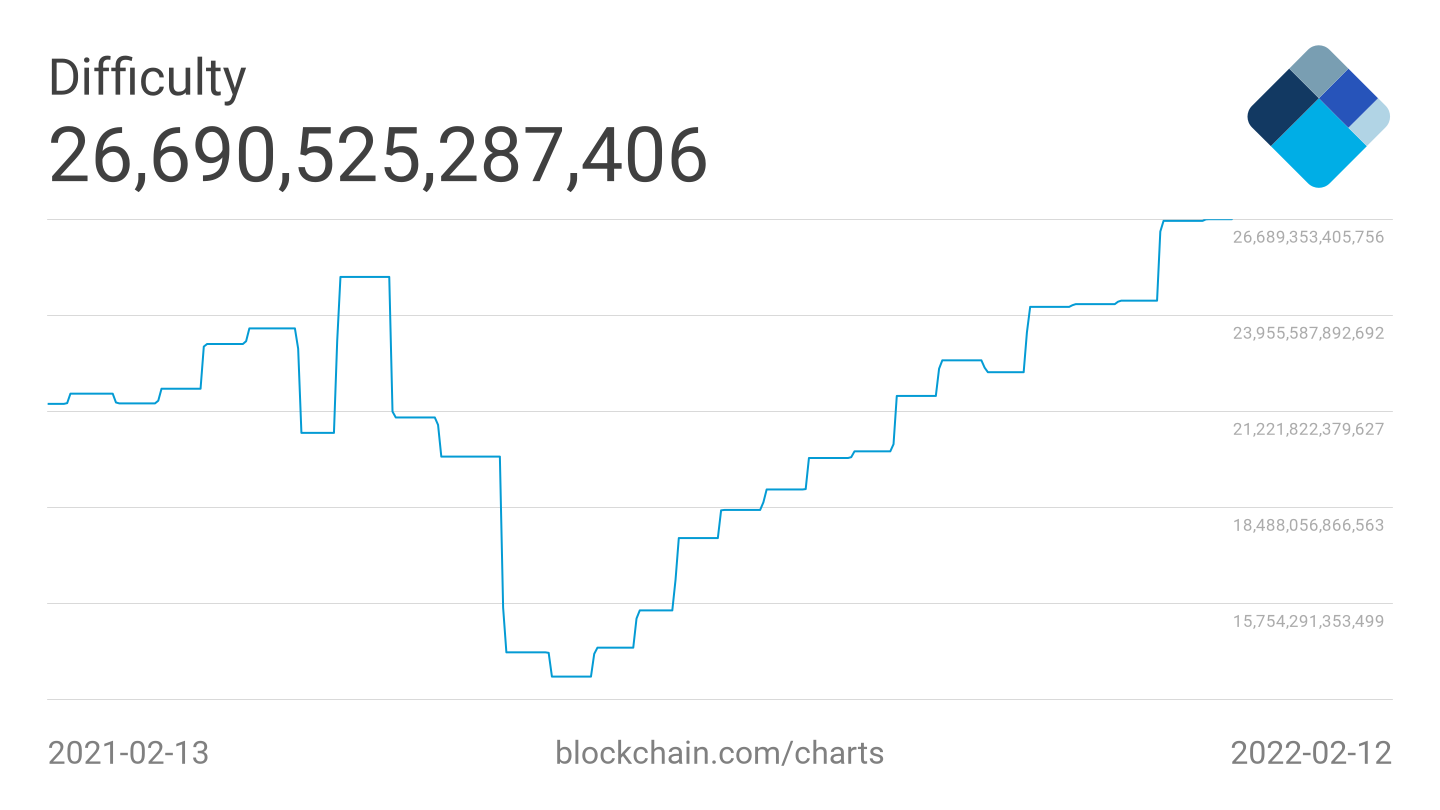
Bitcoin difficulty chart. Source: Blockchain
Keep on hodlin'
There is a firm sense of conviction among Bitcoin hodlers, and while this is common knowledge, the extent of their resolve is becoming clearer than ever.
As noted by the popular Twitter account known as PlanC, wallets thought to belong to long-term hodlers are increasing dramatically — and recent price action has only helped the trend.
Citing Glassnode data, PlanC noted that those entities, defined as wallets with a least two significant incoming transactions and zero outgoing transactions, have now hit an almost five-year high.
The last days of January appear to have been particularly attractive to those seeking a position as BTC/USD returned to $40,000 after a two-week absence.
The data excludes exchange addresses and those over seven years old to reduce the likelihood of the target wallets containing "lost" BTC that the owner is no longer able to access.
Author

Cointelegraph Team
Cointelegraph
We are privileged enough to work with the best and brightest in Bitcoin.


