Unsure about buying the dip? This key trading indicator makes it easier

Knowing how to spot market reversals and when to buy the dip is nearly impossible, but the RSI indicator can help.
When an asset enters a bear phase and the headlines are negative, analysts project further downside, and the sentiment shifts from optimism to pure gloom and doom. This results in panic gripped traders dumping their positions near the bottom of the downtrend instead of buying.
How can traders go against the herd and build the courage to buy in a bear market? It is not easy because if they purchase too early, the position may quickly turn into a loss. However, if they wait for too long, they may miss the early part of the rally.
Although pulling the trigger during a bear phase is difficult, the relative strength index (RSI) indicator can identify market bottoms and favorable risk to reward scenarios.
Let’s review a few examples of when to buy in a bear market.
Look for extremely oversold levels on the RSI
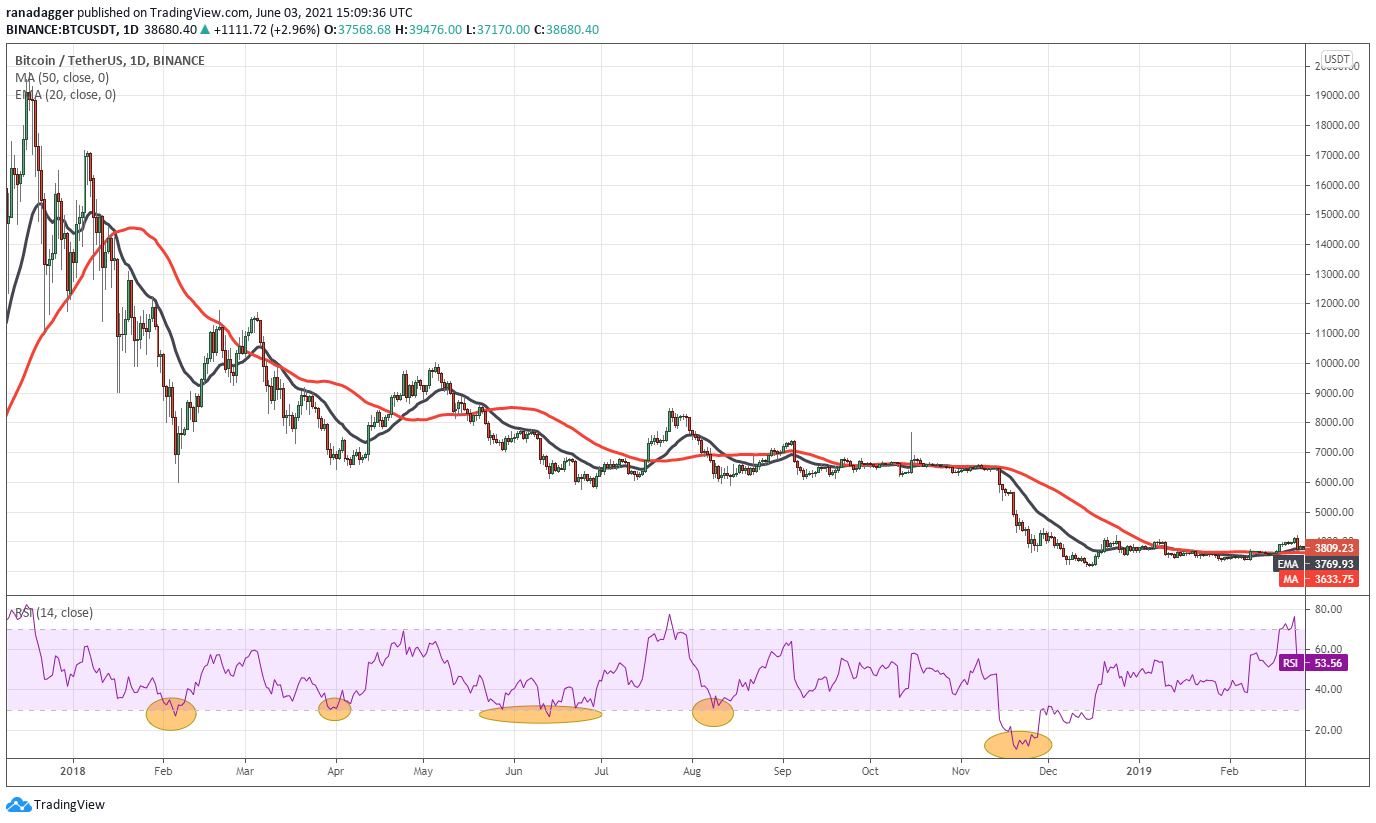
BTC/USDT daily chart. Source: TradingView
Bitcoin (BTC) topped out close to $20,000 in December 2017 and started a long gut-wrenching bear market that bottomed out near $3,300 in December 2018. During this period, the RSI entered the oversold territory (a reading below 30) on five occasions (marked as ellipses on the chart).
In the first four instances, the RSI dipped close to or just below the 30 level but during the fifth time, the RSI dropped to 10.50. This is a sign of capitulation where traders who had been buying pre-empting a bottom or had held their positions in the bear market succumbed to fear and purged their holdings.
Usually, long bear markets end after prolonged periods of fear-based selling. Smart traders wait for these opportunities and buy when the markets are deeply oversold, like when the RSI below 20.
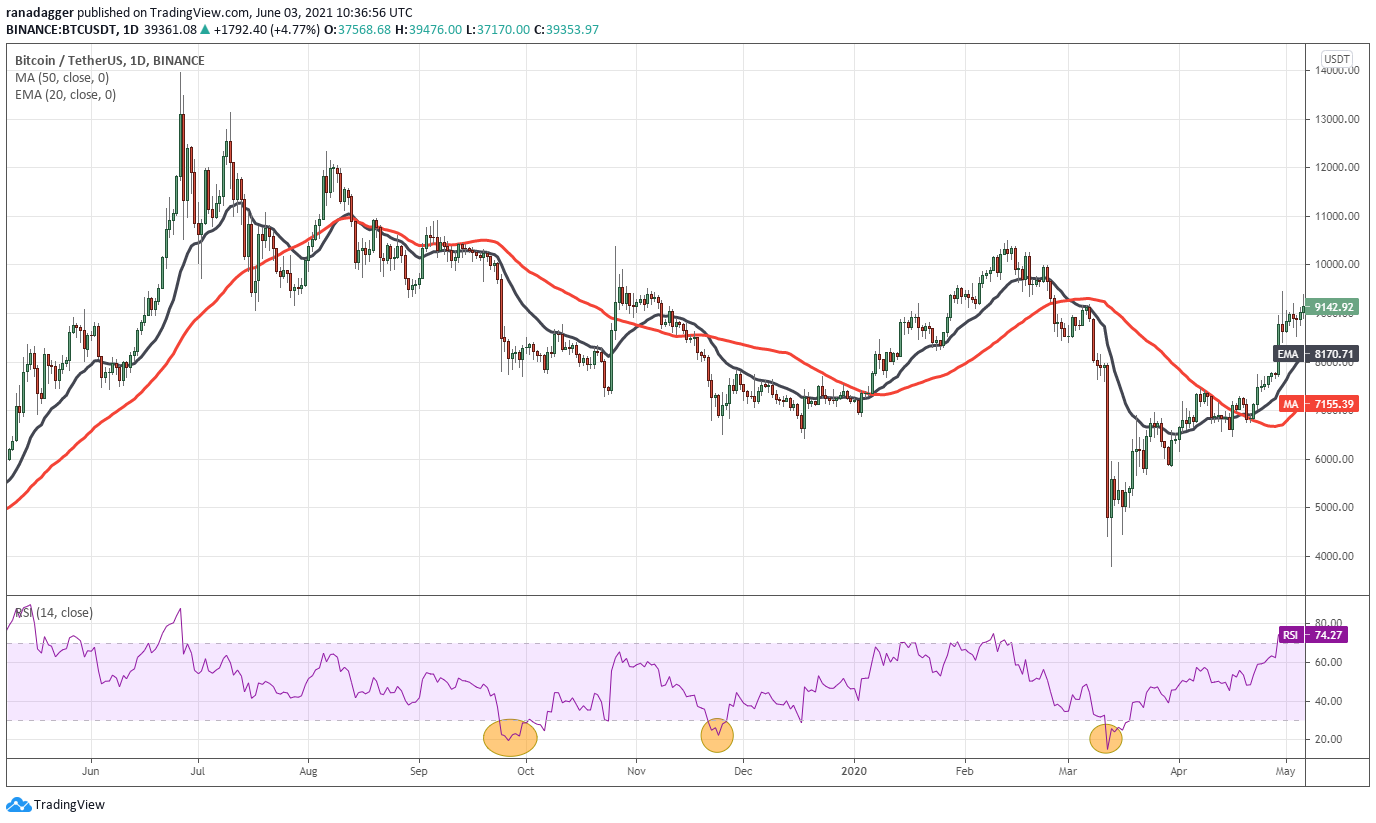
BTC/USDT daily chart. Source: TradingView
Fast forward to 2019 and 2020 when the RSI dipped close to 20 on two occasions and dropped to 15.04 on March 12, 2020.
The first instance when the pair dropped to 19.60 on Sep. 26, 2019, turned out to be a losing trade because the price made a new local low weeks later on Oct. 23, 2019. This shows that traders should be ready to close their positions when the stops hit because if they don’t do that, the losses may keep growing.
On Nov. 24, 2019, the RSI dropped to 22.32, just above the 20 level. For traders who keep a very tight stop, this would have also turned out to be a losing trade with the drop on Dec. 18, 2019. However, these were all small losses, which would not make a dent to the portfolio unless traders were using heavy leverage.
The RSI plunged to 15.04 on March 12, 2020, and traders who were brave enough to buy after this drop would have made outsized gains had they held onto their positions during the bull phase, which topped out at $64,854 on April 14, 2021. This shows how after two losing purchases, traders eventually hit the jackpot using the RSI signal.
Combining the RSI with moving averages produces a better signal
During Ether’s (ETH) bear phase in 2018, there were four instances when the RSI dipped below or came close to the 20 level. The first opportunity offered a strong return to traders but the other two instances turned out to be losers.
To avoid whipsaws, traders may add extra filters to keep them out of losing trades. One simple example could be that instead of buying just after the RSI drops below 20, traders may wait for the price to close above the 20-day exponential moving average for three successive days before purchasing.
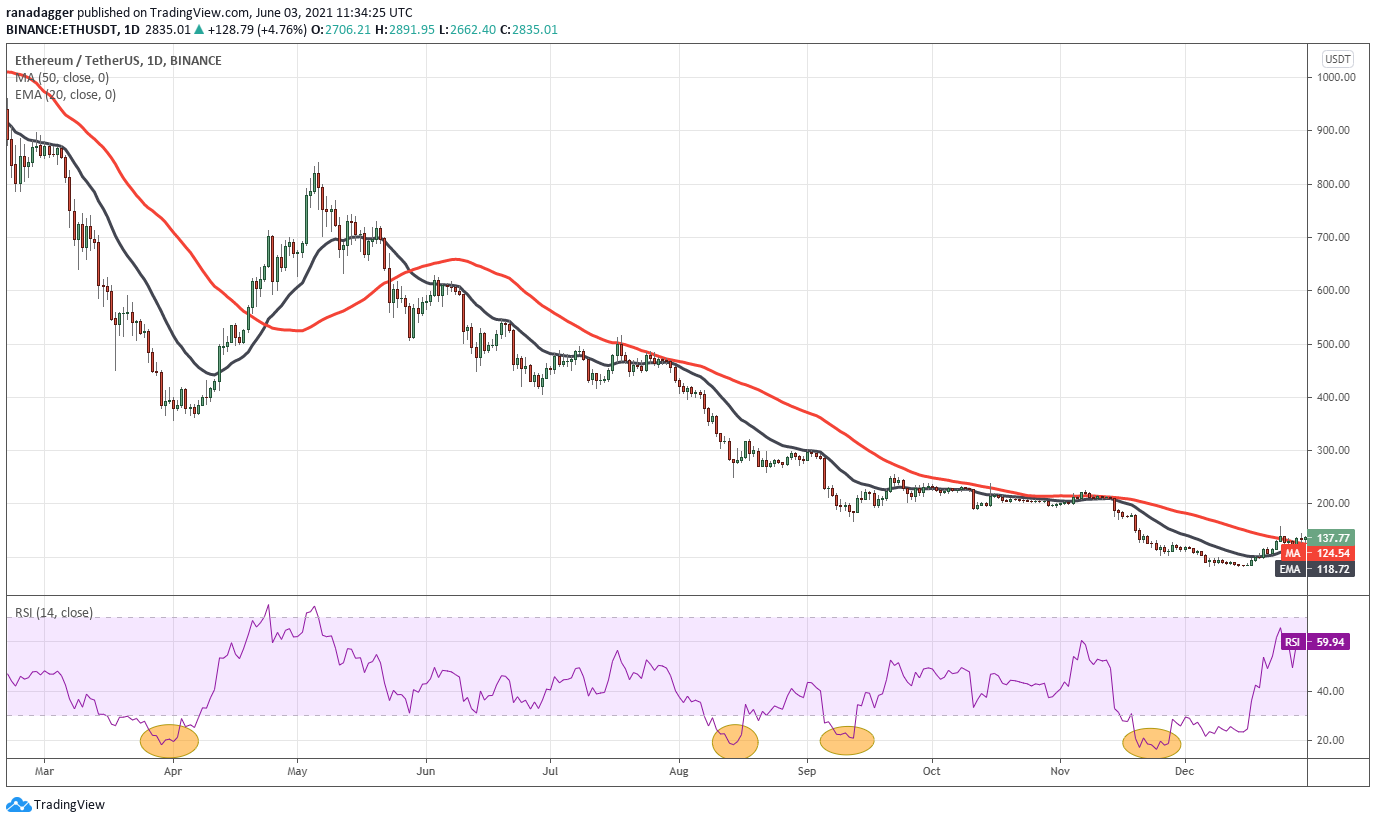
ETH/USDT daily chart. Source: TradingView
As seen in the chart above, the signal to buy in April 2018 triggered as the ETH/USDT pair rose above the 20-day EMA after dropping below the 20 level on the RSI. This trade turned out to be profitable as the pair witnessed a sharp up-move.
The next buy signal in August did not meet the criteria because the price did not rise above the 20-day EMA for three consecutive days. The third trade in September would have turned into a minor loss but the one in November would have made a huge profit.
Bullish divergences and how to spot them
Another important tool that can help warn traders of a possible trend reversal is a bullish divergence. This happens when the price continues to fall but the RSI makes higher lows, indicating the bearish momentum could be weakening.
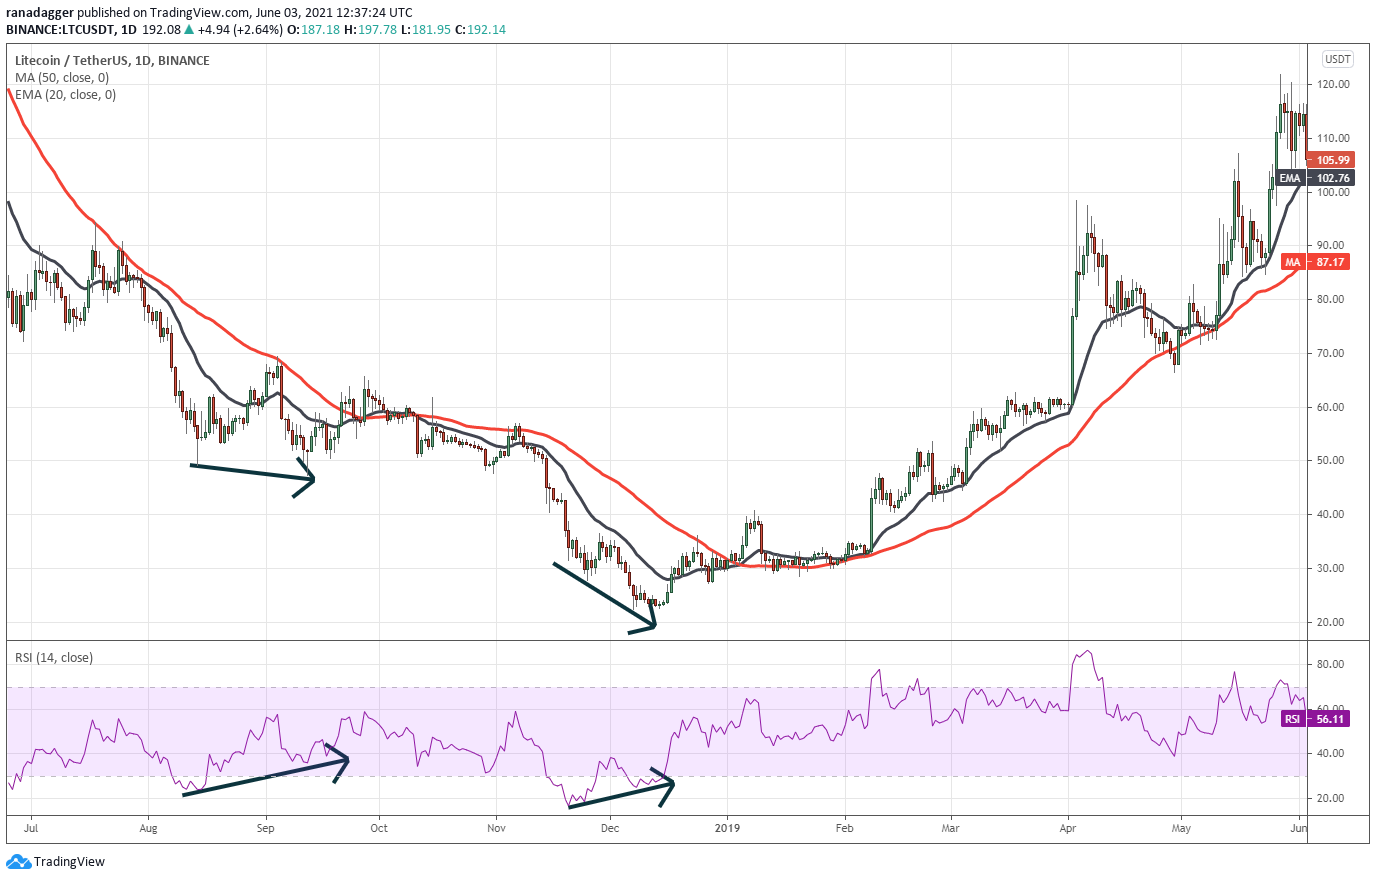
LTC/USDT daily chart. Source: TradingView
Litecoin (LTC) shows the formation of two bullish divergences during the 2018 bear phase. The first divergence that formed from August to September of 2018 turned out to be a false signal because the price did not rise above the swing high.
However, the second bullish divergence from November to December of 2018 turned out to be a profitable signal right at the bottom, which was followed by a sharp rise within the next few days.
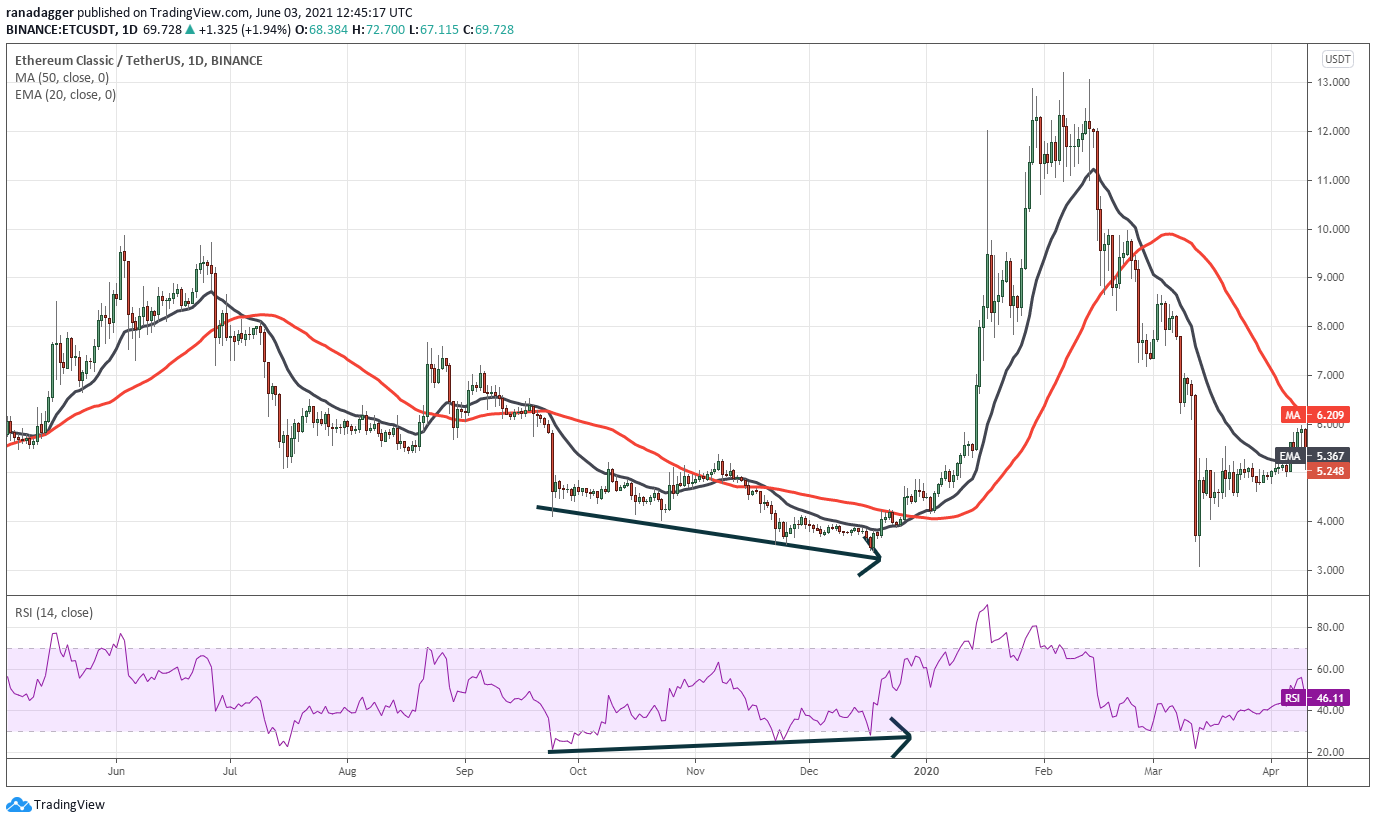
ETC/USDT daily chart. Source: TradingView
Another example of a slightly longer bullish divergence can be seen in Ethereum Classic (ETC) from September to December 2019. During the period, the price made lower lows but the RSI formed higher lows. The ETC/USDT pair surged in the next few days after it broke above the swing high.
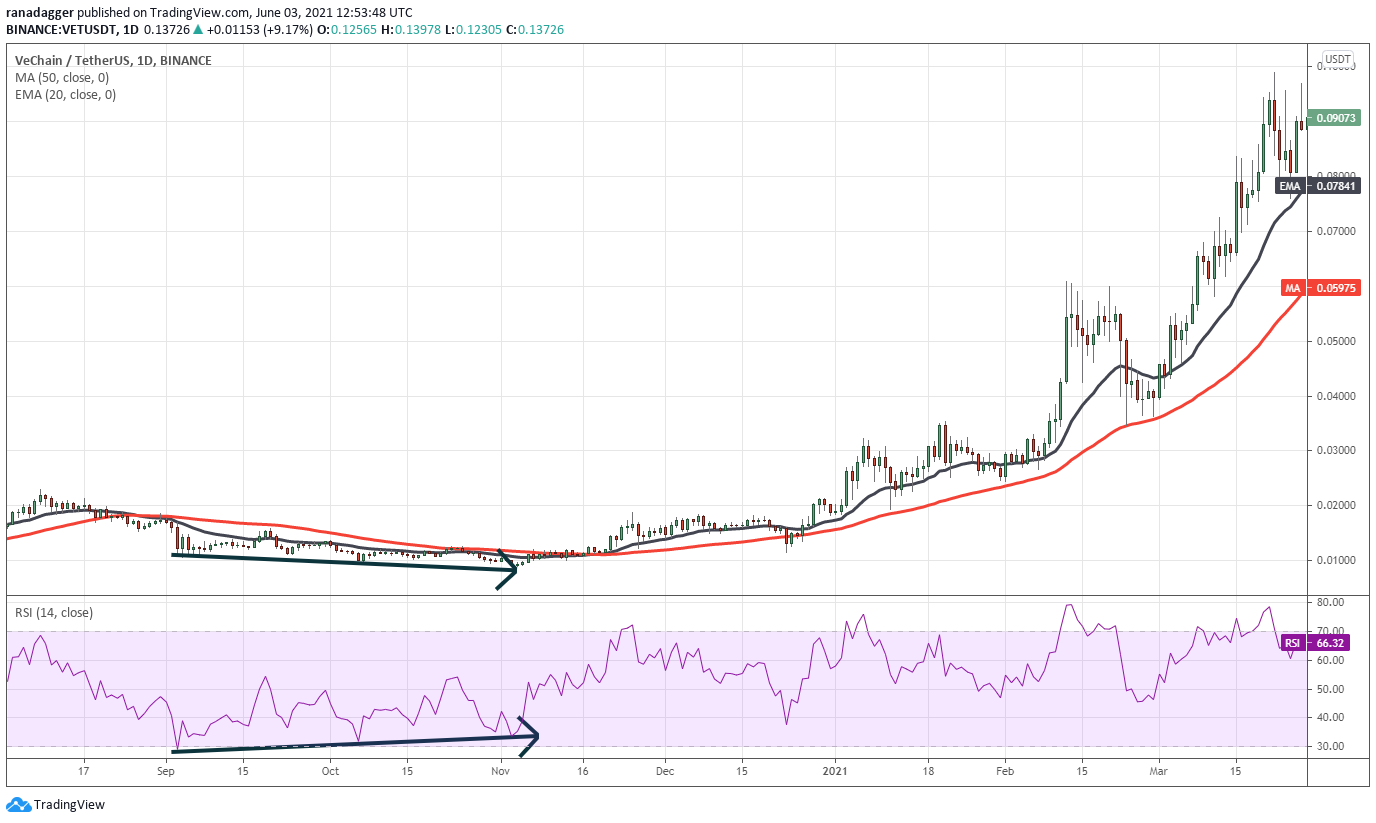
VET/USDT daily chart. Source: TradingView
VeChain (VET) also showed the formation of a bullish divergence from September 2020 to October 2020, which was followed by a huge bull run. This shows the bullish divergence is a useful tool, which if used wisely can benefit the traders immensely.
Some important takeaways
Bear markets offer the opportunity to buy an asset at a significant discount but it is not easy to purchase when everyone is selling and the sentiment is negative.
However, traders who use the RSI can develop an edge. An extremely oversold reading on the RSI is a sign of capitulation, which generally marks the end of a bear phase. This strategy can help traders pull the trigger when it matters.
Sometimes, the RSI may give false signals, hence, traders can use additional filters like daily closes above the 20- and 50-day moving average to avoid whipsaw trades. Spotting bullish divergences can also alert traders that a downtrend may be ending.
Author

Cointelegraph Team
Cointelegraph
We are privileged enough to work with the best and brightest in Bitcoin.


