![]() Lorenzo Stroe
Lorenzo Stroe
Independent Analyst
- Uniswap price has outperformed most cryptocurrencies and has been leading the DeFi industry.
- The digital asset hit a new all-time high at $15.75 on January 29.
- On-chain metrics are extremely positive for Uniswap and have pushed its price higher.
Uniswap had one of the best performances in 2021 rising by 237% to new highs almost every single day. The digital asset has reached rank 15th on Coinmarketcap with a market capitalization of $4.1 billion.
Uniswap leads the way as other DeFi projects follow the decentralized exchange
Despite Bitcoin hitting a new all-time high at $42,000, Ethereum had a lot of trouble establishing a new all-time high and has been trading sideways for the past week. On the other hand, Uniswap and other decentralized exchanges have had a lot of success in 202.
Back in September 2020, Uniswap users received an airdrop of 400 UNI per user. The governance token had a massive sell-off during the first few weeks. However, surprisingly, the digital asset managed to recover and establish new highs.
Just recently, we have seen a lot of drama with GameStop and the need for decentralized exchanges as one of the biggest trading platforms, Robinhood, halted trading of GME stocks to thousands of clients and also stopped the trading of cryptocurrencies temporarily.
Uniswap price could continue to rise higher as metrics remain positive
Uniswap has seen massive growth in the past week with 190% new addresses joining the network and more than 150% active addresses compared to the last week. This tremendous growth indicates that Uniswap’s rally is healthy.
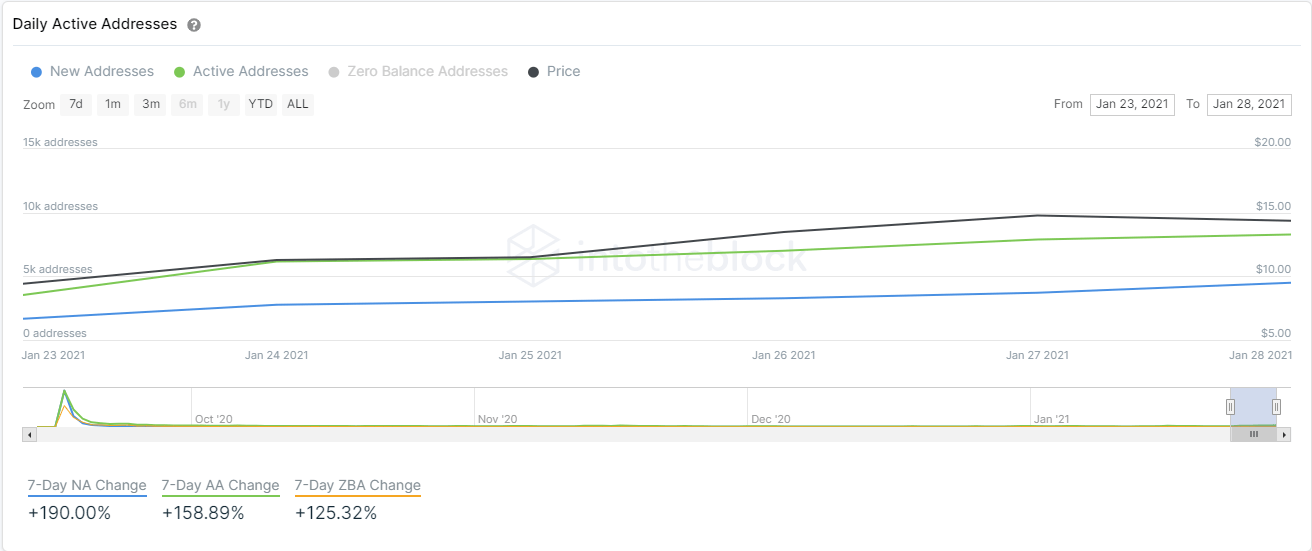
Uniswap new and active addresses chart
Since the beginning of 2021, around 31 new large holders have joined the network. They hold between 100,000 and 1,000,000 coins. Similarly, the number of whales with 1,000,000 to 10,000,000 coins also increased by six.
%20[16.58.31,%2029%20Jan,%202021]-637475330612575105.png)
UNI Holders Distribution chart
Additionally, the liquidity provided on Uniswap has exploded from $2.17 billion in January 2021 to a new all-time high of $3.59 billion currently. Of course, this also increased the fees received by the exchange as well as the volume peaking on January 11, at $1.33 billion with $3.99 million in fees. It seems that Uniswap price could continue its massive rally towards $20 without much opposition.
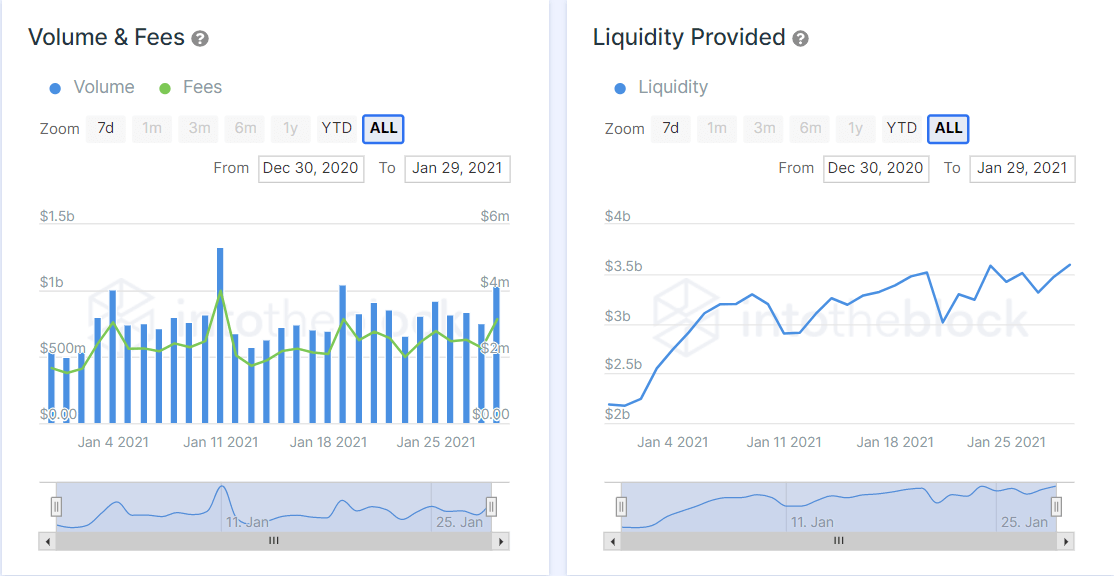
Uniswap statistics
However, on the 1-hour chart, Uniswap has established a symmetrical triangle pattern which could be close to a breakdown. Losing the support level at $14.3 could quickly push Uniswap price towards $12.
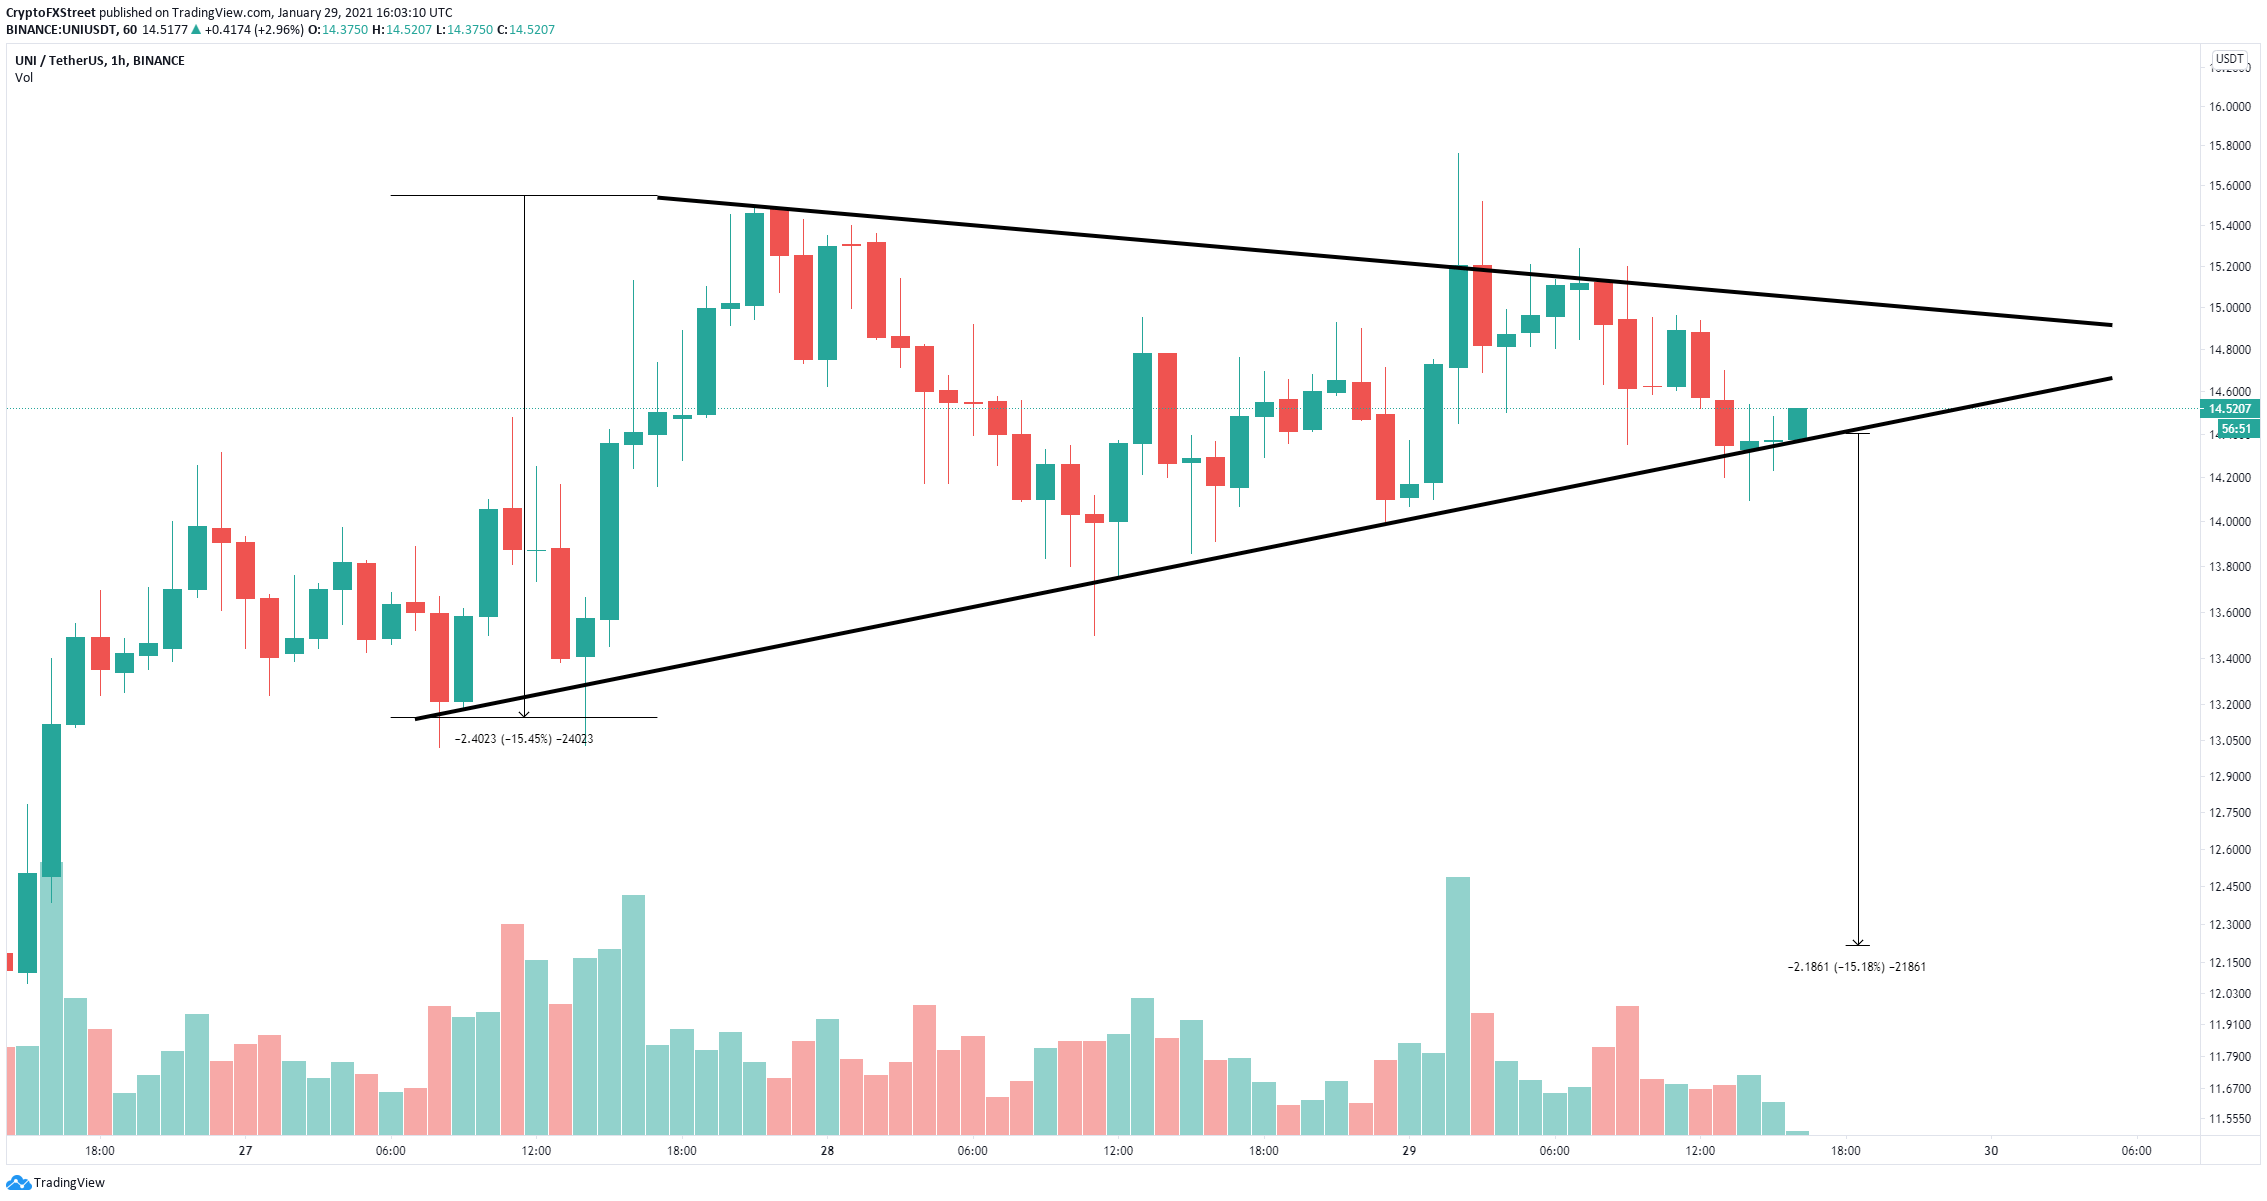
UNI/USD 1-hour chart
The digital asset seems on the verge of a big move as its trading volume has been declining significantly. Uniswap current price of $14.5 is closer to a breakdown.
Note: All information on this page is subject to change. The use of this website constitutes acceptance of our user agreement. Please read our privacy policy and legal disclaimer. Opinions expressed at FXstreet.com are those of the individual authors and do not necessarily represent the opinion of FXstreet.com or its management. Risk Disclosure: Trading foreign exchange on margin carries a high level of risk, and may not be suitable for all investors. The high degree of leverage can work against you as well as for you. Before deciding to invest in foreign exchange you should carefully consider your investment objectives, level of experience, and risk appetite. The possibility exists that you could sustain a loss of some or all of your initial investment and therefore you should not invest money that you cannot afford to lose. You should be aware of all the risks associated with foreign exchange trading, and seek advice from an independent financial advisor if you have any doubts.
Recommended Content
Editors’ Picks

Litecoin Price Prediction: LTC tries to retake $100 resistance as miners halt sell-off
Litecoin price grazed 105 mark on Monday, rebounding 22% from the one-month low of $87 recorded during last week’s market crash. On-chain data shows sell pressure among LTC miners has subsided. Is the bottom in?

Bitcoin fails to recover as Metaplanet buys the dip
Bitcoin price struggles around $95,000 after erasing gains from Friday’s relief rally over the weekend. Bitcoin’s weekly price chart posts the first major decline since President-elect Donald Trump’s win in November.
SEC Commissioner Hester Pierce sheds light on Ethereum ETF staking under new administration
In a Friday interview with Coinage, SEC Commissioner Hester Peirce discussed her optimism about upcoming regulatory changes as the agency transitions to new leadership under President Trump’s pick for new Chair, Paul Atkins.

Bitcoin dives 3% from its recent all-time high, is this the cycle top?
Bitcoin investors panicked after the Fed's hawkish rate cut decision, hitting the market with high selling pressure. Bitcoin's four-year market cycle pattern indicates that the recent correction could be temporary.
Bitcoin: 2025 outlook brightens on expectations of US pro-crypto policy
Bitcoin price has surged more than 140% in 2024, reaching the $100K milestone in early December. The rally was driven by the launch of Bitcoin Spot ETFs in January and the reduced supply following the fourth halving event in April.

Best Forex Brokers with Low Spreads
VERIFIED Low spreads are crucial for reducing trading costs. Explore top Forex brokers offering competitive spreads and high leverage. Compare options for EUR/USD, GBP/USD, USD/JPY, and Gold.