![]() Lorenzo Stroe
Lorenzo Stroe
Independent Analyst
- UNI is currently trading at $3.17, trying to recover from the extended pullback to $2.47.
- The bulls are taking control of the short-term timeframes and are eying up $4.
Uniswap started trading as high as $7 on its first day but quickly fell off due to the intense selling pressure. The digital asset reached a $700 million market capitalization on September 18. Despite the downtrend, the market cap has increased again to $641 million due to more circulating supply.
UNI bulls eying up $4 in the short-term
Uniswap has been trading between $2.4 and $3.7 for around two weeks now. It seems that investors aren't sure in which direction the digital asset is going next. UNI's price has established a higher low at $2.88 compared to the low of $2.47, a positive step for the bulls.
UNI/USDT 4-hour chart
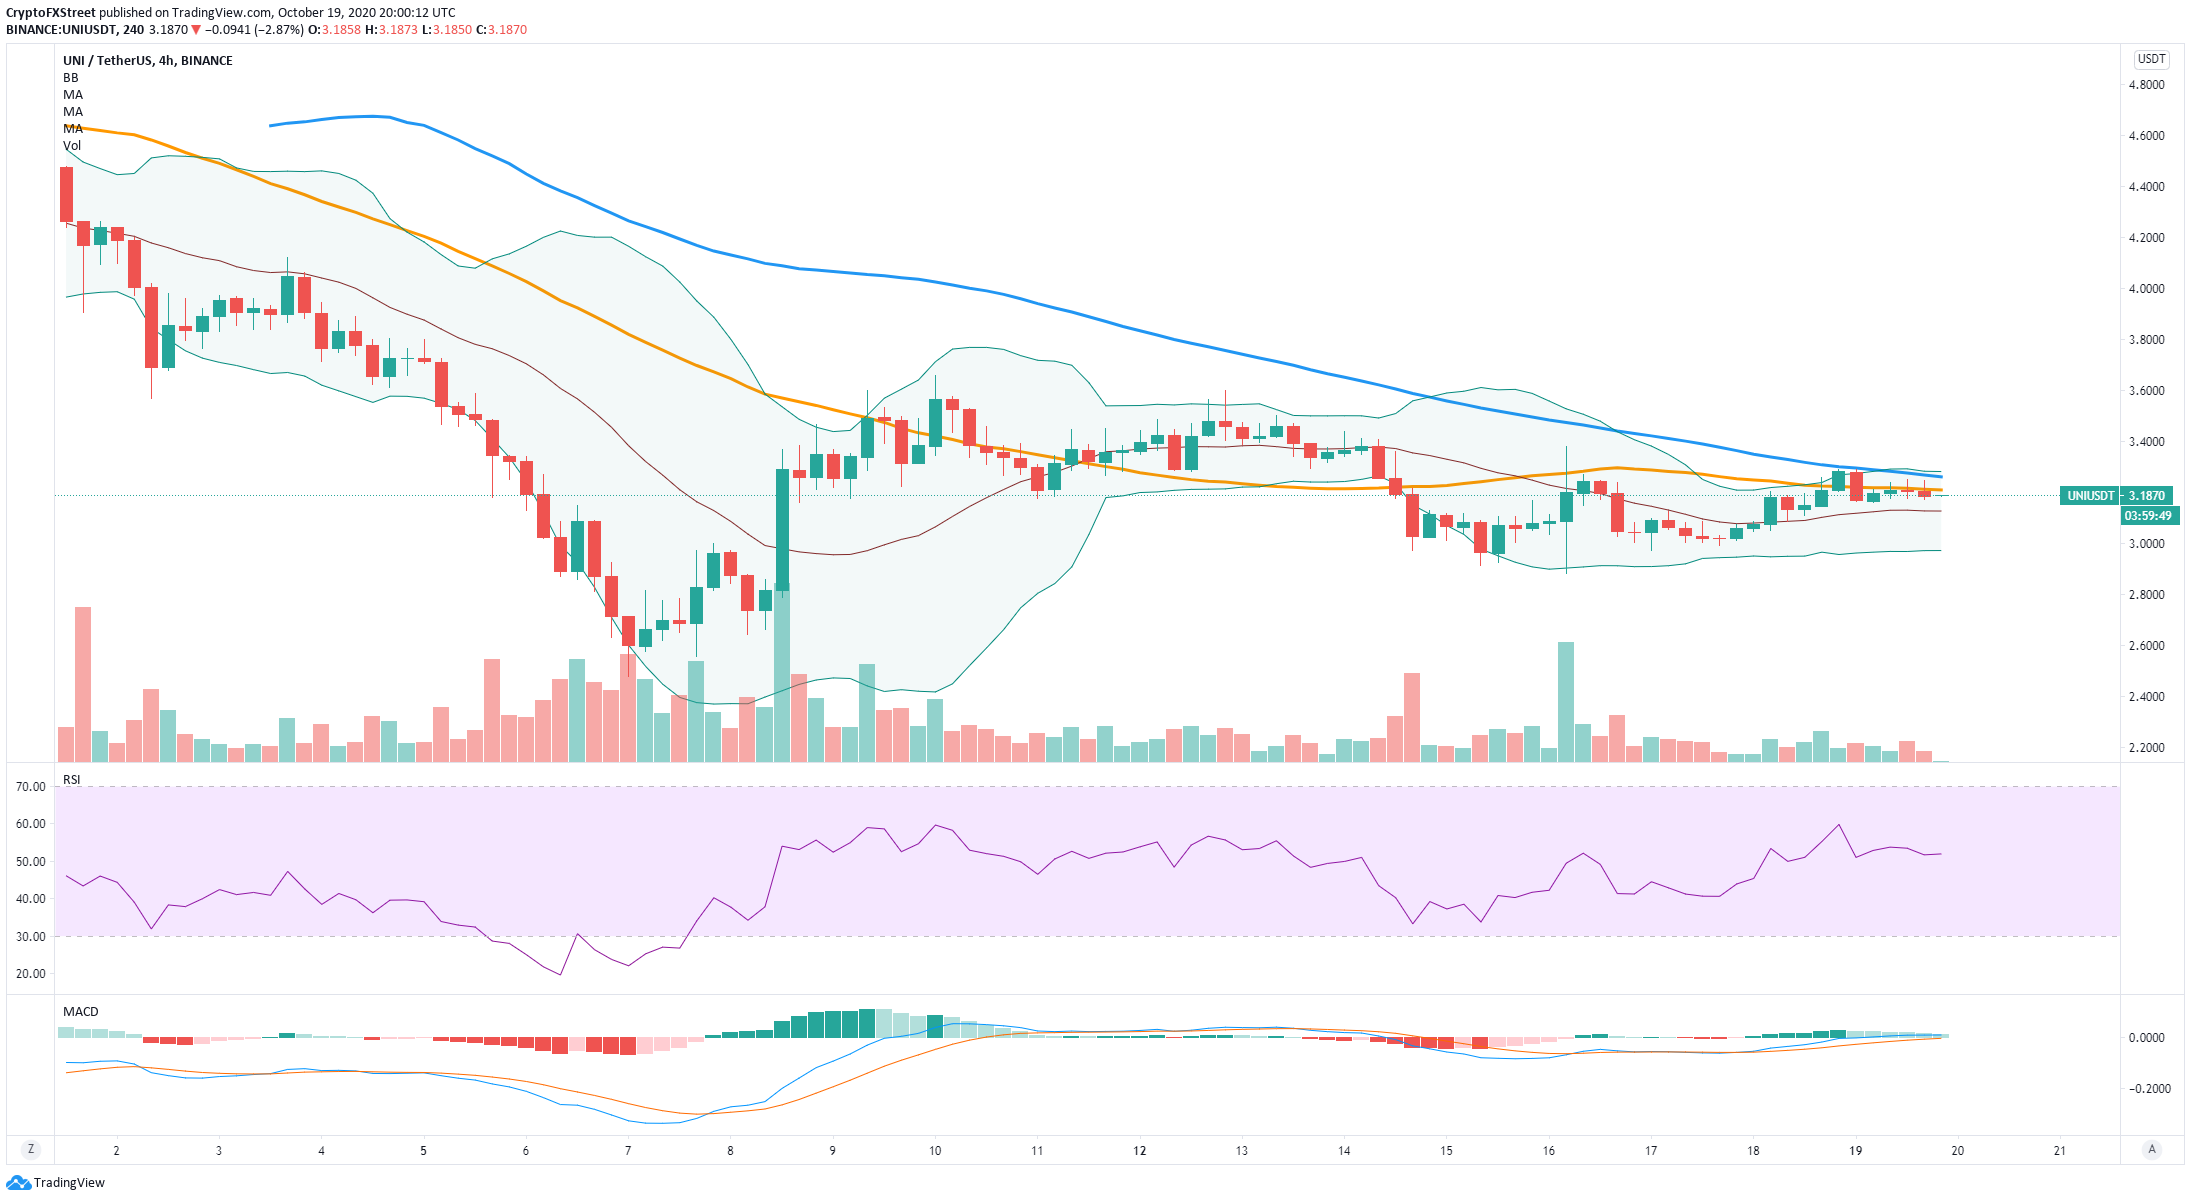
On the 4-hour chart, UNI has formed several higher lows and higher highs, confirming an uptrend. The next hurdle on the way up is the 50-SMA at $3.2, followed by the 100-SMA at $3.3. The Bollinger Bands are also squeezing again, indicating that a potential significant move is underway.
UNI's trading volume is also declining, another primary indicator that a spike in the price is nearby. A breakout above $3.2 and $3.3 can easily push the digital asset up to the last daily high of $3.65 and potentially to the psychological level at $4 as there is very little resistance to the upside.
UNI IOMAP Chart
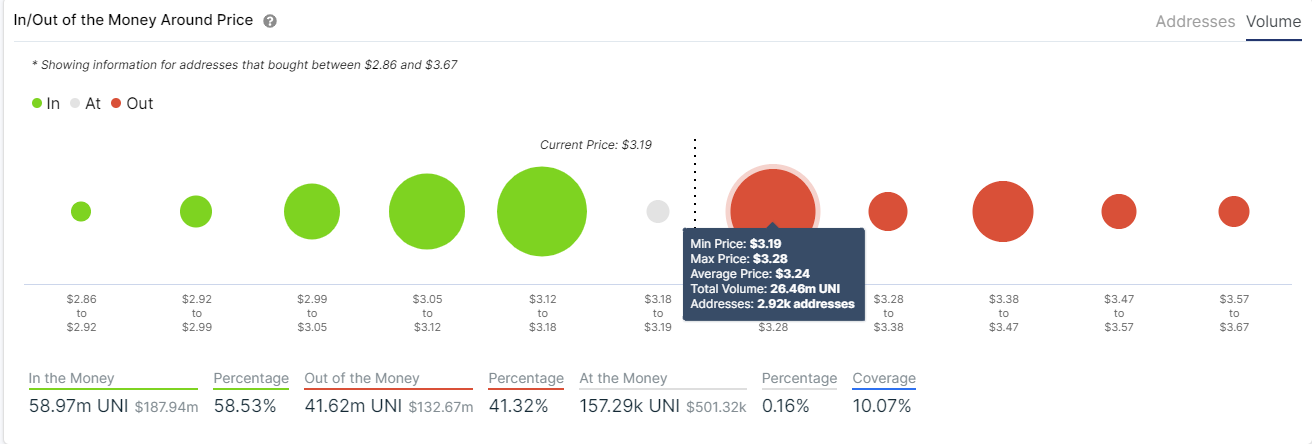
The In/Out of the Money Around Price chart seems to confirm this theory showing a substantial resistance area between $3.19 and $3.28, where 26 million UNI tokens were bought. In comparison, the support of UNI until $2.99 is far stronger than the resistance above.
UNI/USDT daily chart
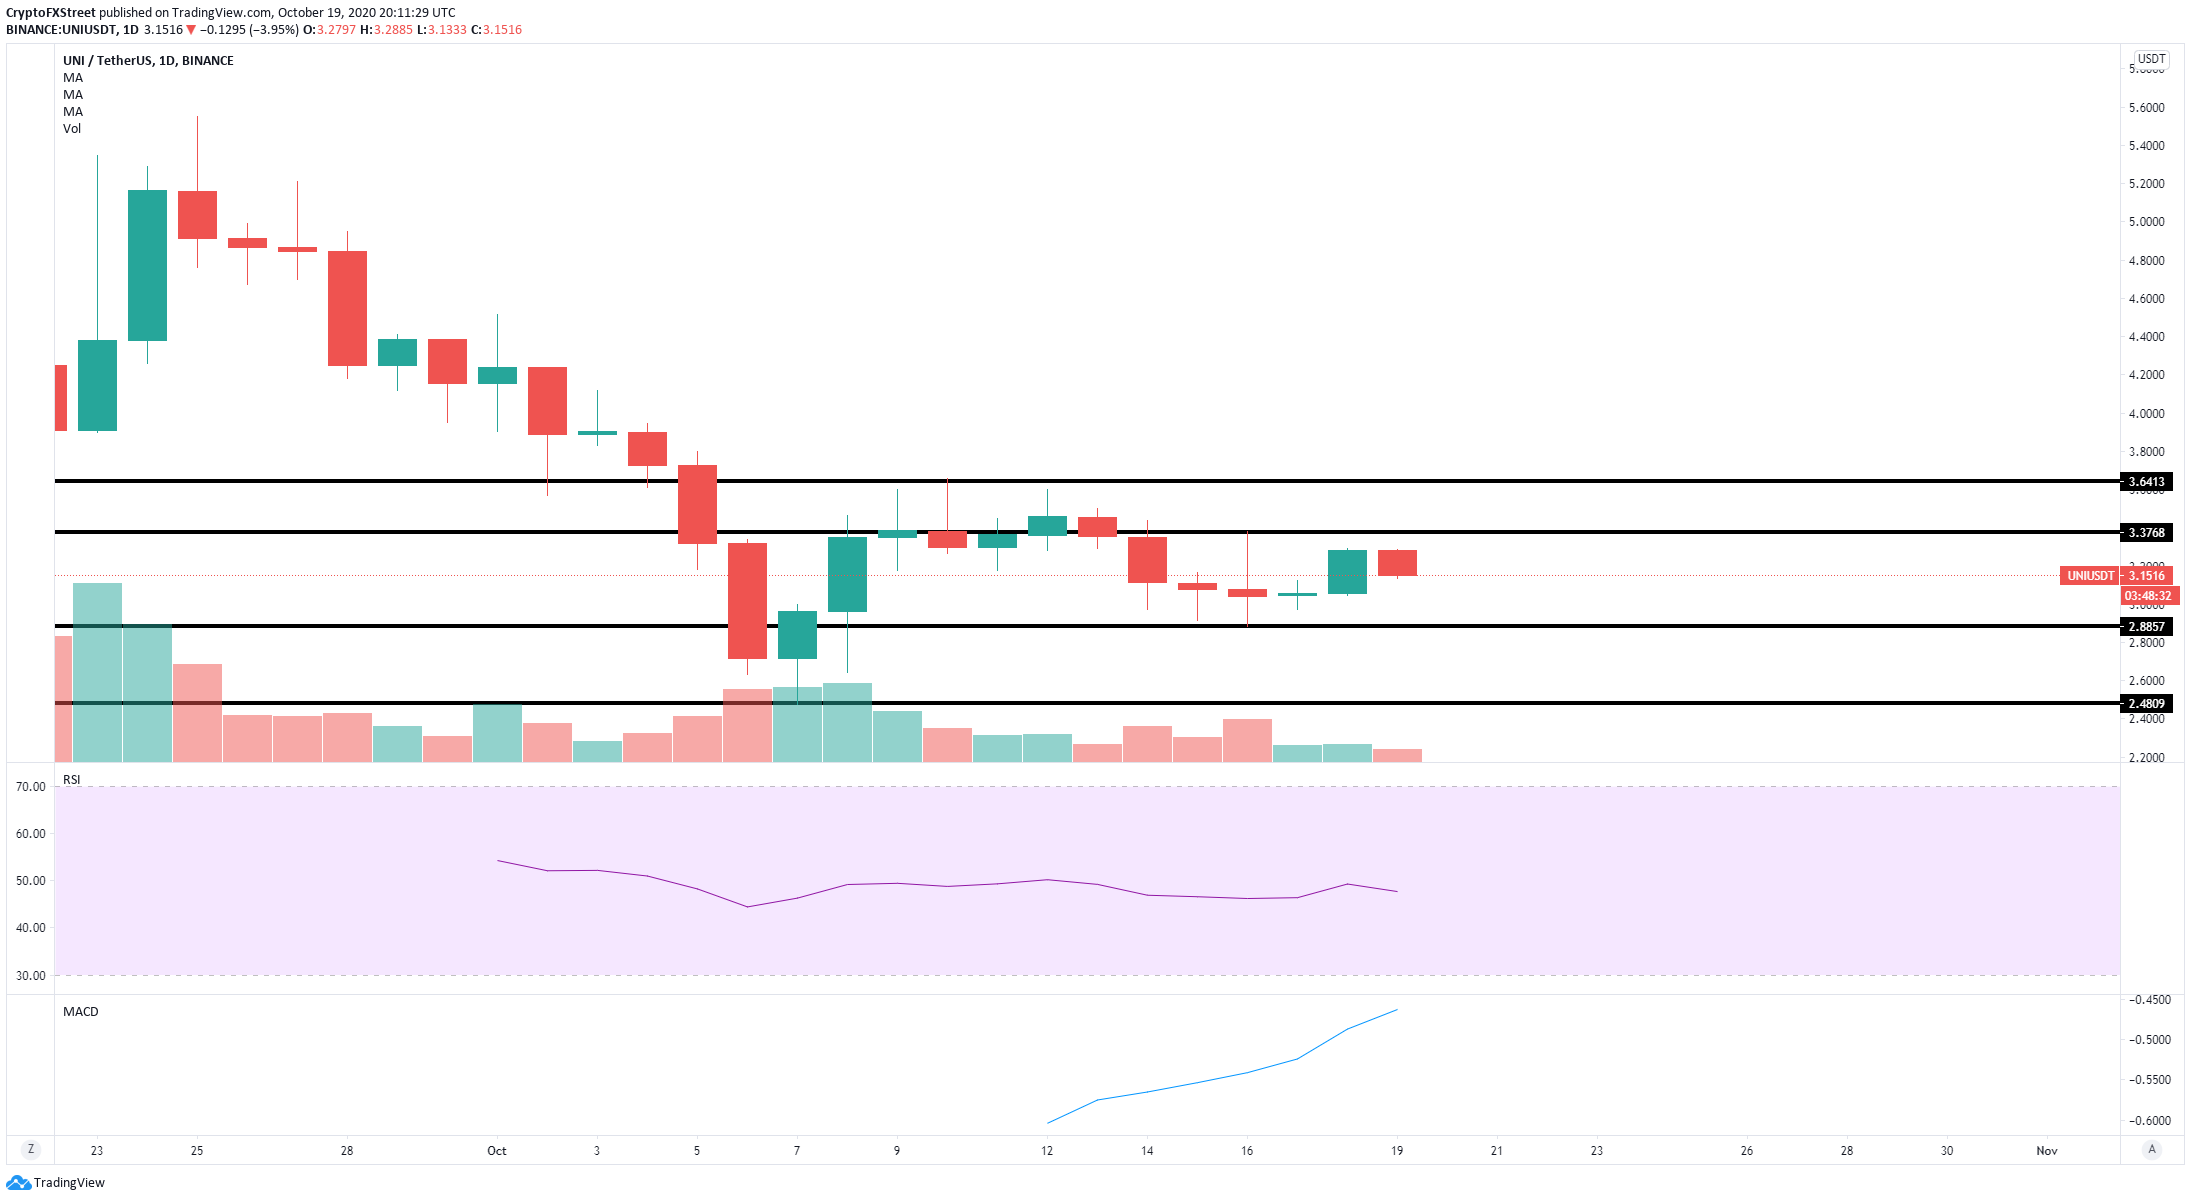
The daily chart seems to be forming an equilibrium pattern with a lower high and a higher low. This also supports the theory that UNI is close to a considerable breakout; however, bears are the favorite here considering the extended downtrend on the daily chart.
UNI New Addresses Chart
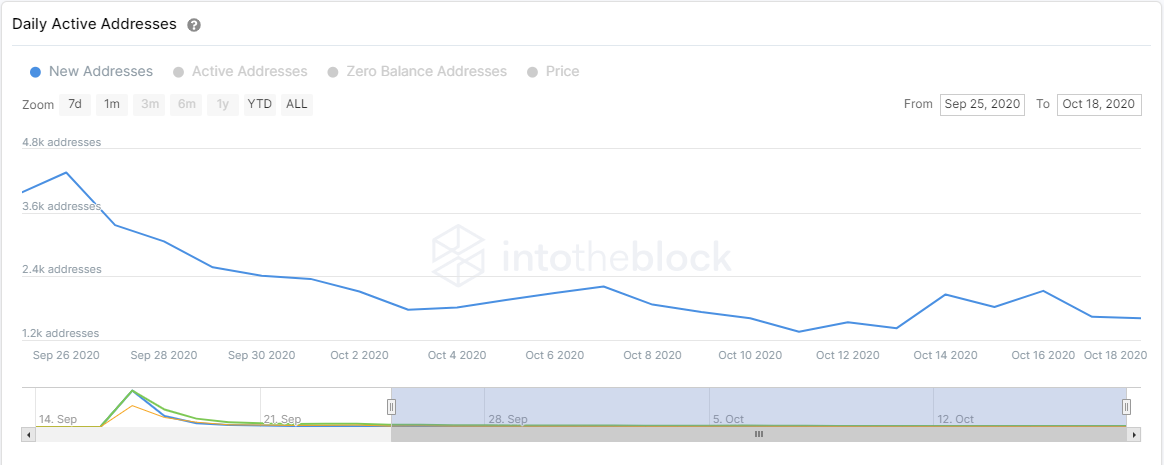
Despite a small increase on October 14, the number of new UNI addresses joining the network has been in a downtrend since September 15. The price of the digital asset is up 3% in the past two days; however, the number of new addresses is down. A bearish breakout below $2.88 can easily send UNI towards $2.48 and then $2.
Key price points for UNI
We know the digital asset is close to a massive breakout. Bulls are eying up at least $3.65 if UNI can climb above $3.3. The digital asset could potentially go as high as $4 in the longer term as there is very little resistance above $3.3, according to the IOMAP chart.
On the bearish side, the daily equilibrium pattern seems to be favoring the sellers after quite a prolonged downtrend. A bearish breakout below the critical support level at $2.88 can drive UNI's price towards $2.48 and the psychological level at $2.
Note: All information on this page is subject to change. The use of this website constitutes acceptance of our user agreement. Please read our privacy policy and legal disclaimer. Opinions expressed at FXstreet.com are those of the individual authors and do not necessarily represent the opinion of FXstreet.com or its management. Risk Disclosure: Trading foreign exchange on margin carries a high level of risk, and may not be suitable for all investors. The high degree of leverage can work against you as well as for you. Before deciding to invest in foreign exchange you should carefully consider your investment objectives, level of experience, and risk appetite. The possibility exists that you could sustain a loss of some or all of your initial investment and therefore you should not invest money that you cannot afford to lose. You should be aware of all the risks associated with foreign exchange trading, and seek advice from an independent financial advisor if you have any doubts.
Recommended Content
Editors’ Picks

Bitcoin Weekly Forecast: BTC nosedives below $95,000 as spot ETFs record highest daily outflow since launch
Bitcoin price continues to edge down, trading below $95,000 on Friday after declining more than 9% this week. Bitcoin US spot ETFs recorded the highest single-day outflow on Thursday since their launch in January.

Bitcoin crashes to $96,000, altcoins bleed: Top trades for sidelined buyers
Bitcoin (BTC) slipped under the $100,000 milestone and touched the $96,000 level briefly on Friday, a sharp decline that has also hit hard prices of other altcoins and particularly meme coins.

Solana Price Forecast: SOL’s technical outlook and on-chain metrics hint at a double-digit correction
Solana (SOL) price trades in red below $194 on Friday after declining more than 13% this week. The recent downturn has led to $38 million in total liquidations, with over $33 million coming from long positions.

SEC approves Hashdex and Franklin Templeton's combined Bitcoin and Ethereum crypto index ETFs
The SEC approved Hashdex's proposal for a crypto index ETF. The ETF currently features Bitcoin and Ethereum, with possible additions in the future. The agency also approved Franklin Templeton's amendment to its Cboe BZX for a crypto index ETF.

Bitcoin: 2025 outlook brightens on expectations of US pro-crypto policy
Bitcoin (BTC) price has surged more than 140% in 2024, reaching the $100K milestone in early December. The rally was driven by the launch of Bitcoin Spot Exchange Traded Funds (ETFs) in January and the reduced supply following the fourth halving event in April.

Best Forex Brokers with Low Spreads
VERIFIED Low spreads are crucial for reducing trading costs. Explore top Forex brokers offering competitive spreads and high leverage. Compare options for EUR/USD, GBP/USD, USD/JPY, and Gold.