- Uniswap price is down 8% since the start of December and 87% since all-time highs.
- UNI could fall another 50% into a critical level if the crypto market heads further south.
- A breach above $6.23 is needed to consider aiming for bullish target zones.
Uniswap price continues to display congestive market behavior. Following eight months of rangebound trading, the UNI token will likely resolve the confusion with an explosive move.
Uniswap price could endure more pain
Uniswap price has been auctioning within a descending parallel channel since the spring of 2021. The declining trend has brought the Ethereum-based swap token's market value down by 87%. Still, the token sits firmly 1,600% above its October 21' launch price at $0.28. While many in the space are hoping for a bullish surge to resolve the endless downtrend, the technicals suggest UNI still has much more room to fall.
Uniswap price currently auctions at $5.19. A Fibonacci retracement tool surrounding the $0.28 low and the 2021 all-time high at $45 shows the current downtrend as just a 50% retracement. Investors should keep their eyes on the 50% Fib level at $4.64, as a piercing of the level would expand UNI's trading range to the downside.
The 61.8% Fib level, often referred to as the "Golden Pocket zone" for its high affinity of being breached following a bull run, lies at $2.43. UNI has yet to retest the magnetic zone following the 2021 bull run. A tag of the aforementioned level would result in a 50% decline from Uniswap's current price.
The 50-day, 100-day and 200-day simple moving averages (SMA) compound the bearish narrative as all three indicators are compressing above the current price action. Classical analysis traders would suggest UNI is in a confirmed downtrend based on the indicator's failure to provide support.
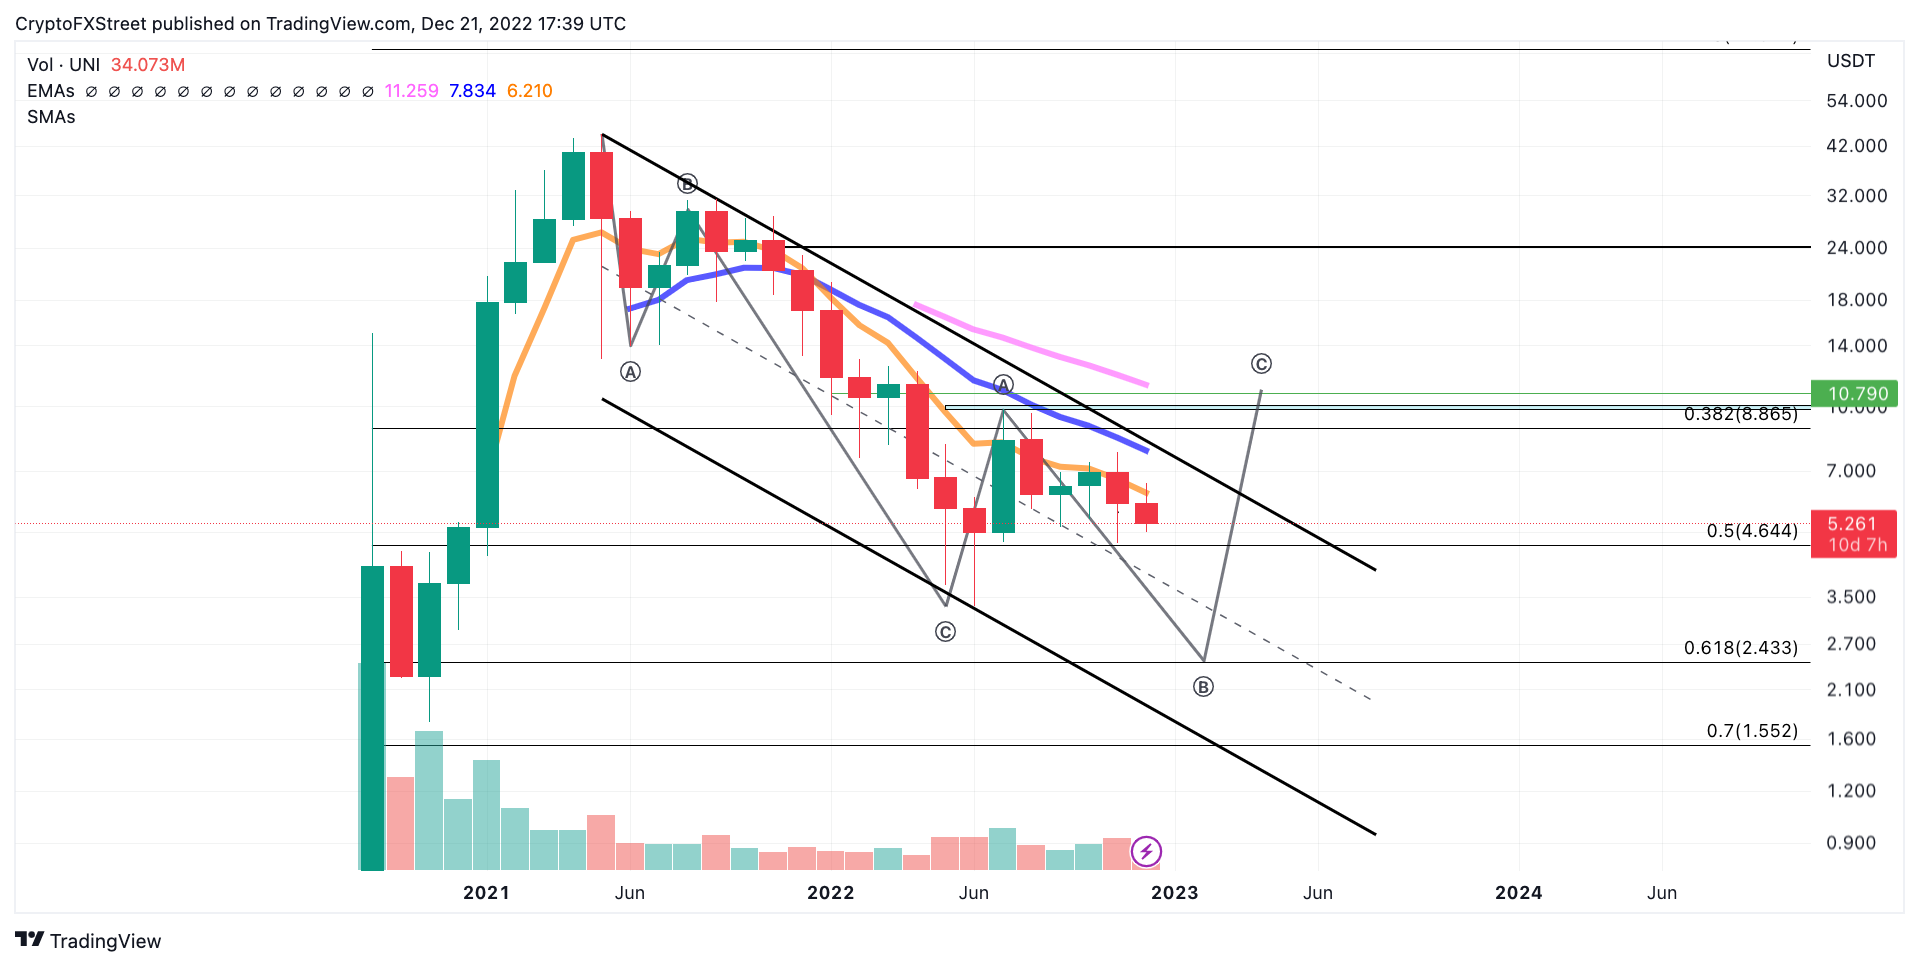
UNI/USDT 1-Month Chart
A hurdle above the 50-day SMA would create the ideal scenario for bulls to begin aiming for higher targets. The 50-day SMA rejected UNI's attempt to rally higher on December 13 and currently resides at 15% above the current price of $6.23. Reconquering the $6.23 zone would allow for a retracement into the 100-day SMA at $7.80. UNI would rise by 48% if the bullish scenario played out.
This video shows how Bitcoin price moves could affect UNI price
Information on these pages contains forward-looking statements that involve risks and uncertainties. Markets and instruments profiled on this page are for informational purposes only and should not in any way come across as a recommendation to buy or sell in these assets. You should do your own thorough research before making any investment decisions. FXStreet does not in any way guarantee that this information is free from mistakes, errors, or material misstatements. It also does not guarantee that this information is of a timely nature. Investing in Open Markets involves a great deal of risk, including the loss of all or a portion of your investment, as well as emotional distress. All risks, losses and costs associated with investing, including total loss of principal, are your responsibility. The views and opinions expressed in this article are those of the authors and do not necessarily reflect the official policy or position of FXStreet nor its advertisers. The author will not be held responsible for information that is found at the end of links posted on this page.
If not otherwise explicitly mentioned in the body of the article, at the time of writing, the author has no position in any stock mentioned in this article and no business relationship with any company mentioned. The author has not received compensation for writing this article, other than from FXStreet.
FXStreet and the author do not provide personalized recommendations. The author makes no representations as to the accuracy, completeness, or suitability of this information. FXStreet and the author will not be liable for any errors, omissions or any losses, injuries or damages arising from this information and its display or use. Errors and omissions excepted.
The author and FXStreet are not registered investment advisors and nothing in this article is intended to be investment advice.
Recommended Content
Editors’ Picks

Bitcoin Weekly Forecast: BTC nosedives below $95,000 as spot ETFs record highest daily outflow since launch
Bitcoin price continues to edge down, trading below $95,000 on Friday after declining more than 9% this week. Bitcoin US spot ETFs recorded the highest single-day outflow on Thursday since their launch in January.

Bitcoin crashes to $96,000, altcoins bleed: Top trades for sidelined buyers
Bitcoin (BTC) slipped under the $100,000 milestone and touched the $96,000 level briefly on Friday, a sharp decline that has also hit hard prices of other altcoins and particularly meme coins.

Solana Price Forecast: SOL’s technical outlook and on-chain metrics hint at a double-digit correction
Solana (SOL) price trades in red below $194 on Friday after declining more than 13% this week. The recent downturn has led to $38 million in total liquidations, with over $33 million coming from long positions.

SEC approves Hashdex and Franklin Templeton's combined Bitcoin and Ethereum crypto index ETFs
The SEC approved Hashdex's proposal for a crypto index ETF. The ETF currently features Bitcoin and Ethereum, with possible additions in the future. The agency also approved Franklin Templeton's amendment to its Cboe BZX for a crypto index ETF.

Bitcoin: 2025 outlook brightens on expectations of US pro-crypto policy
Bitcoin price has surged more than 140% in 2024, reaching the $100K milestone in early December. The rally was driven by the launch of Bitcoin Spot ETFs in January and the reduced supply following the fourth halving event in April.

Best Forex Brokers with Low Spreads
VERIFIED Low spreads are crucial for reducing trading costs. Explore top Forex brokers offering competitive spreads and high leverage. Compare options for EUR/USD, GBP/USD, USD/JPY, and Gold.