- Uniswap price is squeezed between the boundaries of an ascending triangle; a breakout signals a bullish move ahead.
- On-chain data shows a bullish bias as UNI’s Exchange Flow Balance is negative, and the exchange supply decreases.
- A daily candlestick close below $5.54 would invalidate the bullish thesis.
Uniswap (UNI) price trades inside an ascending triangle pattern; a breakout signals a rally ahead. This bullish move is further supported by UNI’s on-chain data, which shows a negative Exchange Flow Balance and decreasing exchange supply, hinting at a rally ahead.
Uniswap price looks set to resolve ascending triangle to the upside
Uniswap price has produced two higher lows and three roughly equal highs since August 2. Connecting these swing points using a trend line reveals an ascending triangle formation in the daily chart. This technical pattern has a bullish bias, and the target is generally obtained by measuring the distance between the first swing high and the first swing low to the breakout point. At the time of writing on Thursday, it trades 1.75% higher, inside the ascending triangle at $6.86.
Assuming the breakout happens by closing a daily candlestick above the weekly resistance at $7.06, adding the 35% measurement to the potential breakout level of $7.06 reveals a target of $9.38. Investors should be cautious of this theoretical move as it could face a slowdown at Uniswap’s daily resistance level of $8.19 and could book some profits at $8.19. However, since the Relative Strength Index (RSI) and Awesome Oscillator (AO) indicators on the daily chart are firmly above their respective neutral levels of 50 and zero, the possibility of a slowdown above is unlikely.
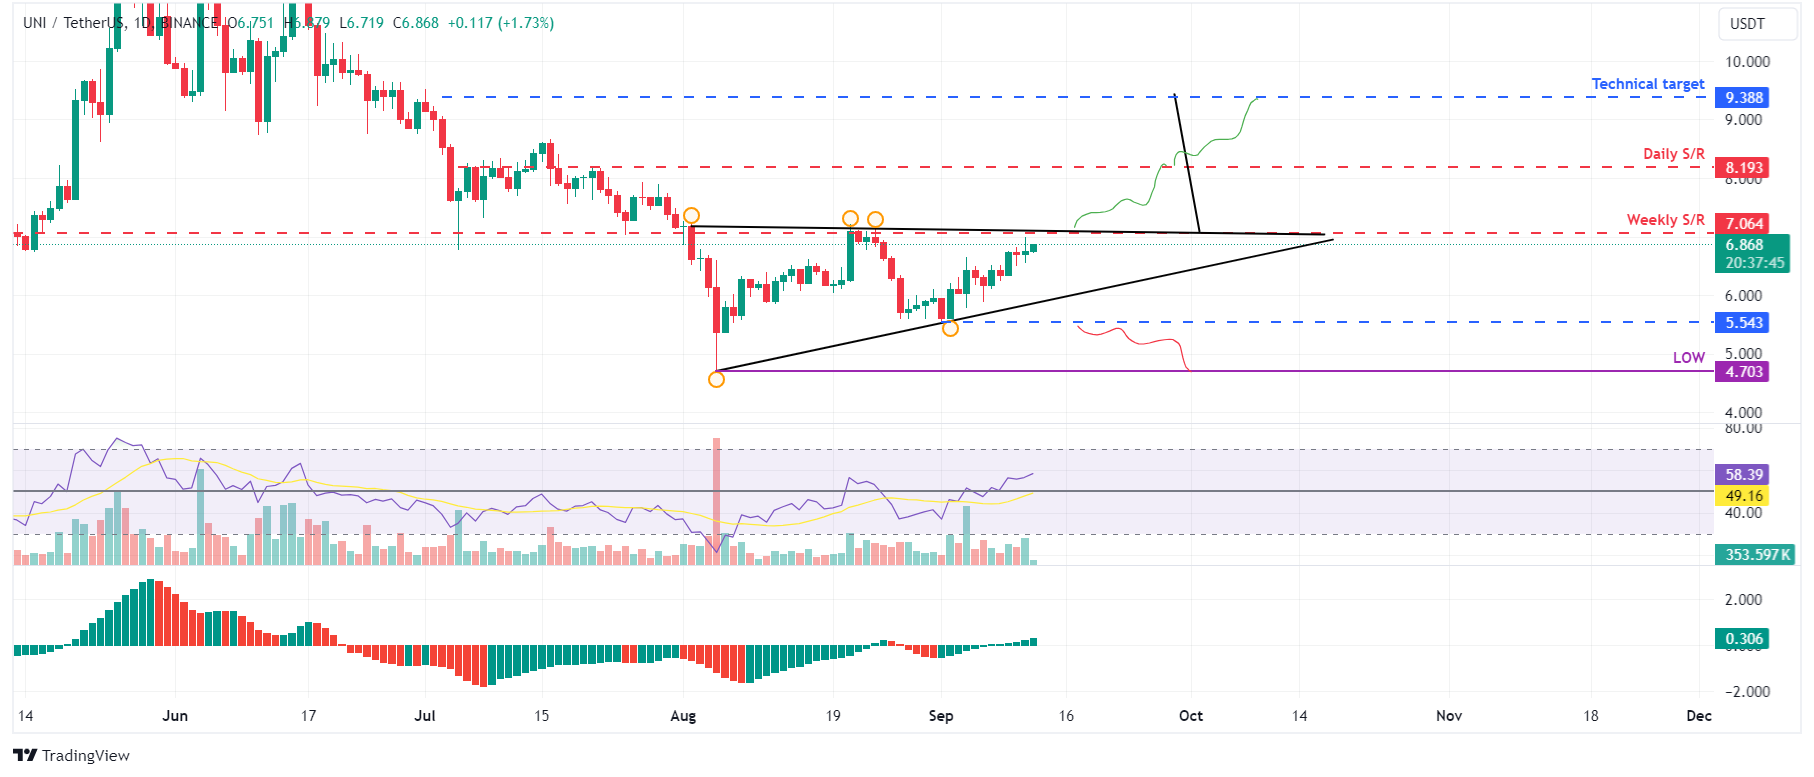
UNI/USDT daily chart
Santiment’s Exchange Flow Balance shows the net movement of Uniswap tokens into and out of exchange wallets. A positive spike indicates more tokens have entered than exited, suggesting selling pressure from investors. Conversely, a negative value indicates more tokens left the exchange than entered, indicating less selling pressure from investors and holders accumulating the asset.
In the case of UNI, this metric slumped from 12,250 to -1.85 million from September 4 to September 5 and from 7,015 to -1.05 million from Sunday to Monday. This negative shift indicates increased buying activity among investors.
During this event, the Uniswap Supply on Exchanges declined by 4.7%. This is a bullish development, as holders remove UNI from exchanges and hold it in cold wallets, further denoting investor confidence in Uniswap.
%20[08.19.20,%2012%20Sep,%202024]-638617108467985509.png)
Uniswap Exchange Flow Balance and Supply on Exchange chart
Despite the bullish thesis signaled by both on-chain data and technical analysis, if UNI breaks the upward trendline of the triangle and closes below $5.54, the outlook would shift to bearish. This scenario could lead to a crash of 16% to $4.70, a daily low of August 5.
Information on these pages contains forward-looking statements that involve risks and uncertainties. Markets and instruments profiled on this page are for informational purposes only and should not in any way come across as a recommendation to buy or sell in these assets. You should do your own thorough research before making any investment decisions. FXStreet does not in any way guarantee that this information is free from mistakes, errors, or material misstatements. It also does not guarantee that this information is of a timely nature. Investing in Open Markets involves a great deal of risk, including the loss of all or a portion of your investment, as well as emotional distress. All risks, losses and costs associated with investing, including total loss of principal, are your responsibility. The views and opinions expressed in this article are those of the authors and do not necessarily reflect the official policy or position of FXStreet nor its advertisers. The author will not be held responsible for information that is found at the end of links posted on this page.
If not otherwise explicitly mentioned in the body of the article, at the time of writing, the author has no position in any stock mentioned in this article and no business relationship with any company mentioned. The author has not received compensation for writing this article, other than from FXStreet.
FXStreet and the author do not provide personalized recommendations. The author makes no representations as to the accuracy, completeness, or suitability of this information. FXStreet and the author will not be liable for any errors, omissions or any losses, injuries or damages arising from this information and its display or use. Errors and omissions excepted.
The author and FXStreet are not registered investment advisors and nothing in this article is intended to be investment advice.
Recommended Content
Editors’ Picks

Top gainers Virtuals Protocol, Floki, Hyperliquid: Altcoins extend gains alongside Bitcoin
The cryptocurrency market sustains a market-wide bullish outlook at the time of writing on Tuesday, led by Bitcoin (BTC) and select altcoins, including Virtuals Protocol (VIRTUAL), Floki, and Hyperliquid (HYPE).

Token unlocks over $625 million this week across major projects SUI, OP, SOL, AVAX and DOGE
According to Wu Blockchain, 11 altcoins with one-time tokens unlock more than $5 million each in the next seven days. The total value of cliff and linear unlocked tokens exceeds $625 million.

TRUMP meme coin on-chain activity surged following dinner announcement: Kaiko
Kaiko Research published a report on Monday highlighting the significant impact of TRUMP's team dinner announcement on the meme coin sector. The announcement triggered a surge in on-chain activity and trading volumes, with TRUMP accounting for nearly 50% of all meme coin trading volume.

Coinbase launches new Bitcoin Yield Fund, offering investors 4–8% annual returns
Coinbase has launched a Bitcoin Yield Fund, aiming to offer non-U.S. investors sustainable 4–8% returns paid directly in Bitcoin.

Bitcoin Weekly Forecast: BTC consolidates after posting over 10% weekly surge
Bitcoin (BTC) price is consolidating around $94,000 at the time of writing on Friday, holding onto the recent 10% increase seen earlier this week.

The Best brokers to trade EUR/USD
SPONSORED Discover the top brokers for trading EUR/USD in 2025. Our list features brokers with competitive spreads, fast execution, and powerful platforms. Whether you're a beginner or an expert, find the right partner to navigate the dynamic Forex market.