- Uniswap breakdown seems unstoppable at the ascending parallel channel's lower boundary support.
- The bearish leg is likely to extend to $25 amid the hunt for formidable support.
- UNI's massive exodus by the whales adds weight to the overhead pressure.
- Support at the 50 SMA and 100 SMA on the 4-hour chart may lead to a rebound toward $30.
Uniswap is in the middle of a retreat after suffering yet another rejection at $30. The push to all-time highs around $34 has proved a hard nut to crack. The bullish front seems exhausted at the time of writing, especially with large volume holders preferring to offload their bags.
Overhead pressure mounts as Uniswap whales sell
According to Santiment, whales holding Uniswap have embarked on a selling spree, perhaps to cash out for profit amid the fear that declines may continue. For example, addresses containing between 1 million and 10 million UNI recently topped out at 65 but have now reduced to 63.
The drop's face value seems insignificant, but the volume moved by these whales is immense and enough to add to the selling pressure significantly. If the exodus continues in the coming days, investors show brace themselves for further dips.
Uniswap holder distribution
Uniswap technical picture worsens
The 4-hour chart brings to light an ascending parallel channel. Support at the channel's middle boundary has already been lost. The least resistance path seems downwards, especially with the Moving Average Convergence Divergence (MACD) flipping bearish.
It is worth noting that the MACD cross under the signal line may trigger massive selling orders, increasing the overhead pressure. This indicator helps identify positions to buy the dip and those where it is advisable to sell the top. A MACD line (blue) cross above the signal line signifies traders to sell the top.
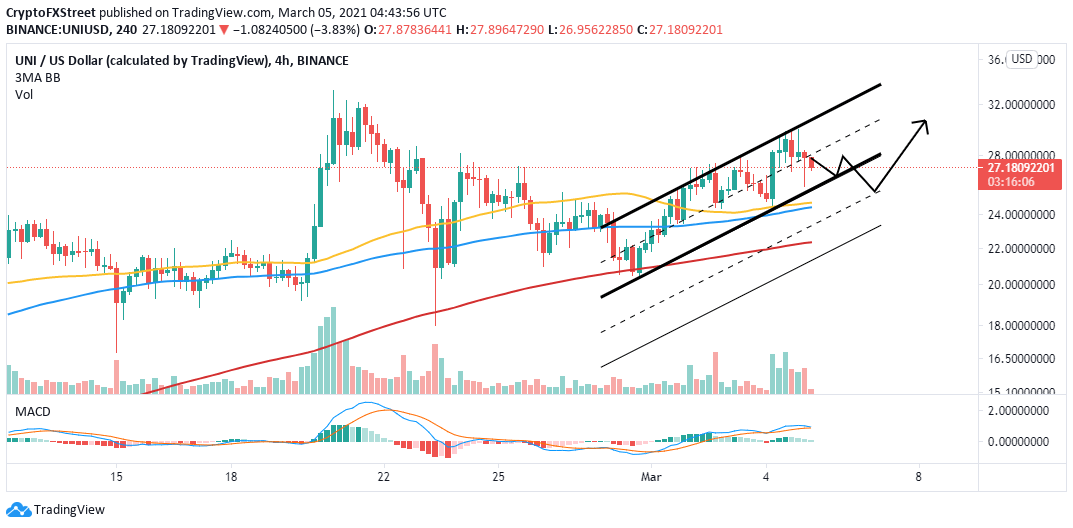
UNI/USD 4-hour chart
Looking at the other side of the picture
If the lower edge of the channel fails to hold, Uniswap may extend the breakdown to $25, a tentative support area highlighted by the 50 Simple Moving Average (SMA) and the 100 SMA. Here, bulls are likely to take control and push to higher levels. Besides, a sustained break past $30 will open the door for gains beyond the record high.
Information on these pages contains forward-looking statements that involve risks and uncertainties. Markets and instruments profiled on this page are for informational purposes only and should not in any way come across as a recommendation to buy or sell in these assets. You should do your own thorough research before making any investment decisions. FXStreet does not in any way guarantee that this information is free from mistakes, errors, or material misstatements. It also does not guarantee that this information is of a timely nature. Investing in Open Markets involves a great deal of risk, including the loss of all or a portion of your investment, as well as emotional distress. All risks, losses and costs associated with investing, including total loss of principal, are your responsibility. The views and opinions expressed in this article are those of the authors and do not necessarily reflect the official policy or position of FXStreet nor its advertisers. The author will not be held responsible for information that is found at the end of links posted on this page.
If not otherwise explicitly mentioned in the body of the article, at the time of writing, the author has no position in any stock mentioned in this article and no business relationship with any company mentioned. The author has not received compensation for writing this article, other than from FXStreet.
FXStreet and the author do not provide personalized recommendations. The author makes no representations as to the accuracy, completeness, or suitability of this information. FXStreet and the author will not be liable for any errors, omissions or any losses, injuries or damages arising from this information and its display or use. Errors and omissions excepted.
The author and FXStreet are not registered investment advisors and nothing in this article is intended to be investment advice.
Recommended Content
Editors’ Picks

Crypto Today: BTC, ETH, and XRP lead $1.4B capitulation on Black Monday as FTX denies $2.5B claims
Cryptocurrencies nosedived over the weekend, shedding over $300 billion since Friday. What some traders on social media are terming crypto’s Black Monday, losses come after an initial positive decoupling on Thursday, when US stocks crashed after China announced 34% retaliatory tariffs.

Bitcoin hits new yearly low below $75,000 as global trade war escalates
Bitcoin price extends its fall by 4% on Monday after correcting near 5% the previous week. The global trade war escalated, wiping out 452,976 leveraged traders and causing a total liquidation of $1.39 billion from crypto markets in the last 24 hours.

Dogecoin shatters $0.15 support as ‘Black Monday’ bloodbath fears surge
Dogecoin tumbles over 10% on Monday, slashing $3.73 billion from its market capitalization to $19.78 billion. CNBC host Jim Crammer warns of global markets’ bloodbath if US President Donald Trump stays intrasigent.

Solana Price Forecast: Bears gain momentum as SOL falls below $100
Solana (SOL) extends its loss by over 7% and falls below the $100 mark at the time of writing on Monday after crashing 15.15% last week. Coinglass data shows that SOL’s leveraged traders wiped out nearly $70 million in liquidations in the last 24 hours.

Bitcoin Weekly Forecast: Tariff ‘Liberation Day’ sparks liquidation in crypto market
Bitcoin (BTC) price remains under selling pressure and trades near $84,000 when writing on Friday after a rejection from a key resistance level earlier this week.

The Best brokers to trade EUR/USD
SPONSORED Discover the top brokers for trading EUR/USD in 2025. Our list features brokers with competitive spreads, fast execution, and powerful platforms. Whether you're a beginner or an expert, find the right partner to navigate the dynamic Forex market.