Uniswap Price Analysis: UNI’s future to be defined by these two critical technical levels
- The 50 SMA on the 4-hour chart must hold to ensure that potential declines are averted.
- Bulls should focus on breaking above the 78.6% Fibonacci level to validate another upswing to new record highs.
- Declining network growth is a bearish signal that could see Uniswap fail to recovery in the near-term.

Uniswap is struggling with sustaining the uptrend after bouncing off support at $17.2. The break above $20 was a bullish signal for the decentralized finance (DeFi) token; however, bulls lost steam slightly above $22.
Uniswap must defend the 50 SMA support
UNI is dancing at $21.46 at the time of writing. The price is sitting on the 50 Simple Moving Average on the 4-hour chart, an immediate support area. Notably, this area coincides with the 61.8% Fibonacci level.
Holding above the crucial support is vital to pushing the recovery further. On the upside, the 78.6% Fibonacci level at $22.4 is the near-term hurdle. If the above support is protected, buyers will be allowed to shift their focus on this resistance. A break above the seller centration zone will pave the way to all-time highs and place Uniswap on the path to new record highs toward $30.
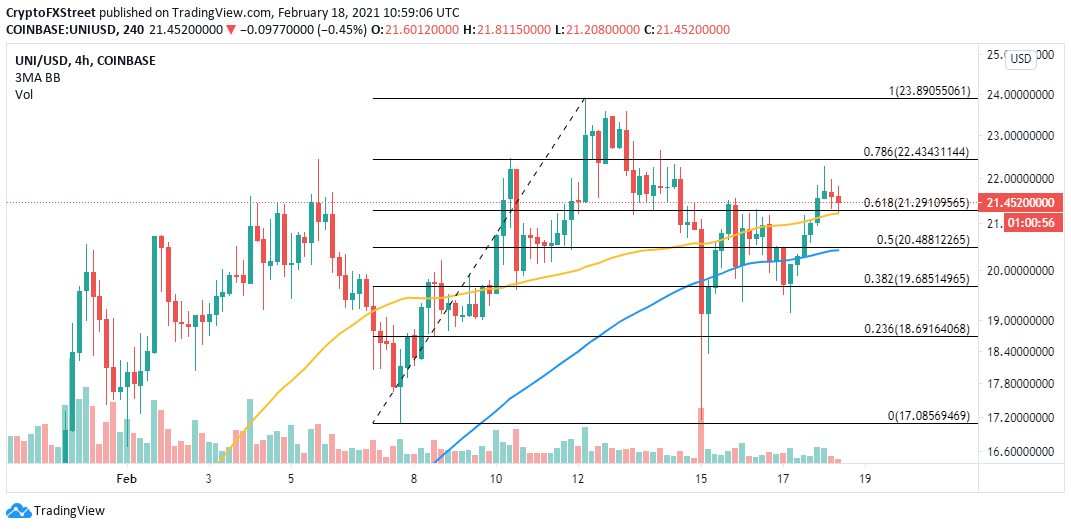
UNI/USD 4-hour chart
The IOMAP chart, developed by IntoTheBlock, shows that minimal hindrances exist ahead of Uniswap. In other words, a rally is anticipated if the subtle selling pressure at $21.7 to $22 is overcome. Here, only 51 addresses had bought roughly 438,000 UNI.
On the downside, Uniswap is sitting on top of a zone with a massive concentration of buyers. This area runs from $20.1 to $20.7. Here, around 6,700 addresses had previously purchased roughly 20.1 million UNI. It is doubtful that Uniswap will slice through this zone and explore the levels toward $17.2 (recent support).
-637492448515388735.png)
Uniswap IOMAP model
Looking at the other side of the picture
The pessimistic outlook may hold based on the declining network growth, as highlighted by Santiment’s on-chain metrics. The network growth model tracks the number of newly-created addresses on the protocol daily. A consistent drop in this metric reveals that Uniswap is unlikely to have the strength to continue with the uptrend.
%20[14.17.55,%2018%20Feb,%202021]-637492448569920926.png)
Uniswap network growth
For instance, the addresses joining the network topped out around 5,900 on January 31. Since then, the addresses have declined to the prevailing 3,380, representing a 42% loss. If the uptake of addresses keeps dropping, it will be challenging for UNI to lift higher. Moreover, the adoption of the project will also be negatively influenced.
Author

John Isige
FXStreet
John Isige is a seasoned cryptocurrency journalist and markets analyst committed to delivering high-quality, actionable insights tailored to traders, investors, and crypto enthusiasts. He enjoys deep dives into emerging Web3 tren


