- Uniswap’s technical picture worsens after breaking below the 100 SMA support.
- A symmetrical triangle could see UNI fall by 74% from the prevailing market value.
- Whales are contributing to the increasing selling pressure as they uncontrollably offload their bags.
- The 200 SMA support on the 4-hour chart is likely to prevent massive losses.
Uniswap has hit another barrier at $28, cutting short the recovery staged from $18. The mission to gain ground to the all-time high of around $34 has been abandoned, with losses extending toward $20. UNI is trading at $22 after losing a couple of key support zones, likely to flip into intense seller congestion areas.
Uniswap on the brink of a colossal breakdown
Uniswap is among the leading decentralized finance (DeFi) tokens in the market. The project boasts of a value locked of $3.98, making it the fourth-largest DeFi platform.
Meanwhile, losing the 50 Simple Moving Average (SMA) as support triggered losses beneath the tentative 100 SMA on the 4-hour chart. At the time of writing, Uniswap is trading at the apex of a symmetrical triangle pattern.
The technical pattern has no bullish or bearish bias. In other words, it can result in either a breakdown or a breakout. Symmetrical triangle patterns are formed by a series of declining peaks and a set of ascending lows. The peaks and troughs are connected using trendlines. The pattern highlights a period of consolidation.
A breakout occurs above the upper trendline, while a breakdown happens when the price slices through the ascending trendline. Note that these triangles have precise targets, measured from the highest to lowest points. The ongoing Uniswap breakdown has a 74% downward target, around $5.75.
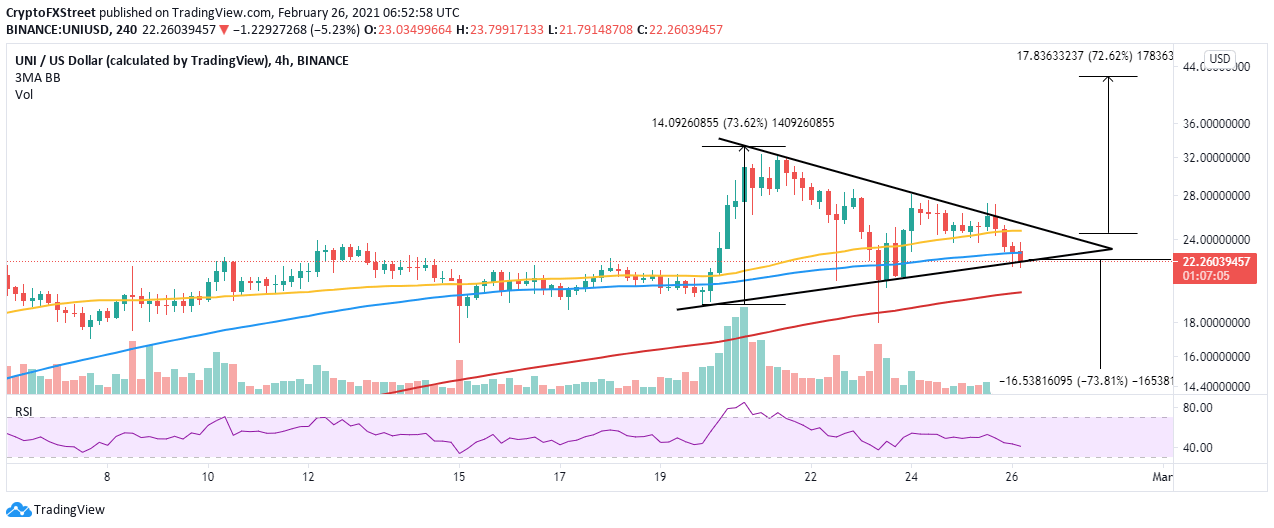
UNI/USD 4-hour chart
According to Santiment’s holder distribution model, Uniswap’s whales are on a selling spree. It seems that a bearish sentiment hovers among the investors who believe that price may fall further and perhaps it is time to take profit.
For instance, addresses holding between 1 million and 10 million UNI topped out at 66 on February 14, tracked on a 30-day trailing average, dropped to 61 at the time of writing, representing a 7.6% decline. The drop may seem insignificant from the face value, but the volume moved is immense and may significantly contribute to the overhead pressure.
%20[10.29.28,%2026%20Feb,%202021]-637499221265025854.png)
Uniswap holder distribution
Looking at the other side of the picture
The 4-hour chart shows that UNI has broken below the symmetrical triangle, risking a major pullback. However, the 200 SMA currently at $20 is in line to support and perhaps halt the declines.
In addition, earlier in the week, Uniswap found support at $18 which could also play a key role in cushioning the token from the dip. On the upside, closing the day above the 100 SMA will call for more buyers to join the market, validating an uptrend.
Information on these pages contains forward-looking statements that involve risks and uncertainties. Markets and instruments profiled on this page are for informational purposes only and should not in any way come across as a recommendation to buy or sell in these assets. You should do your own thorough research before making any investment decisions. FXStreet does not in any way guarantee that this information is free from mistakes, errors, or material misstatements. It also does not guarantee that this information is of a timely nature. Investing in Open Markets involves a great deal of risk, including the loss of all or a portion of your investment, as well as emotional distress. All risks, losses and costs associated with investing, including total loss of principal, are your responsibility. The views and opinions expressed in this article are those of the authors and do not necessarily reflect the official policy or position of FXStreet nor its advertisers. The author will not be held responsible for information that is found at the end of links posted on this page.
If not otherwise explicitly mentioned in the body of the article, at the time of writing, the author has no position in any stock mentioned in this article and no business relationship with any company mentioned. The author has not received compensation for writing this article, other than from FXStreet.
FXStreet and the author do not provide personalized recommendations. The author makes no representations as to the accuracy, completeness, or suitability of this information. FXStreet and the author will not be liable for any errors, omissions or any losses, injuries or damages arising from this information and its display or use. Errors and omissions excepted.
The author and FXStreet are not registered investment advisors and nothing in this article is intended to be investment advice.
Recommended Content
Editors’ Picks

Shiba Inu eyes positive returns in April as SHIB price inches towards $0.000015
Shiba Inu's on-chain metrics reveal robust adoption, as addresses with balances surge to 1.4 million. Shiba Inu's returns stand at a solid 14.4% so far in April, poised to snap a three-month bearish trend from earlier this year.

AI tokens TAO, FET, AI16Z surge despite NVIDIA excluding crypto-related projects from its Inception program
AI tokens, including Bittensor and Artificial Superintelligence Alliance, climbed this week, with ai16z still extending gains at the time of writing on Friday. The uptick in prices of AI tokens reflects a broader bullish sentiment across the cryptocurrency market.

Bitcoin Weekly Forecast: BTC consolidates after posting over 10% weekly surge
Bitcoin price is consolidating around $94,000 at the time of writing on Friday, holding onto the recent 10% increase seen earlier this week. This week’s rally was supported by strong institutional demand, as US spot ETFs recorded a total inflow of $2.68 billion until Thursday.

XRP price could renew 25% breakout bid on surging institutional and retail adoption
Ripple price consolidates, trading at $2.18 at the time of writing on Friday, following mid-week gains to $2.30. The rejection from this weekly high led to the price of XRP dropping to the previous day’s low at $2.11, followed by a minor reversal.
Bitcoin Weekly Forecast: BTC consolidates after posting over 10% weekly surge
Bitcoin (BTC) price is consolidating around $94,000 at the time of writing on Friday, holding onto the recent 10% increase seen earlier this week.

The Best brokers to trade EUR/USD
SPONSORED Discover the top brokers for trading EUR/USD in 2025. Our list features brokers with competitive spreads, fast execution, and powerful platforms. Whether you're a beginner or an expert, find the right partner to navigate the dynamic Forex market.