UMA price explodes by 270% to new all-time highs while technicals show it could rise even higher
- UMA price had a massive 270% explosion hitting a new all-time high at $44.
- Several positive announcements might have pushed the digital asset.
- Most on-chain metrics have remained bullish and indicate UMA could climb even higher.

UMA was trading as low as $11.2 on February 2 before a massive price explosion towards $44 in less than three days. A few positive announcements and whales going into a buying spree have helped the digital asset surge to new highs.
UMA will introduce the ability to buy stocks to Blockchain users
The UMA protocol has announced the launch of a synthetic index called uSTONKs which will track the top 10 WallStreetBets stocks. The WallStreetBets subreddit became famous for pushing GameStop stock and now counts with more than 8 million users around the world.
The first batch of tokens to be listed is uSTONKS-MAR21 with 10 stocks: GEM, AMC, NOK, BB, SLV, TSLA, PLTR, SNDL, AAPL, and SPCE. UMA is launching the index in collaboration with YamFinance which is one of the most popular farming DeFi projects.
UMA price could surge even higher according to various metrics
It’s important to note that despite the recent price surge, the number of whales holding between 100,000 and 1,000,000 coins has increased by seven since January 28. Similarly, other large holders with 10,000 to 100,000 coins have also joined the network in the past week which indicates investors believe the digital asset has the potential to rise higher.
%20[12.50.35,%2004%20Feb,%202021]-637480367110620992.png)
UMA Holders Distribution chart
Even more surprising is the fact that the percentage of UMA coins inside exchanges plummeted on February 2 from 3.36% to a current low of 2.99% indicating that investors have withdrawn their coins and have no intention to sell.
%20[12.51.58,%2004%20Feb,%202021]-637480367138904120.png)
UMA coins inside exchanges
Of course, UMA has experienced a significant spike in network growth over the past week. The number of new addresses joining the network blew up by 450% in seven days from 104 addresses per day on February 1 to 700 currently.
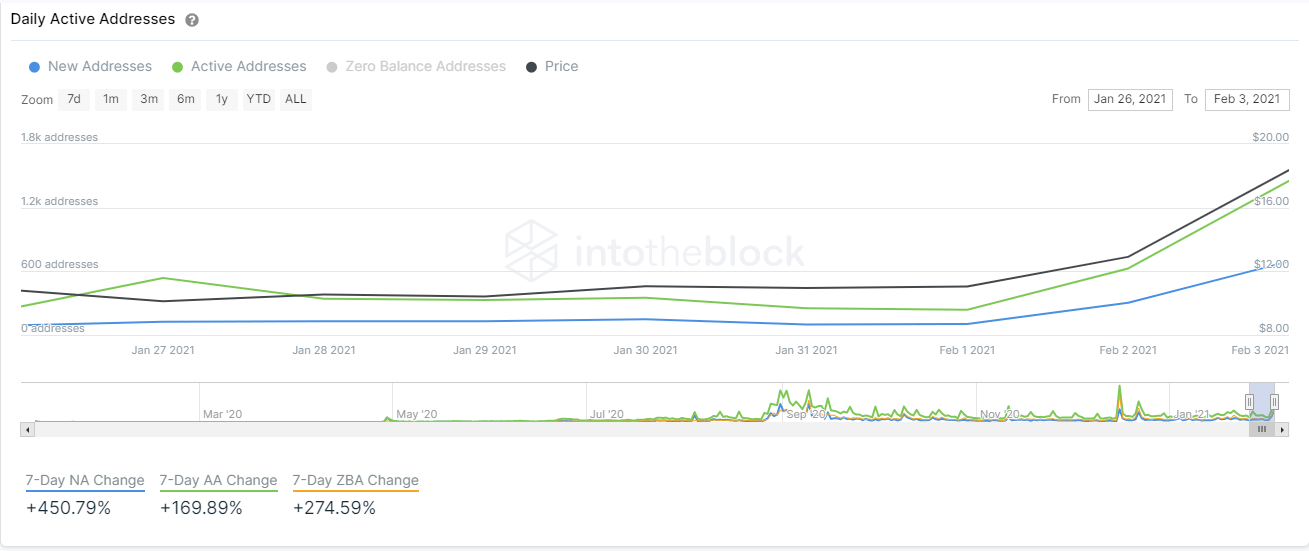
UMA network growth
Similarly, the number of active addresses also exploded by 170% in the past week. If the bullish momentum continues like this, we could see UMA price reach $54 in the near future which is the 127.2% Fibonacci level.
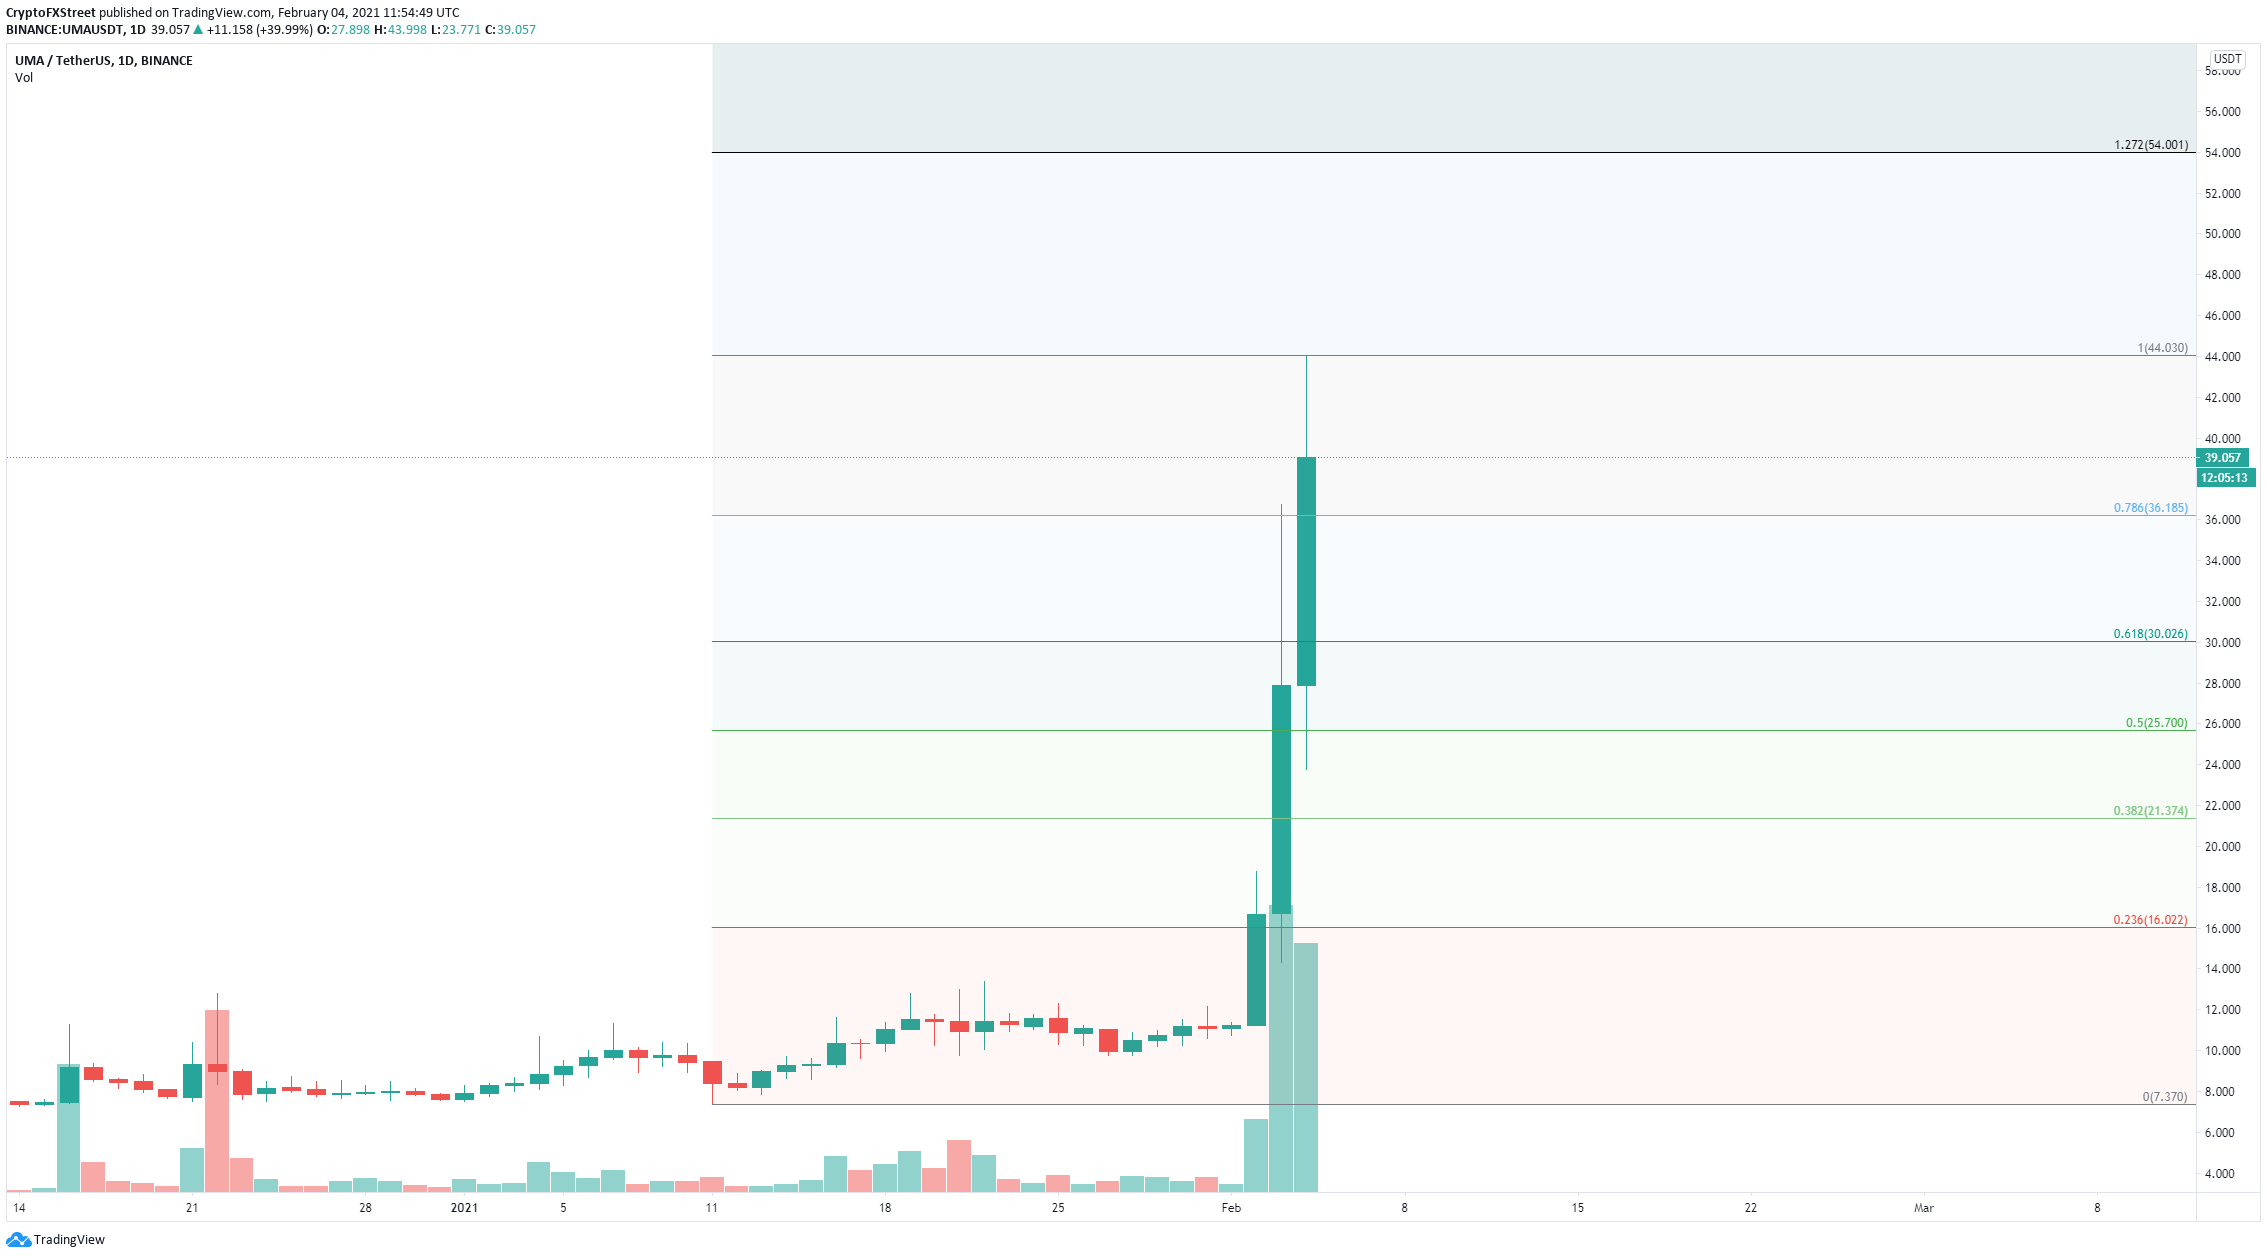
UMA/USD daily chart
However, the digital asset could also see a nasty correction in the short-term as it is overextended. The most important levels to look out for are the 78.6% Fib level ($36.18) and the psychological level at $30 which coincides with the 61.8% level.
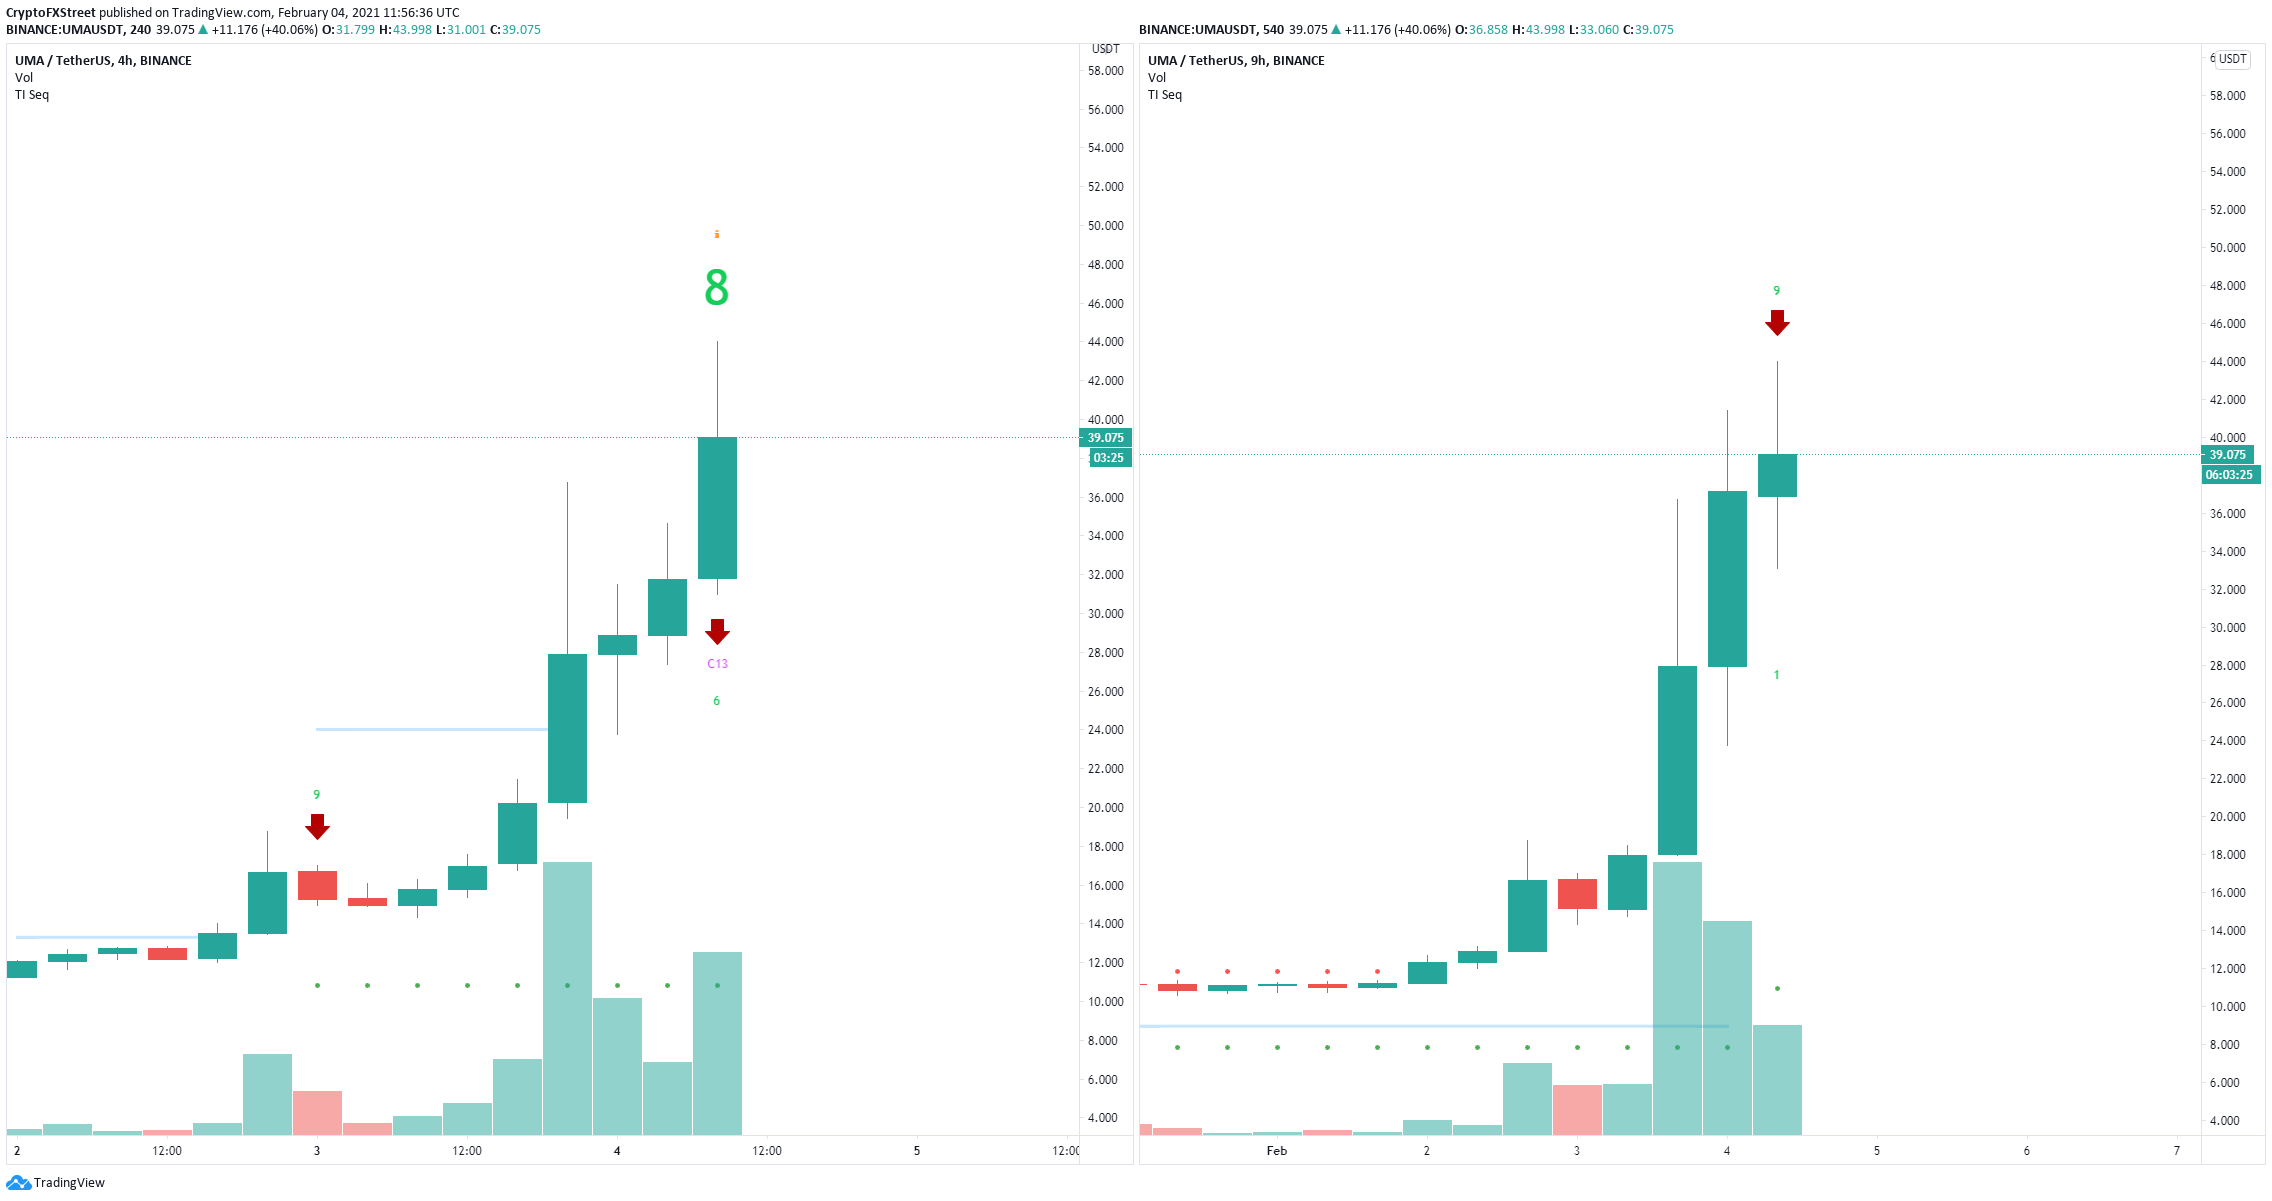
UMA sell signals
On the 9-hour chart, the TD Sequential indicator has just presented a sell signal and on the 4-hour chart, it printed a green ‘8’ candlestick which is usually followed by the same signal. The indicator adds credence to the bearish outlook in the short-term.
Author

Lorenzo Stroe
Independent Analyst
Lorenzo is an experienced Technical Analyst and Content Writer who has been working in the cryptocurrency industry since 2012. He also has a passion for trading.


