![]() Sheldon McIntyre, CMT
Sheldon McIntyre, CMT
Independent Analyst
- TRON price shaping the handle of a cup-with-handle base on the weekly chart.
- TRX daily Relative Strength Index (RSI) remains overbought but below the extreme reading of 83.06 plotted on August 16.
- TRON price respects July ascending trend line on August 19 with a 4.03% bounce.
TRON price has rallied in step with the broader cryptocurrency market since the July 20 low, recording a 100% gain at the August 16 high of $0.098 and confidently maintaining support above the July ascending trend line. Despite the noteworthy rally, TRX has reached a resistance level that corresponds with the April lows while flashing an extreme overbought reading on the daily RSI. The preconditions for a deeper pullback are coming into focus.
TRON price is an opportunity wrapped in mystery
From a long-term perspective, TRON price has been plotting a cup-with-handle pattern since the January 2018 high. The April-July cyclical correction has shaped the handle. The handle low is defined by superior support attributed to the confluence of the 50-week simple moving average (SMA) and the 2020 high of $0.053. Now, TRX is aiming to complete the right side of the handle in the coming months.
The measured move target of the cup-with-handle base is $0.370, putting TRON price above the left side of the base at $0.350.
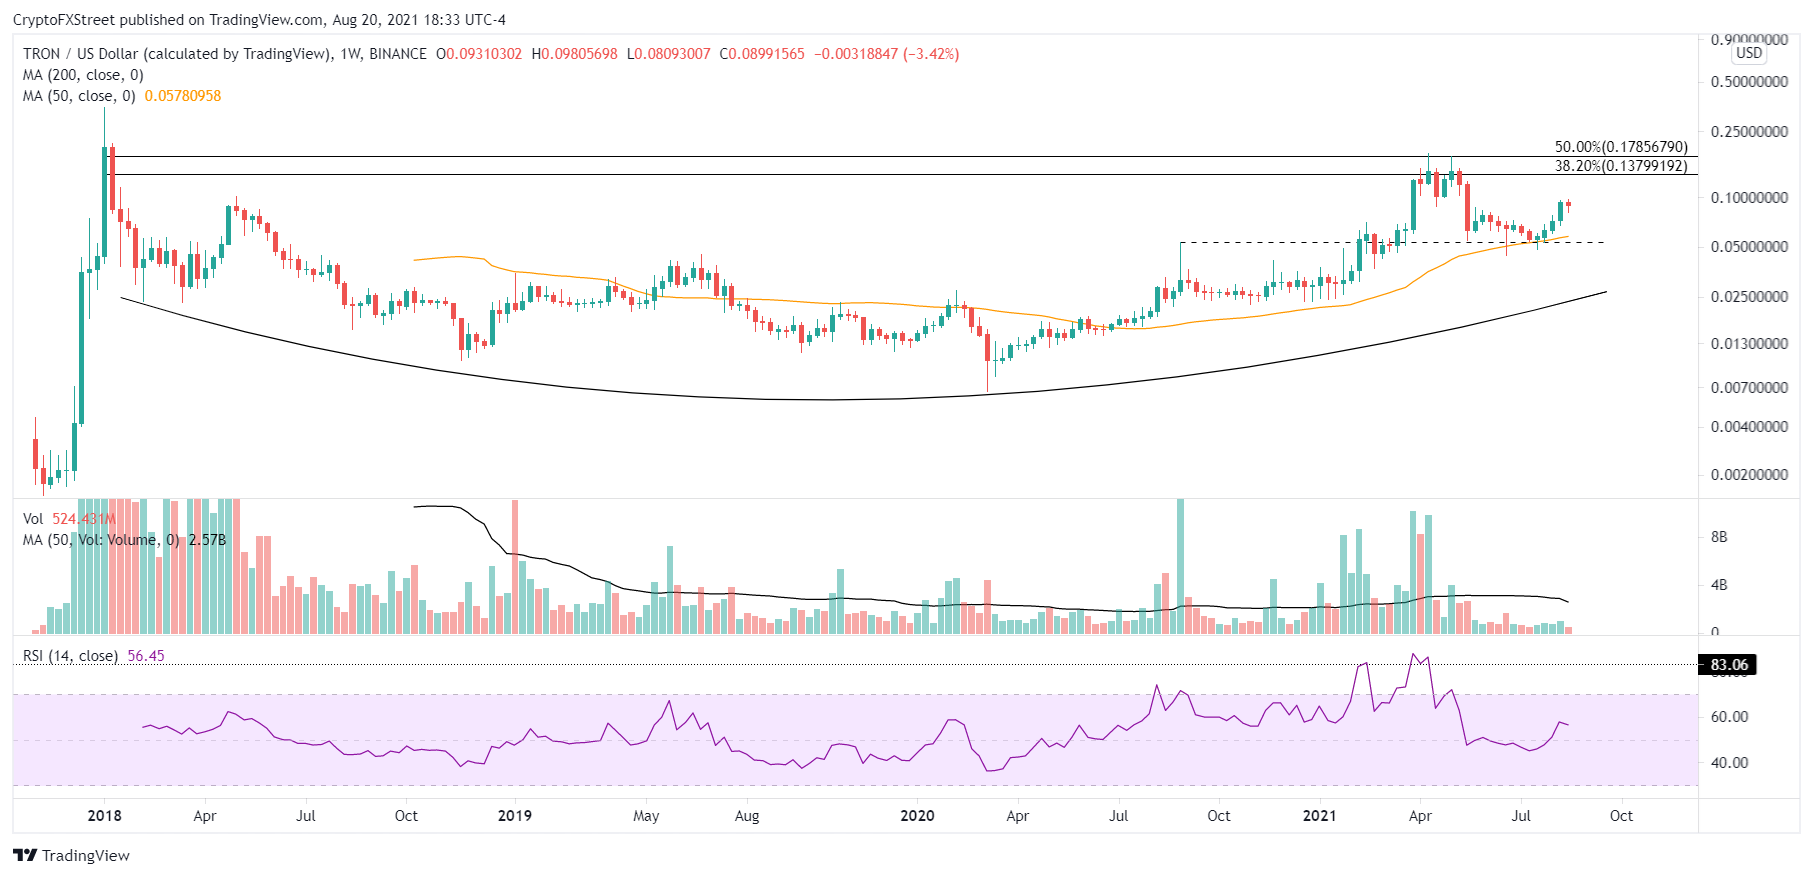
TRX/USD weekly chart
Currently, TRON price holds the 200-day SMA at $0.078, and the July ascending trend line but is confronting the resistance established by the April lows and the TRX rebound highs that followed the May 19 collapse around $0.095.
The test of the TRON price range while hitting an extreme overbought condition does raise the probabilities of a deeper pullback, possibly down to the 50-day SMA at $0.067. It would create a new entry price for TRX speculators and the runway for the altcoin to resume the pursuit of a breakout from the cup-with-handle pattern.
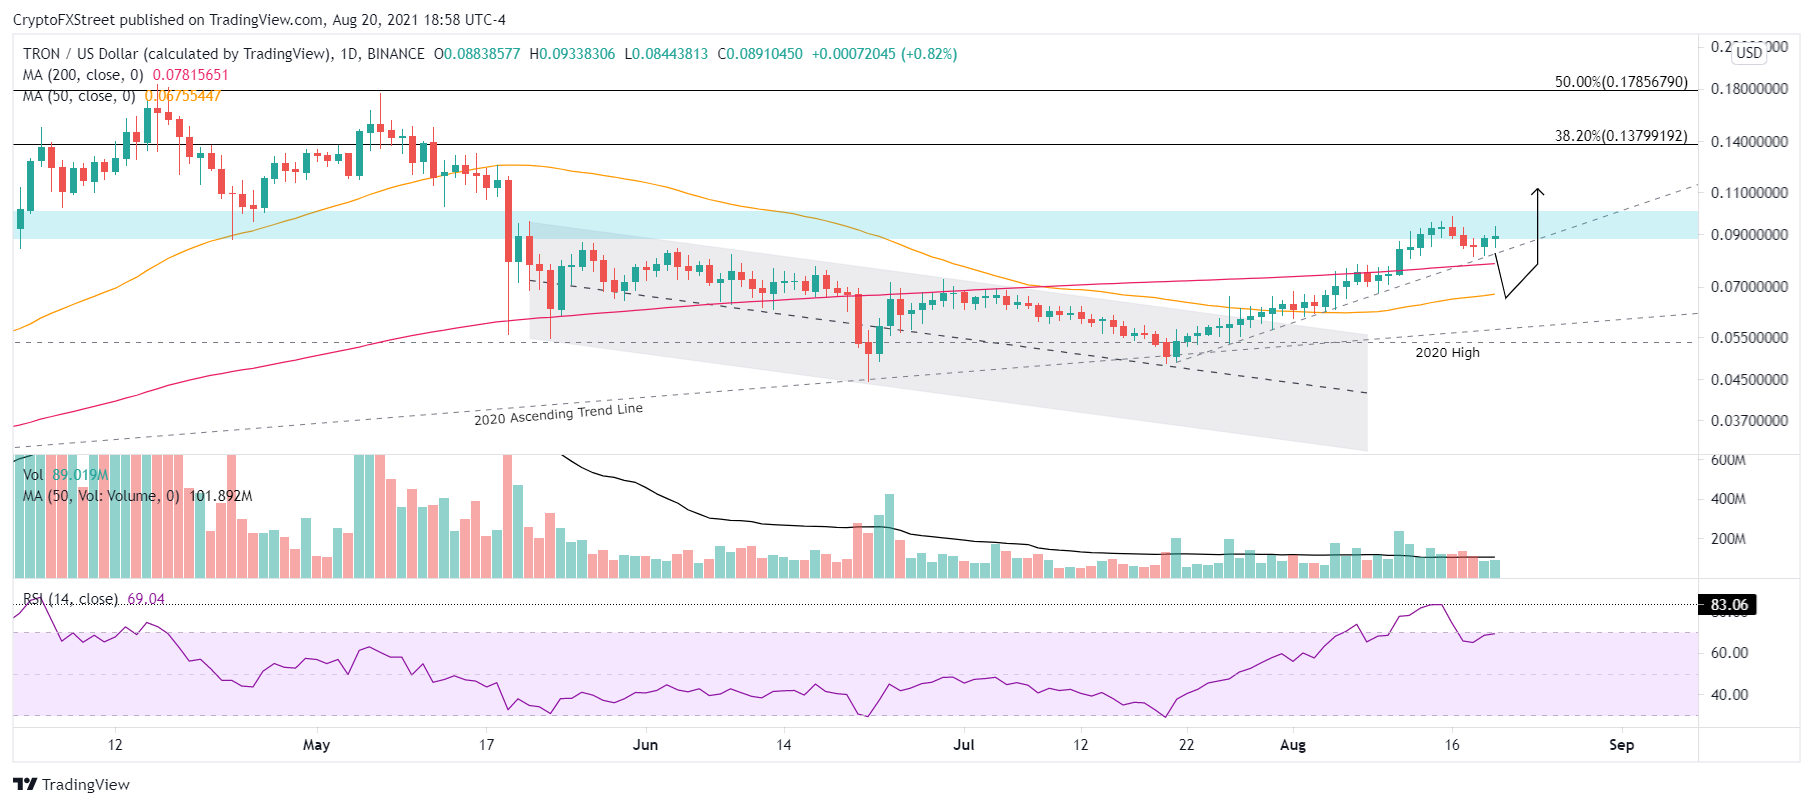
TRX/USD daily chart
The presence of the July ascending trend line and 200-day SMA may prevent a deeper pullback for TRON price, enabling a correction in time versus price. Once TRX closes above the August 16 high of $0.098 and the high of the noteworthy price resistance at $0.099, it will not encounter any serious technical obstacles until the 38.2% Fibonacci retracement of the 2018-2020 secular correction at $0.137.
The 50% retracement at $0.178 and the handle highs will also be a challenge for TRON price if the 38.2% retracement is shattered. It would represent a 100% gain from the current TRX price.
TRON price is at an inflection point as it battles a challenging range with an overbought daily RSI. Subsequently, the mystery is whether TRX can beat the resistance mentioned above without a meaningful pullback. Or, does it need to refresh the price structure and technical indicators to master a sustainable rally to the handle highs and a 100% return.
Note: All information on this page is subject to change. The use of this website constitutes acceptance of our user agreement. Please read our privacy policy and legal disclaimer. Opinions expressed at FXstreet.com are those of the individual authors and do not necessarily represent the opinion of FXstreet.com or its management. Risk Disclosure: Trading foreign exchange on margin carries a high level of risk, and may not be suitable for all investors. The high degree of leverage can work against you as well as for you. Before deciding to invest in foreign exchange you should carefully consider your investment objectives, level of experience, and risk appetite. The possibility exists that you could sustain a loss of some or all of your initial investment and therefore you should not invest money that you cannot afford to lose. You should be aware of all the risks associated with foreign exchange trading, and seek advice from an independent financial advisor if you have any doubts.
Recommended Content
Editors’ Picks

Bitcoin Weekly Forecast: BTC nosedives below $95,000 as spot ETFs record highest daily outflow since launch
Bitcoin price continues to edge down, trading below $95,000 on Friday after declining more than 9% this week. Bitcoin US spot ETFs recorded the highest single-day outflow on Thursday since their launch in January.

Bitcoin crashes to $96,000, altcoins bleed: Top trades for sidelined buyers
Bitcoin (BTC) slipped under the $100,000 milestone and touched the $96,000 level briefly on Friday, a sharp decline that has also hit hard prices of other altcoins and particularly meme coins.

Solana Price Forecast: SOL’s technical outlook and on-chain metrics hint at a double-digit correction
Solana (SOL) price trades in red below $194 on Friday after declining more than 13% this week. The recent downturn has led to $38 million in total liquidations, with over $33 million coming from long positions.

SEC approves Hashdex and Franklin Templeton's combined Bitcoin and Ethereum crypto index ETFs
The SEC approved Hashdex's proposal for a crypto index ETF. The ETF currently features Bitcoin and Ethereum, with possible additions in the future. The agency also approved Franklin Templeton's amendment to its Cboe BZX for a crypto index ETF.

Bitcoin: 2025 outlook brightens on expectations of US pro-crypto policy
Bitcoin (BTC) price has surged more than 140% in 2024, reaching the $100K milestone in early December. The rally was driven by the launch of Bitcoin Spot Exchange Traded Funds (ETFs) in January and the reduced supply following the fourth halving event in April.

Best Forex Brokers with Low Spreads
VERIFIED Low spreads are crucial for reducing trading costs. Explore top Forex brokers offering competitive spreads and high leverage. Compare options for EUR/USD, GBP/USD, USD/JPY, and Gold.