Top five cryptocurrencies to watch this week: BTC, ETH, SOL, MATIC, FTM

Bitcoin’s shallow pullback increases the prospect of a new all-time high in the short term and altcoins like ETH, SOL, MATIC and FTM could move higher while BTC prepares for its next move.
On Oct. 15, news that a Bitcoin (BTC) exchange-traded fund (ETF) could start trading as early as next week sent Bitcoin price to $62,933 but the rally has cooled off since then.
Some market participants believe that traders who bought the rumor of approval for a Bitcoin ETF product may sell on the news. Crypto trading firm QCP Capital said in an update that the approval of futures-based ETFs is unlikely to provide a long-term boost for Bitcoin prices similar to the one seen in the fourth quarter of 2020.
While high volatility cannot be ruled out in the near term, investors should focus on the major trend and not get caught in minor corrections that are part of the path to new all-time highs.
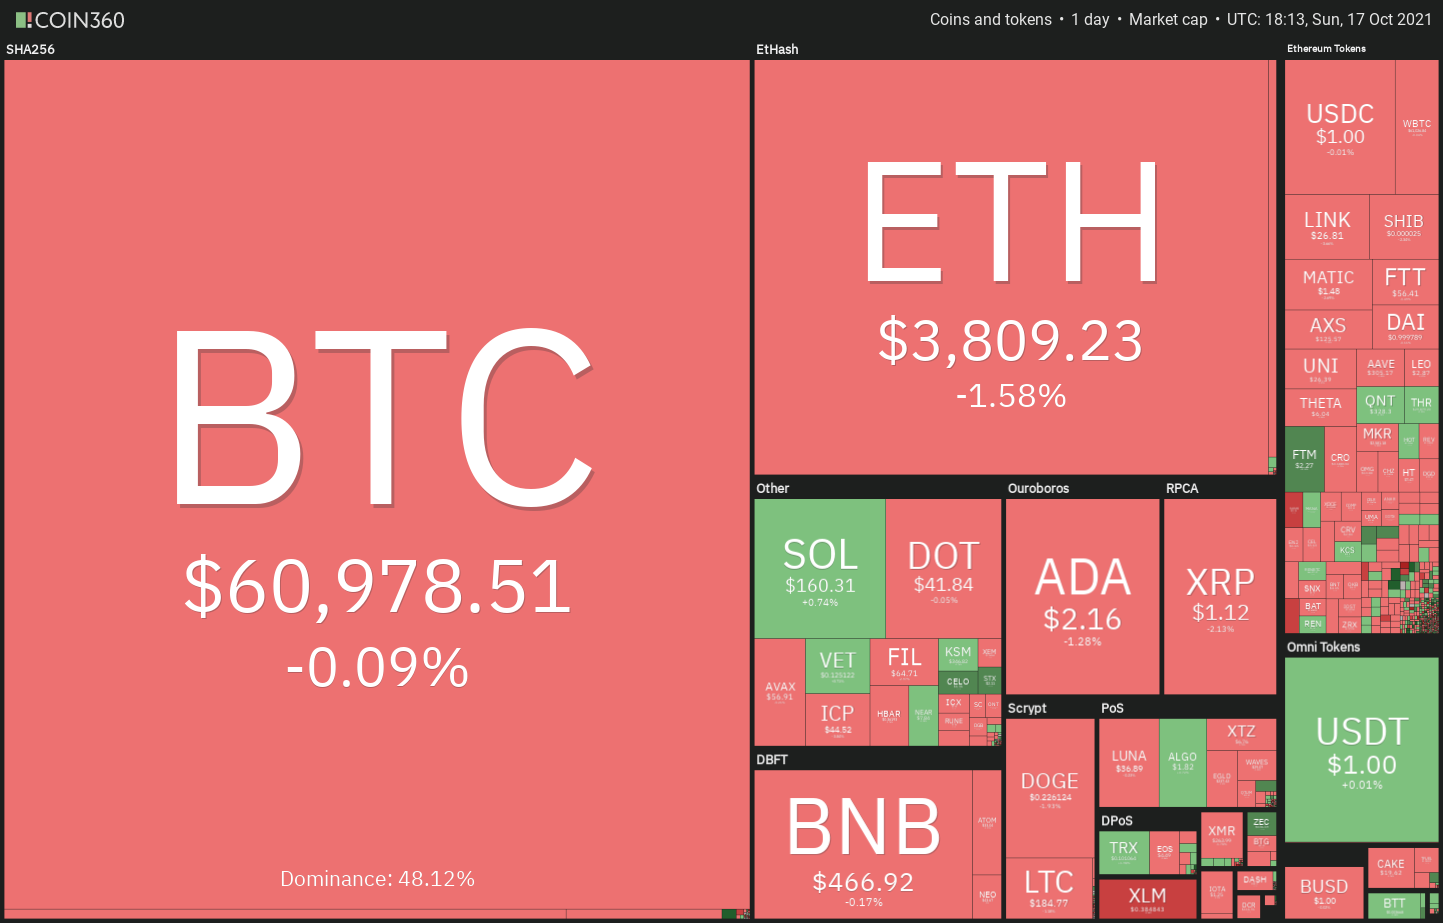
Crypto market data daily view. Source: Coin360
According to Foxbit founder João Canhada, his daughter has earned a 6,500% profit on the one Bitcoin gift she received when she was born in 2017. Although she couldn’t have traded the coin at such a young age, the returns show that patient investors who are not perturbed by a minor fall can end up with huge returns.
Could Bitcoin's rally to a new all-time high pull altcoins along with it? Let’s study the charts of the top-5 cryptocurrencies that could outperform in the short term.
BTC/USDT
Bitcoin soared above the $58,000 resistance and the psychological mark at $60,000 on Oct. 15. The bears are attempting to stall the up-move at $62,933 but the positive sign is that bulls have not given up much ground. This suggests that traders are not closing their positions after the recent up-move because they anticipate another leg up.
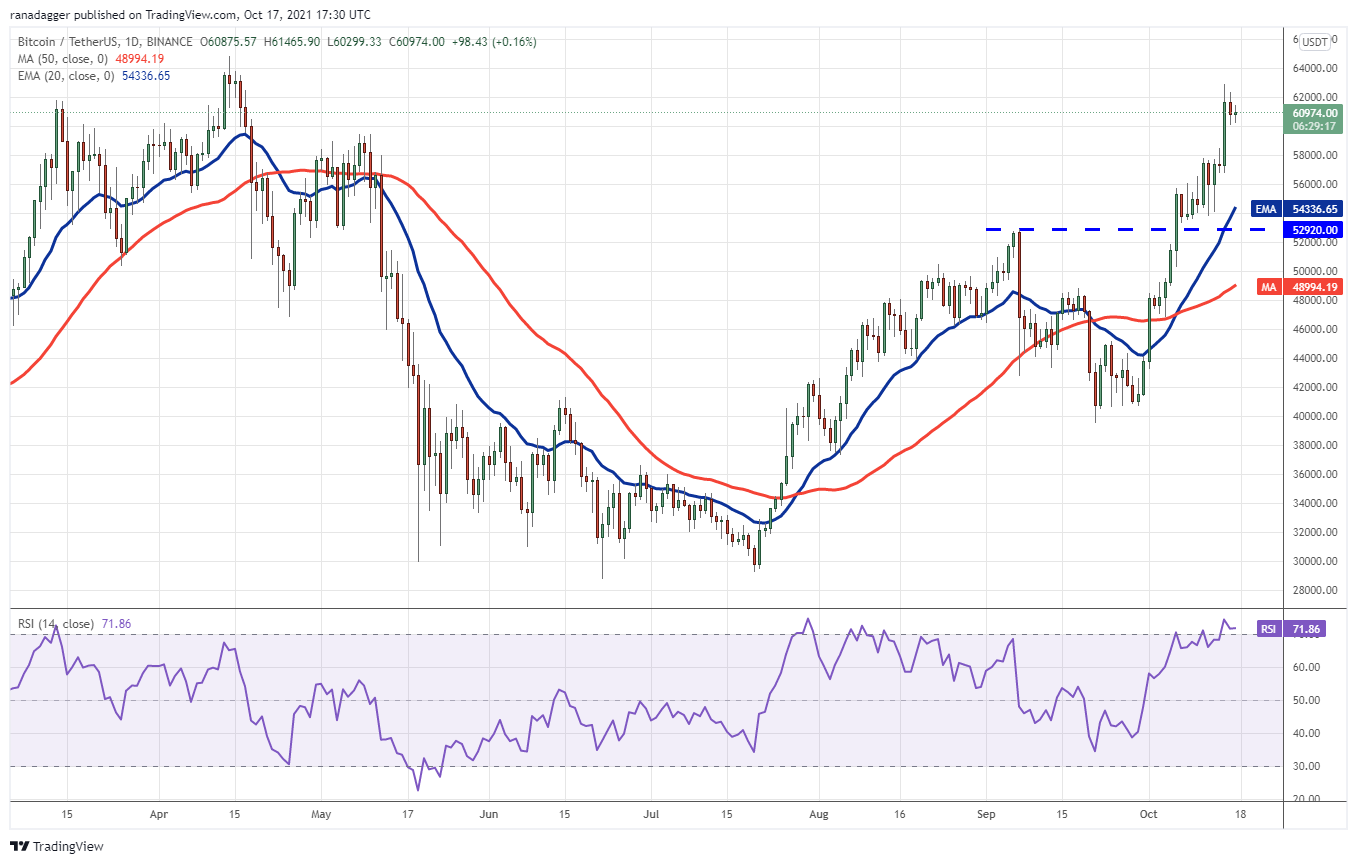
BTC/USDT daily chart. Source: TradingView
Both moving averages are sloping up and the relative strength index (RSI) is in the overbought zone, indicating that bulls are in control. If the price turns up from the current level and breaks above the $62,933 to $64,854 resistance zone, the BTC/USDT pair may rally to $75,000.
The immediate support to watch on the downside is $58,000. A break and close below this level could prompt short-term traders to book profits, pulling the price down to the 20-day exponential moving average ($54,336).
A bounce off the 20-day EMA will suggest that sentiment remains positive and traders are buying on dips. The bulls will then make one more attempt to resume the uptrend. On the contrary, a break and close below the 20-day EMA will suggest that the bullish momentum has weakened.
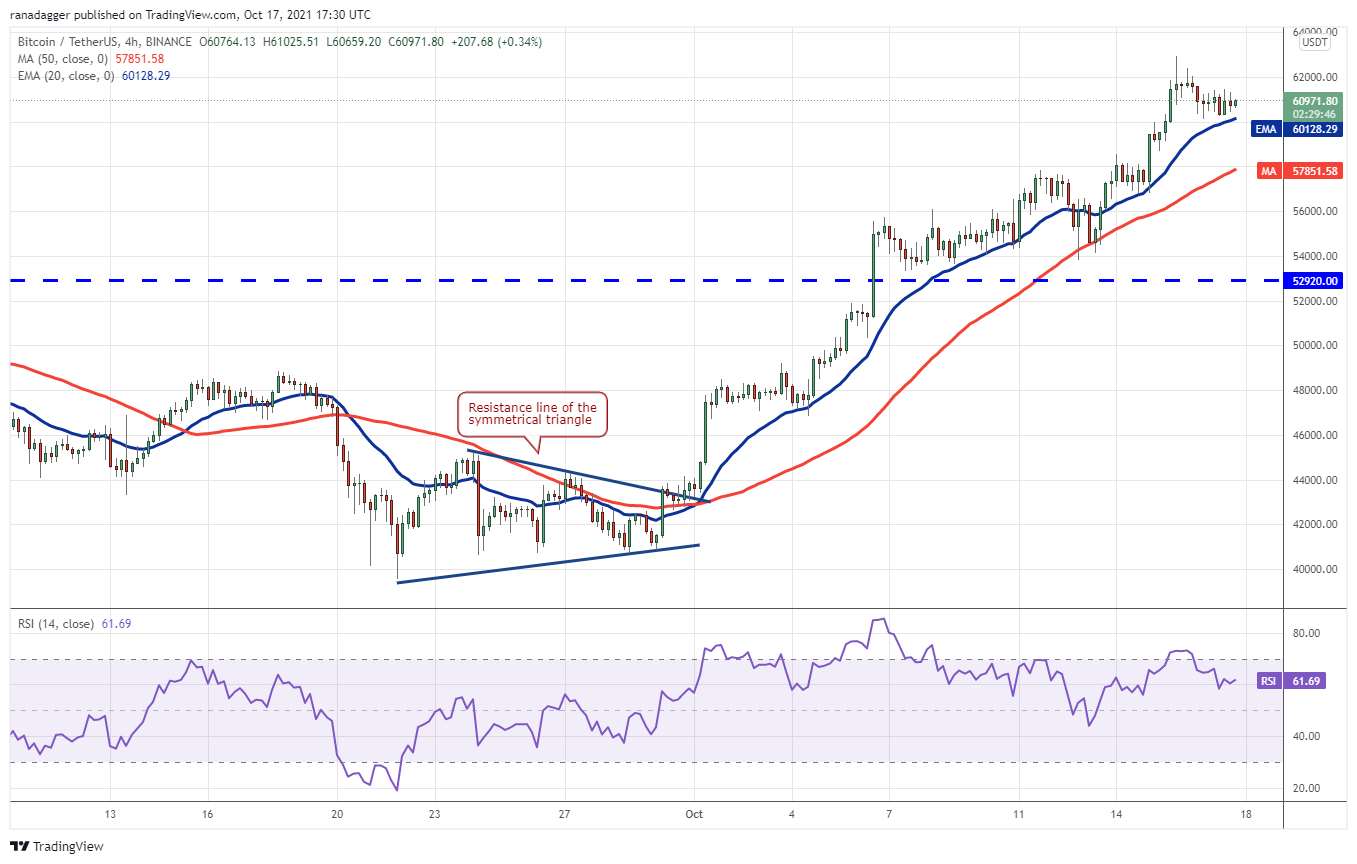
BTC/USDT 4-hour chart. Source: TradingView
The pair has been rising in a steady uptrend on the 4-hour chart. The bears have not been able to sink and sustain the price below the 50-simple moving average since the pair broke above the symmetrical triangle.
If the price rebounds off the 20-EMA, the possibility of a break above $62,933 may increase because it will suggest that traders are not waiting for a deeper correction to buy. This bullish assumption will invalidate if bears sink and sustain the pair below the 50-SMA. Such a move could open the doors for a drop to $54,000 and then to $52,290.
ETH/USDT
Ether’s (ETH) break and close above the neckline on Oct. 14 completed the inverse head and shoulders pattern. The long wick on the Oct. 16 candlestick suggests that bears are attempting to stall the up-move in the $4,000 to $4,027.88 zone.

ETH/USDT daily chart. Source: TradingView
If the price turns down from the current level, the ETH/USDT pair could drop to the breakout level at the neckline. This is an important support for the bulls to defend. If the price rebounds off this level, the bulls will again try to clear the overhead hurdle.
A breakout and close above $4,027.88 could clear the path for a rally to the all-time high at $4,372.72 and next to the pattern target at $4,657. Conversely, a break below the moving averages could sink the price to $3,257. The bears will gain the upper hand if this support is breached.
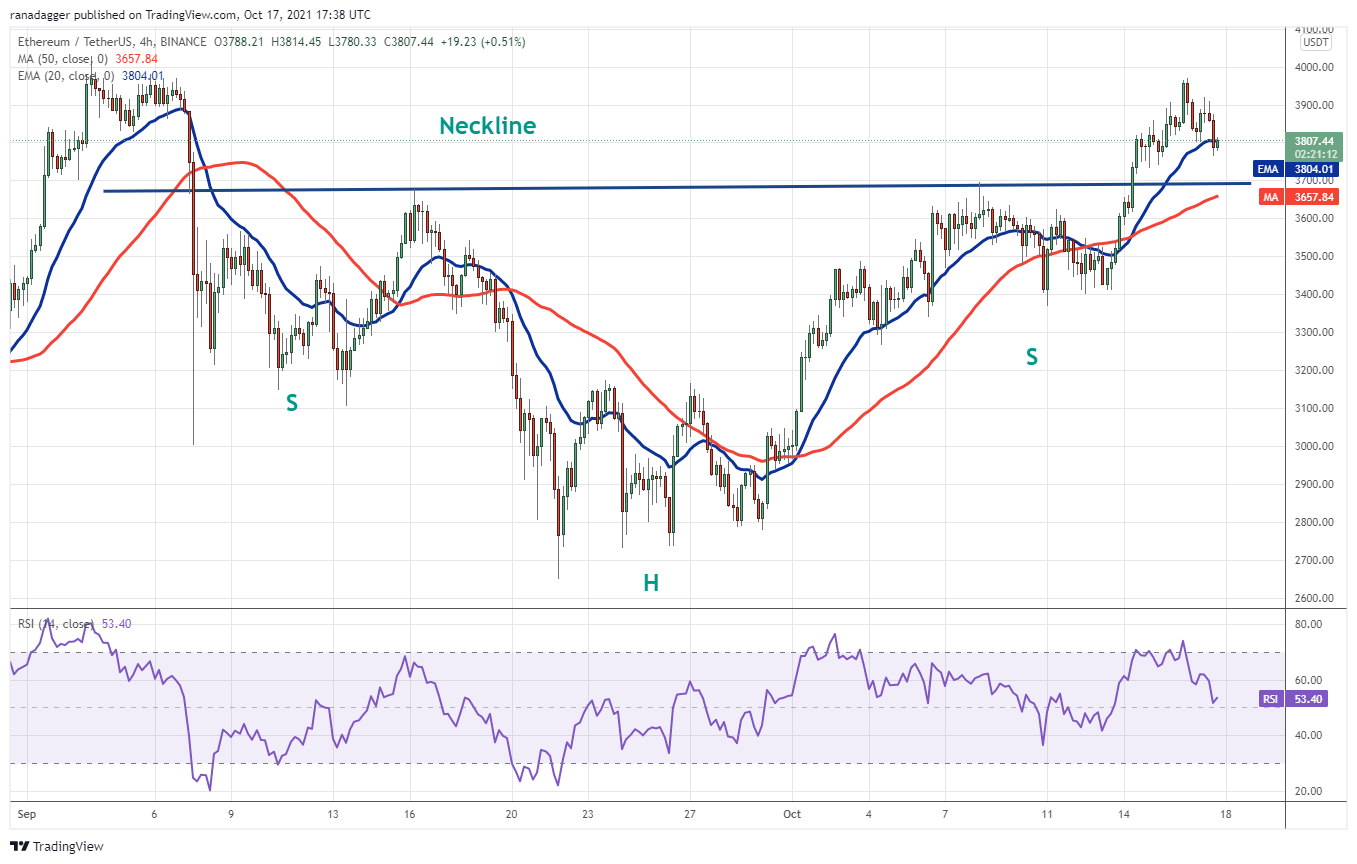
ETH/USDT 4-hour chart. Source: TradingView
The bears are defending the psychological resistance at $4,000 while bulls are trying to keep the price above the 20-EMA. The RSI has dropped close to the midpoint and the 20-EMA is flattening out, suggesting a possible consolidation in the near term.
A break and close above $4,000 could signal the resumption of the up-move. Conversely, a break below the neckline of the setup will be the first sign that the momentum may be weakening. The pair could then decline to $3,400.
SOL/USDT
Solana (SOL) broke out and closed above the downtrend line on Oct. 15 which is the first sign that bulls are attempting a comeback. The bears tried to pull the price back below the downtrend line on Oct. 16 but failed.
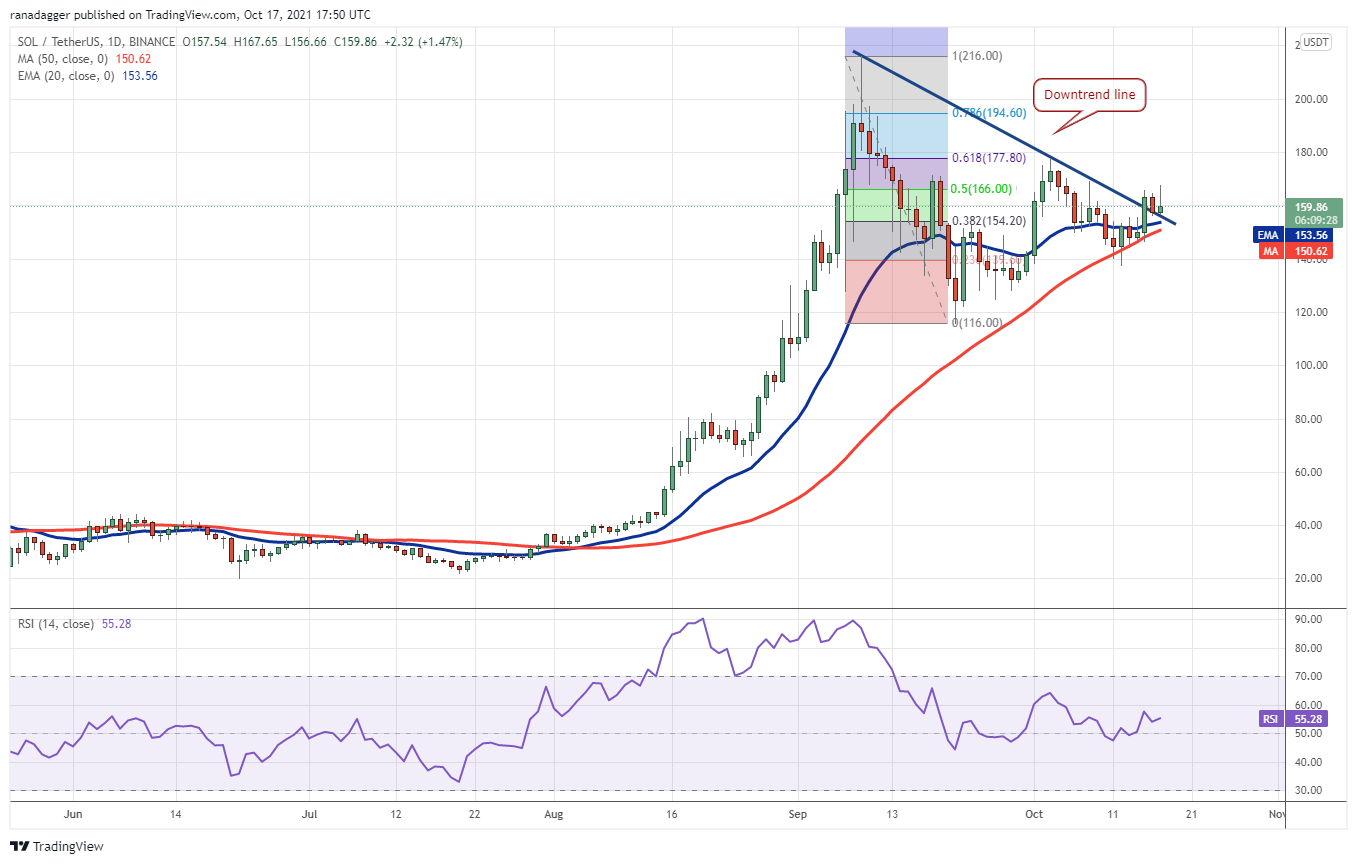
SOL/USDT daily chart. Source: TradingView
If bulls sustain the price above the downtrend line, the SOL/USDT pair could rise to the 61.80% resistance at $177.80. This is an important level for the bears to defend because if bulls clear this hurdle, the pair could rise to the 78.6% retracement level at $194.60 and later retest the all-time high at $216.
Contrary to this assumption, if the price turns down from the current level or the overhead resistance and breaks below the moving averages, it will suggest that traders are closing their positions on pullbacks. The pair could then drop to the critical support at $116.
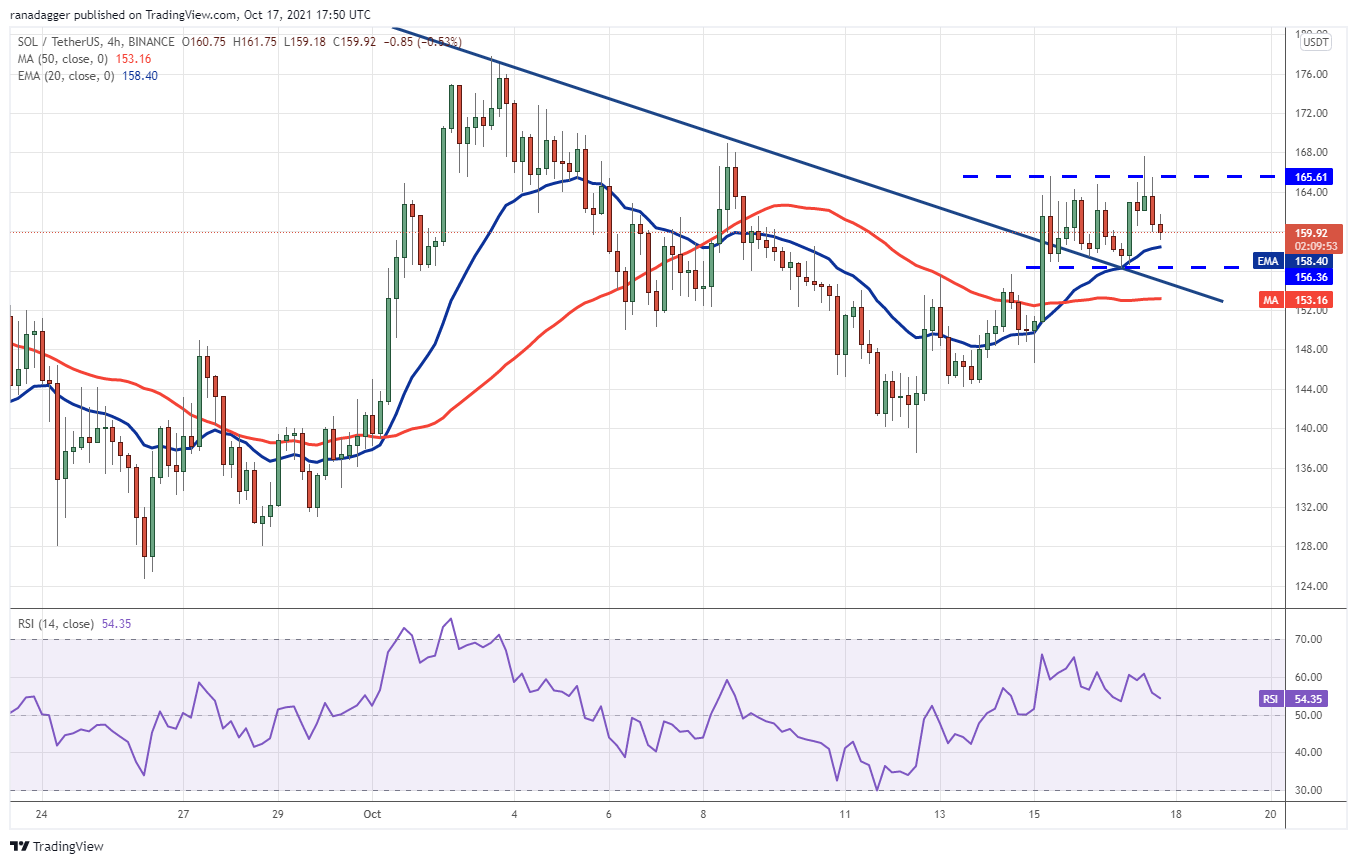
SOL/USDT 4-hour chart. Source: TradingView
The 4-hour chart shows that the pair has been trading between $156.36 and $165.61 since breaking out of the downtrend line. If buyers propel and sustain the price above $165.61, the uptrend may resume.
The first target is the overhead zone between $174.86 and $177.79. Alternatively, a break and close below $156.36 could open the doors for a decline to $147.11. Until then, the pair may continue to consolidate in the tight range.
MATIC/USDT
Polygon (MATIC) has been trading in a large range between $1 and $1.80 for the past few days. The 20-day EMA ($1.32) has started to turn up and the RSI has risen into the positive territory, indicating that bulls are attempting to gain the upper hand.
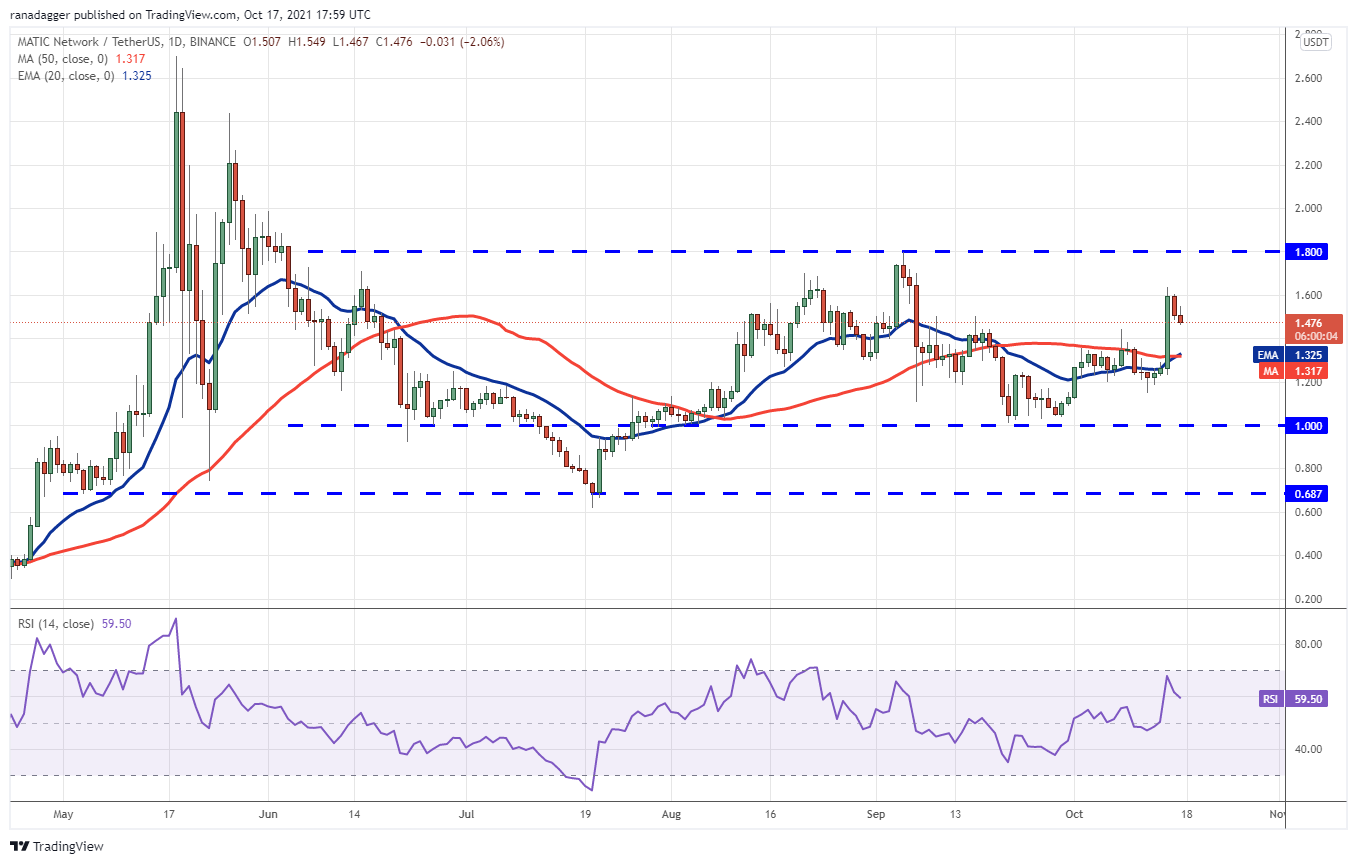
MATIC/USDT daily chart. Source: TradingView
The MATIC/USDT pair could rise to $1.80 which is likely to act as a tough obstacle. If the price turns down from this resistance, the pair could drop to the 20-day EMA.
A strong rebound off this support will suggest that sentiment has turned positive and traders are buying on dips. That will increase the possibility of a break and close above $1.80.
If that happens, the pair could start a new uptrend to $2.40 and then retest the all-time high at $2.70. Conversely, if the price turns down from the current level and breaks below the moving averages, the pair could slide to $1.20 and then to $1.
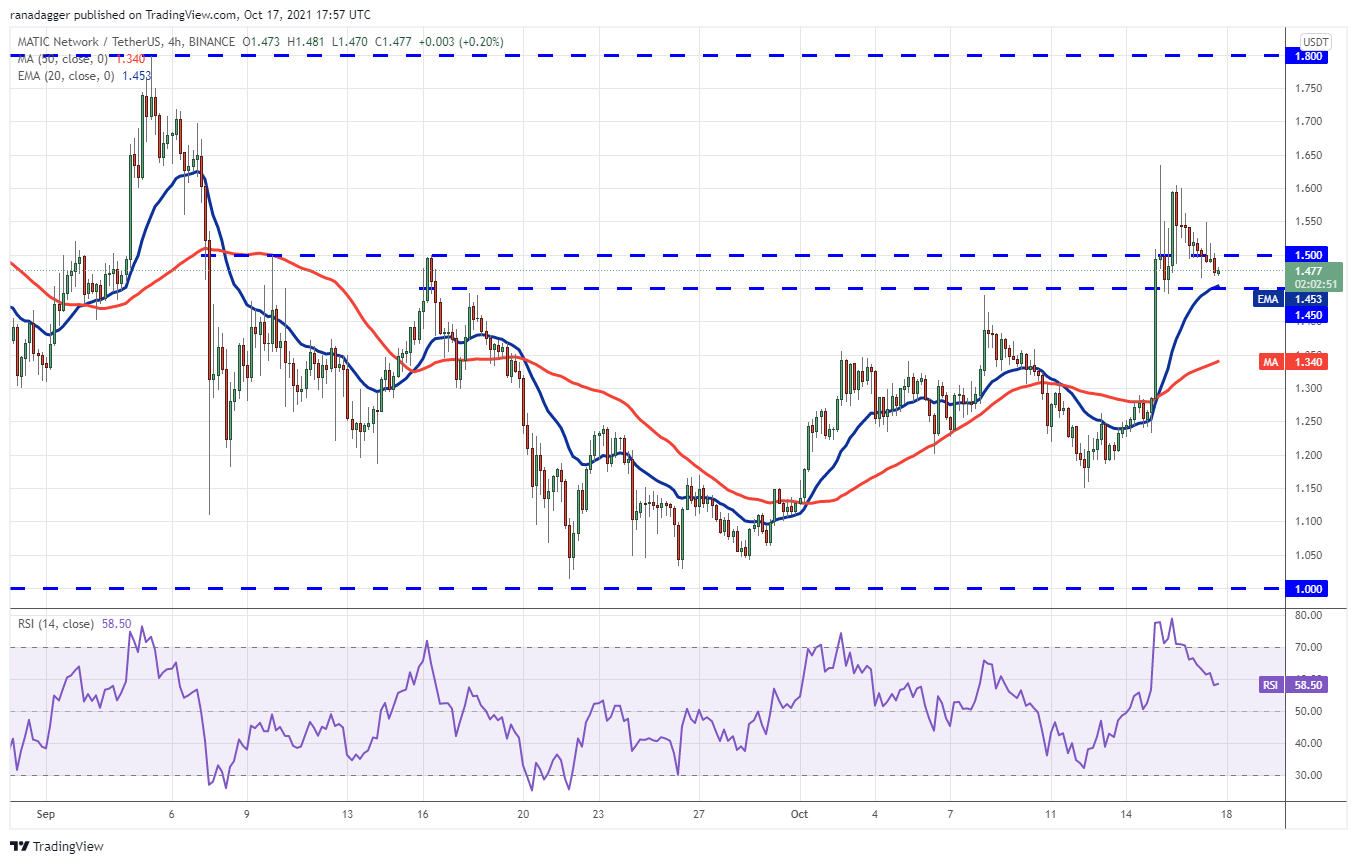
MATIC/USDT 4-hour chart. Source: TradingView
Both moving averages are sloping up and the RSI is in the positive zone, suggesting that bulls have the upper hand in the short term. The bulls pushed the price above the overhead resistance zone at $1.45 to $1.50 but selling at higher levels has pulled the price back into the zone.
If the price rebounds off the 20-EMA, the bulls will make one more attempt to resume the up-move. A breakout and close above $1.63 could clear the path for a rally to $1.80. This positive view will invalidate if the price turns down and breaks below $1.45.
FTM/USDT
Fantom’s FTM token is in a strong uptrend. The bulls successfully defended the breakout level at $1.94, indicating that sentiment remains positive and traders are buying on dips.

FTM/USDT daily chart. Source: TradingView
The upsloping moving averages indicate advantage to buyers but the negative divergence on the RSI is warning that the bullish momentum may be weakening. If bulls push the price above $2.45, the uptrend may continue, with the next target objective at $3.20.
On the other hand, if the price turns down from $2.45, the FTM/USDT pair may drop to $1.94 and consolidate between these two levels for a few days. A break and close below the 20-day EMA ($1.85) may signal the start of a deeper correction.
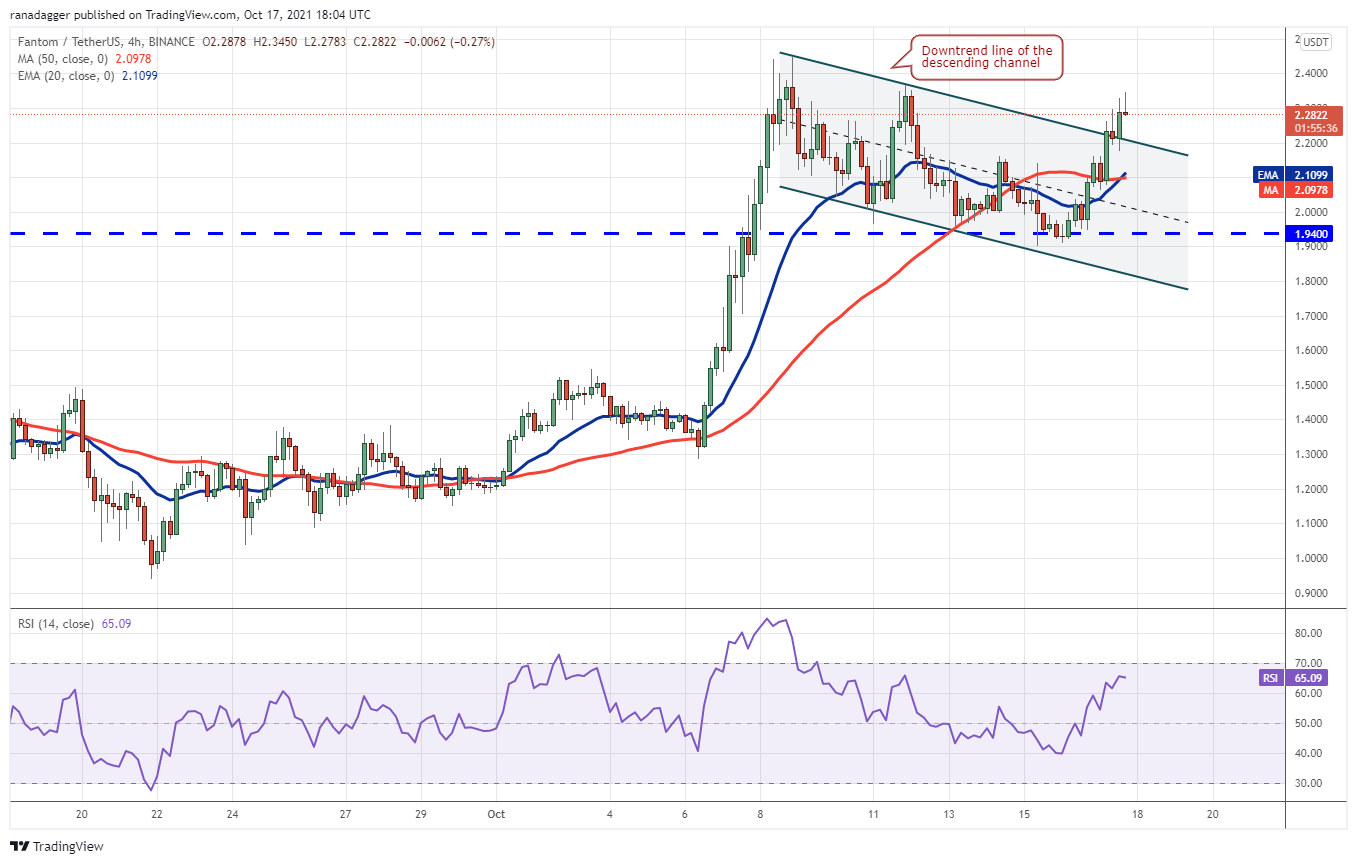
FTM/USDT 4-hour chart. Source: TradingView
The bulls are currently attempting to sustain the price above the descending channel. If they manage to do that, the pair could rise to $2.45. This level may act as stiff resistance but if bulls overcome it, the uptrend may resume.
Alternatively, if the price fails to sustain above the channel, it will suggest that demand dries up at higher levels. The pair may then continue to trade inside the channel. A break and close below the channel could pull the pair down to $1.50.
Author

Cointelegraph Team
Cointelegraph
We are privileged enough to work with the best and brightest in Bitcoin.


