Top 3 price prediction BTC, ETH, XRP: Why Bitcoin’s upcoming halving may send it above $150,000
- Acceptance as a reservoir of value can enhance the upward momentum following halving.
- The approximate date for the event is May 13, 2020.
- In the short term, price weakness can provide one-time buying opportunities.

Imagine if you could predict the reduction of the supply of a commodity by 50%. As a smart investor, anyone would see a business opportunity.
Now, let's put ourselves in a situation where that commodity is considered so valuable that people will shelter part of their savings in it. It could be Gold, a Picasso painting or a Ferrari 250 GTO.
What about Bitcoin?
What makes an object or material a store of value is the law of supply and demand. No one, absolutely no one would pay $70 million for a car like the 250 GTO if it weren't for someone before him who was willing to pay $69.5 million. And before that $69 million. It is a case of a limited offer since only 36 units were ever made.
The Blockchain technology that sustains Bitcoin is constructed on several invariable premises. The first of them dictates that only 21 million can be mined.
Other assumptions state that from time to time, the supply of Bitcoins received by the miners is halved. The impact of this step has direct consequences for Bitcoin’s price.
One of the main characteristics of Bitcoin is its scarcity. When a halving occurs, the impact on the flow of supply is immediate. It is not only a shortage in the total supply but also in the flow of new Bitcoins available annually.
We must also take into account the cost of mining. When supply halves, miners see their costs doubled immediately until new processors allow for some mitigation of that cost increase.
At the time of writing, there are 18,008,250 Bitcoins in circulation, and slightly more than 366,750 will become available until the next halving. According to bitcoinblockhalf.com, there are currently 203 days and 15 hours left for this to happen.
In the two previous halvings, the price evolved to the rise of the explosive form:
- In the first halving (11/28/2012), the Bitcoin was valued at $12 and then leaped to a peak price of $1,163 or 96X.
- The second halving(7/9/2016), Bitcoin was valued at $658 and reached $19,982 or 30X.
- The third halving will occur around May 13, 2020, although we don't know the starting point and target. (see chart)
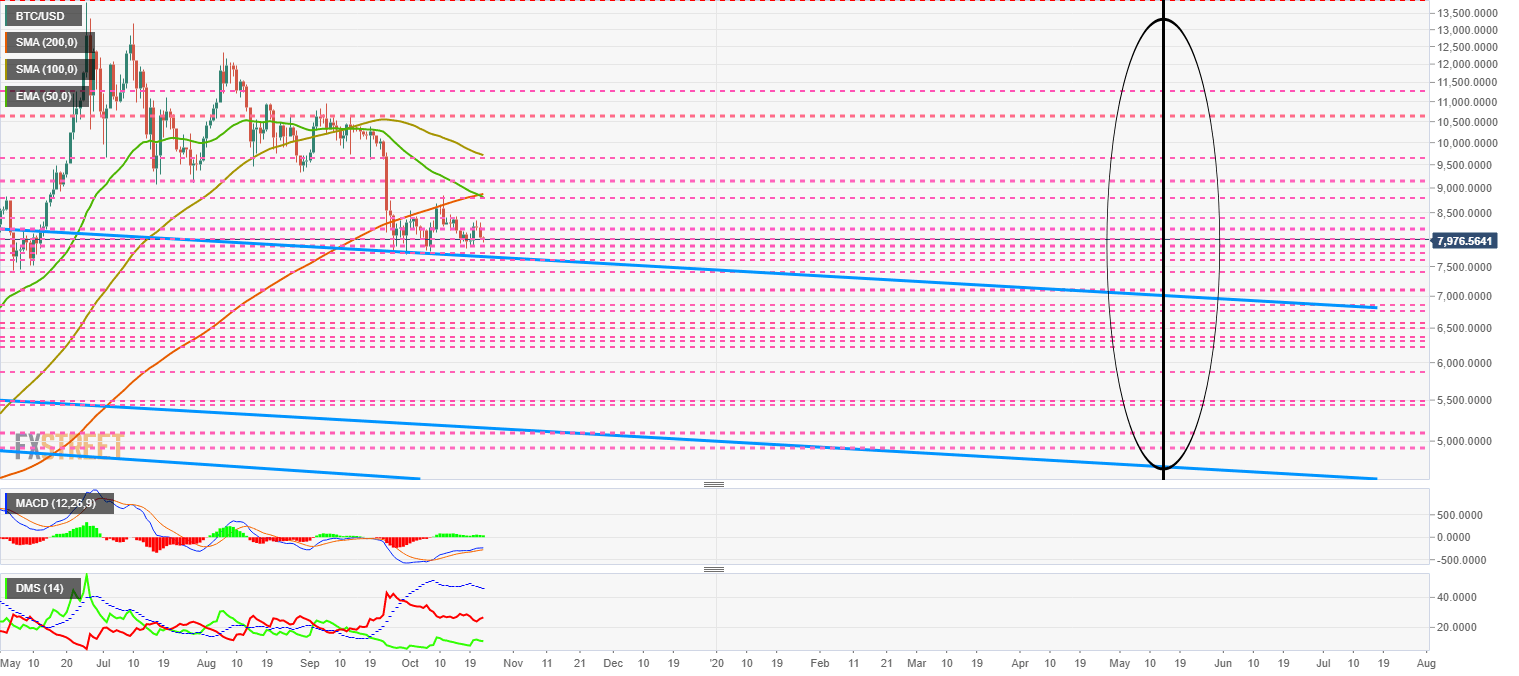
We can apply a conservative approach assuming a downfall in prices ahead of the event. Moreover, we can curb the enthusiasm and project a more moderate multiplication. Even with all the caution – a rise to above $150,000 cannot be ruled out.
ETH/BTC Daily Chart
ETH/BTC is trading at 0.0208 and is struggling to stay above the EMA50. The bearish phase of the technical consolidation itself continues and enters a sequence of progressively increasing volatility.
Above the current price, the first resistance level is at 0.0221, then the second at 0.0228 and the third one at 0.025.
Below the current price, the first support level is at 0.0208, then the second at 0.020 and the third one at 0.019.
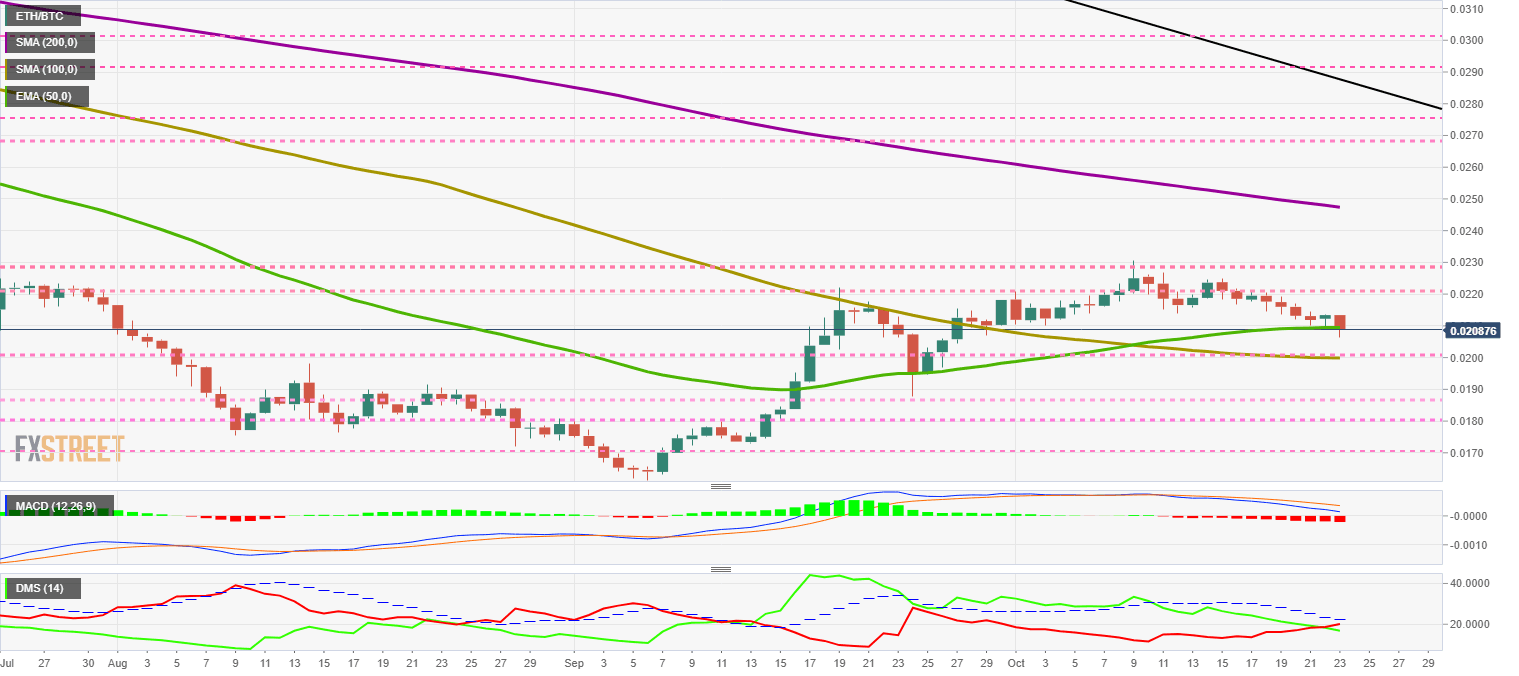
The MACD on the daily chart widens the bearish slope as the opening between the lines increases. The critical moment will occur upon reaching the zero level of the indicator.
The DMI on the daily chart provides us with a critical piece of data. The bears move above the bulls for the first time since September. The situation of bulls and bears below the ADX line favors that there may be a sudden change at the top.
BTC/USD Daily Chart
Bitcoin is currently trading at $8,006 price level and still retains some margin on the roof of the ultra long term bearish channel.
Above the current price, the first resistance level is at $8,200, then the second at $8,400 and the third one at $8,850.
Below the current price, the first support level is at $7,850, then the second at $7,760 and the third one at $7,650.
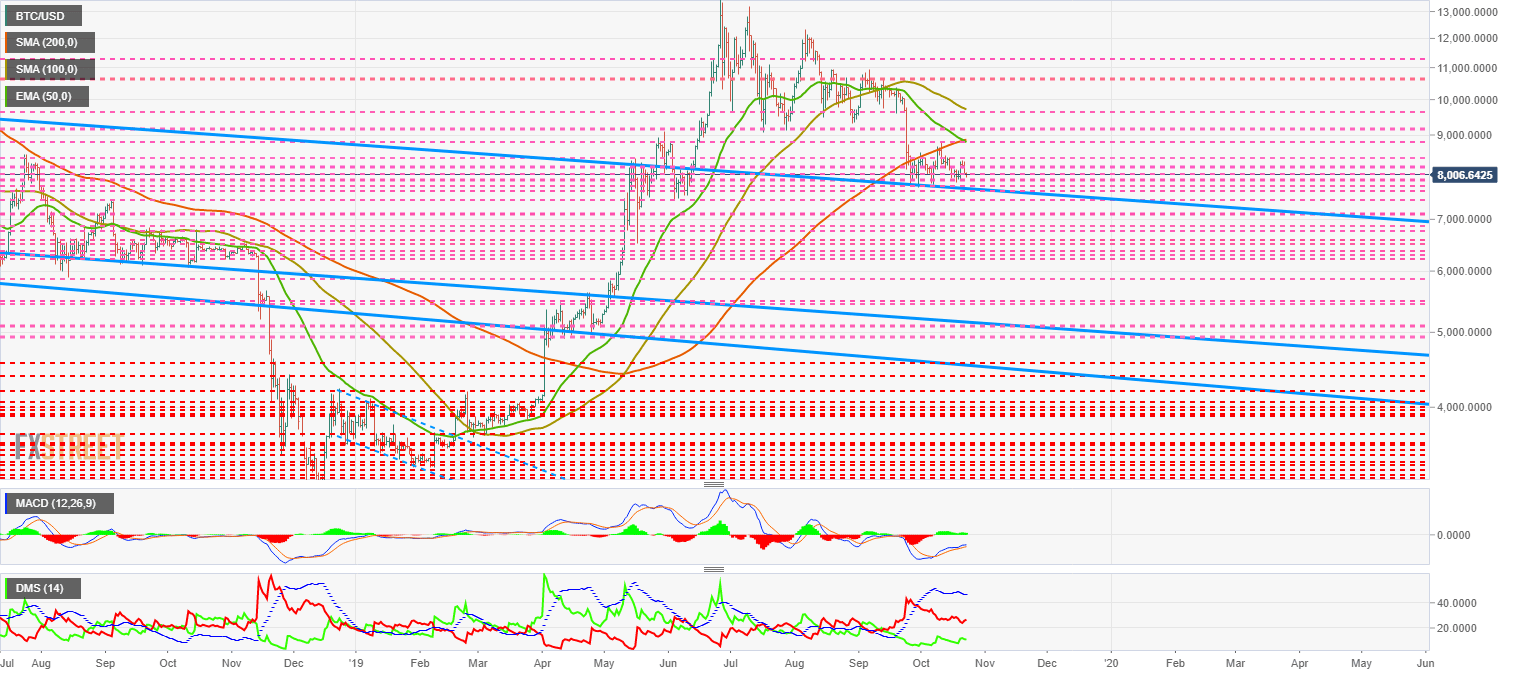
The MACD on the daily chart remains strongly inclined to the upside, showing a substantial divergence with the current price behavior. Sometimes this type of structure drops suddenly and has a very negative impact on the price.
The DMI on the daily chart shows bears moving higher as bulls move lower. The bears may be looking for a confirmation of the ADX line, which opens up a bearish scenario that could extend for a couple of weeks.
ETH/USD Daily Chart
ETH/USD is currently trading at $167.5 after losing the $180 support line early in the day.
Above the current price, the first resistance level is at $170, then the second at $180 and the third one at $185.
Below the current price, the first support level is at $160, then the second at $155 and the third one at $150.
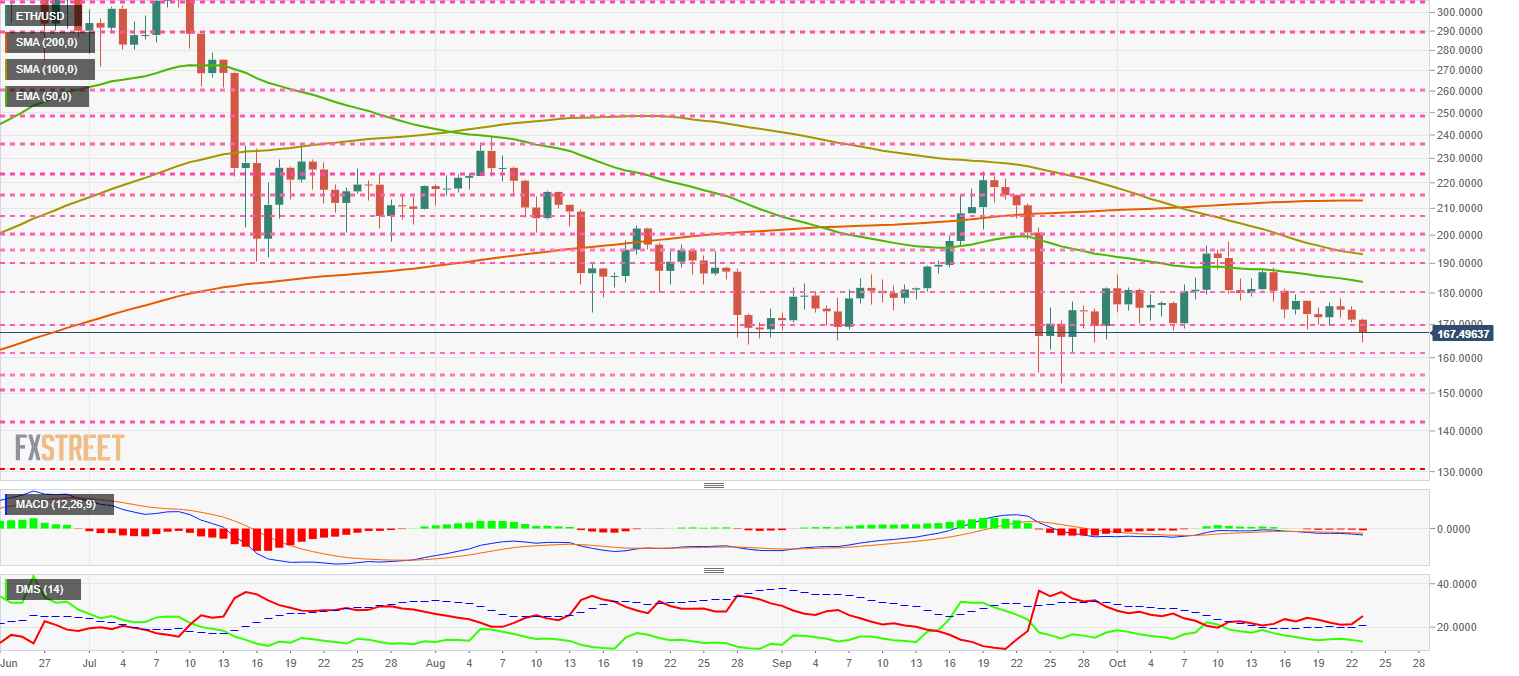
The MACD on the daily chart shows a lack of bullish momentum to breach the zero line of the indicator. If the situation does not improve in the short term, it could deteriorate rapidly.
The DMI on the daily chart shows the bears reacting strongly to the upward movement. Bulls also retreat quickly and give absolute control to the selling side.
XRP/USD Daily Chart
XRP/USD is currently trading at $0.289 and confirms that Ripple’s token is the most active component of the Top3 at the moment.
Above the current price, the first resistance level is at $0.293, then the second at $0.297 and the third one at $0.30.
Below the current price, the first support level is at $0.288, then the second at $0.285 and the third one at $0.28.
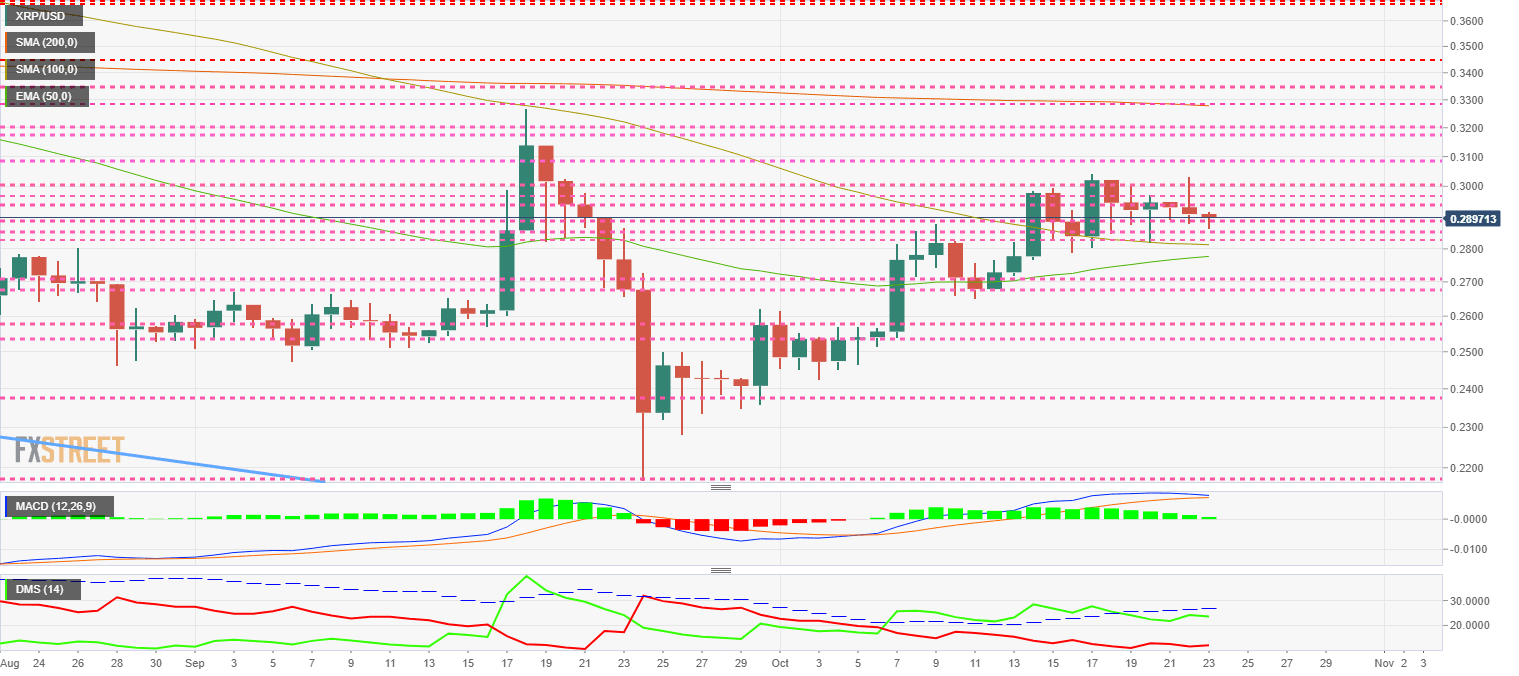
The MACD on the daily chart shows a significant loss of momentum and is very close to the bearish cross. The price may have some violent reaction to the upside, but the trend will be bearish.
The DMI on the daily chart shows that the bulls are losing strength while the bears stop the falls without reacting to the upward movement.
Get 24/7 Crypto updates in our social media channels: Give us a follow at @FXSCrypto and our FXStreet Crypto Trading Telegram channel
Author

Tomas Salles
FXStreet
Tomàs Sallés was born in Barcelona in 1972, he is a certified technical analyst after having completing specialized courses in Spain and Switzerland.


