Top 3 price prediction BTC, ETH, XRP: The market freezes between averages
- An extreme drop in volatility triggers a move to the limits of technical resistance.
- Only Stellar Lumens stands out among the ten top cryptos.
- XRP has trouble staying above $0.30.

On the day of the dead, the crypto market seems to want to add to the gloomy mood.
Among the top ten projects, only Stellar Lumens is still enjoying a Halloween party with an intraday rise of 10%. The reason for that increase is the elimination of inflationary practices in its latest update.
The technical analysis reinforces the movement and promises price increases in the short term.
At the time of writing, XLM is above the SMA100 and enjoys the added support at the EMA50.
-637081993249358720.png&w=1536&q=95)
The broad bearish wedge the digital coin is in points towards the upper resistance line, where the SMA200 appears to bring more difficulty to a possible scenario change.
Traders are closely following the moves in Stellar because of the upside potential it holds within – by only recovering 50% of what has fallen from the 2018 highs – it quintuples its value.
ETH/BTC Daily Chart
ETH/BTC is currently trading at 0.0198 and is still fighting for another day at the 0.020 level. The support provided by the SMA100 is vital to success.
Above the current price, the first resistance level is at 0.020, then the second at 0.0207 and the third one at 0.022.
Below the current price, the first support level is at 0.019, then the second at 0.018 and the third one at 0.017.
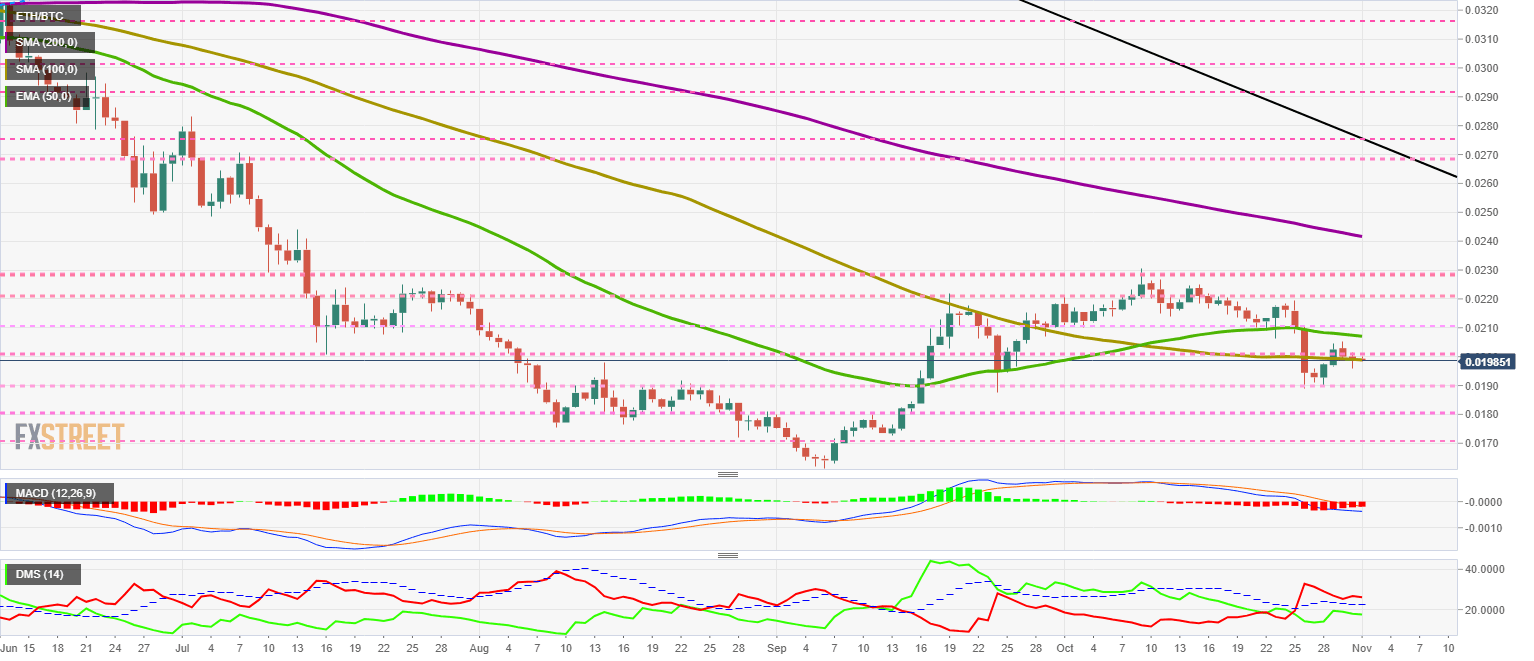
The MACD on the daily chart softens the bearish slope and signals interest in attacking the bullish trend again.
The DMI on the daily chart shows us how the bears retain control of the ETH/BTC pair as they manage to stay above the ADX line. The bulls are moving higher and could make an upward attempt in the next few days.
BTC/USD Daily Chart
BTC/USD trades at $9,117 and sublimates the concept of immobility.
BTC/USD remains between the main moving averages, which continue to shrink spaces and drown the price.
Above the current price, the first resistance level is at $9,600, then the second at $10,500 and the third one at $11,275.
Below the current price, the first support level is at $9,000, then the second at $8,800 and the third one at $8,500.

The MACD on the daily chart continues its bullish progression despite the price stagnation. Moving averages are clearly on the bullish side and support price improvement when Bitcoin manages to revive its absent volatility.
The DMI on the daily chart shows the bulls in a fantastic bullish position, which could be much better if it could surpass the ADX line. Bears remain below level 20, which means that it lacks trend strength.
ETH/USD Daily Chart
ETH/USD is currently trading at $181.2 and almost replicates Bitcoin’s technical situation.
Above the current price, the first resistance level is at $190, then the second at $195 and the third one at $200.
Below the current price, the first support level is at $180, then the second at $170 and the third one at $162.
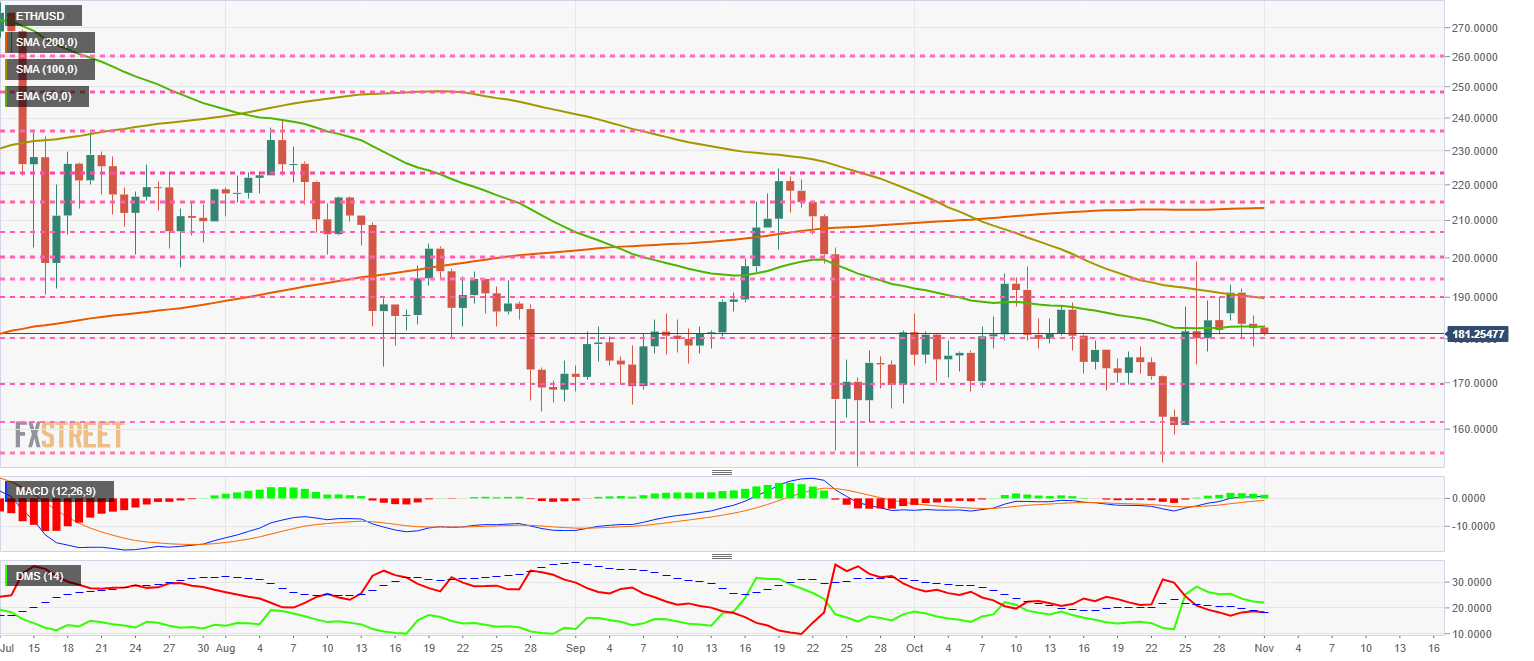
The MACD on the daily chart shows a very flat profile, although it retains the distance between the lines, a positive figure for the price. Moving averages move in the neutral zone of the indicator.
The DMI on the daily chart shows the differences between BTC/USD and ETH/USD. Bulls move above the ADX line, a sign that the bullish momentum is still active. The bears fail in their attempt to breach the ADX line and confirm their current weakness.
XRP/USD Daily Chart
XRP/USD is currently trading at $0.291. The XRP has more free space than its analysis partners but is moving similarly.
Above the current price, the first resistance level is at $0.296, then the second at $0.30 and the third one at $0.31.
Below the current price, the first support level is at $0.289, then the second at $0.285 and the third one at $0.282.

The MACD on the daily chart confirms the bearish cross. The profile is flat, and there is no distance between lines but the most likely development is bearish.
The DMI on the daily chart is determined to contradict the MACD. Bulls remain above the ADX line, and therefore the momentum is bullish, while bears remain horizontal with no apparent intention of disputing the leadership.
Get 24/7 Crypto updates in our social media channels: Give us a follow at @FXSCrypto and our FXStreet Crypto Trading Telegram channel
Author

Tomas Salles
FXStreet
Tomàs Sallés was born in Barcelona in 1972, he is a certified technical analyst after having completing specialized courses in Spain and Switzerland.


