- Recent price movement puts Bitcoin back on a price rising scenario.
-
Ethereum and XRP, with fewer profits, get better setups than Bitcoin for the medium term.
-
Volatility may increase sharply in the short term.
In my Friday article, the headline request the Bitcoin to take advantage of the unique opportunity to get out of the technical breakage problem it was in.
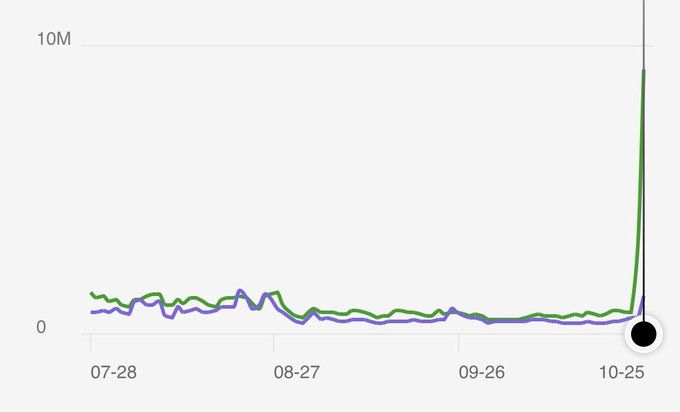
A few hours later, Chinese Prime Minister Xi Jinping pointed out the blockchain technology as a strategic objective of the country and betting on leading its adoption by the vast Chinese economy.
The impact was immediate, with a massive increase in WeChat searches for the term Blockchain.
The most benefited by the surprising announcement are, Bitcoin apart, Altcoin projects with Chinese origin, such as EOS, TRX or ONT with increases of the order of 30% today.
The reaction in the Bitcoin quotation is spectacular. Extreme rises, in some moments above 30%, which took the BTC/USD pair out of the high-risk bearish scenario.
But has the movement to take Bitcoin out of the bearish scenario been effective? Indeed, although it has not managed to beat $9,650 at the close, so it remains in an intermediate zone, turbulent in between.
If there is no close above the SMA200 on daily charts, we can expect intense price swings.
ETH/BTC Daily Chart
The ETH/BTC pair has suffered significant declines due to the Ethereum's inability to keep up with King Bitcoin. The pair lost the EMA50 and the SMA100 on Friday, and the price dropped the 0.020 level.
The pair is currently trading at 0.01942.
Below the current price, the first resistance level is at 0.020, the second at 0.021 and the third one at 0.022.
Above the current price, the first support level is at 0.0187, then the second at 0.018 and the third one at 0.0173.
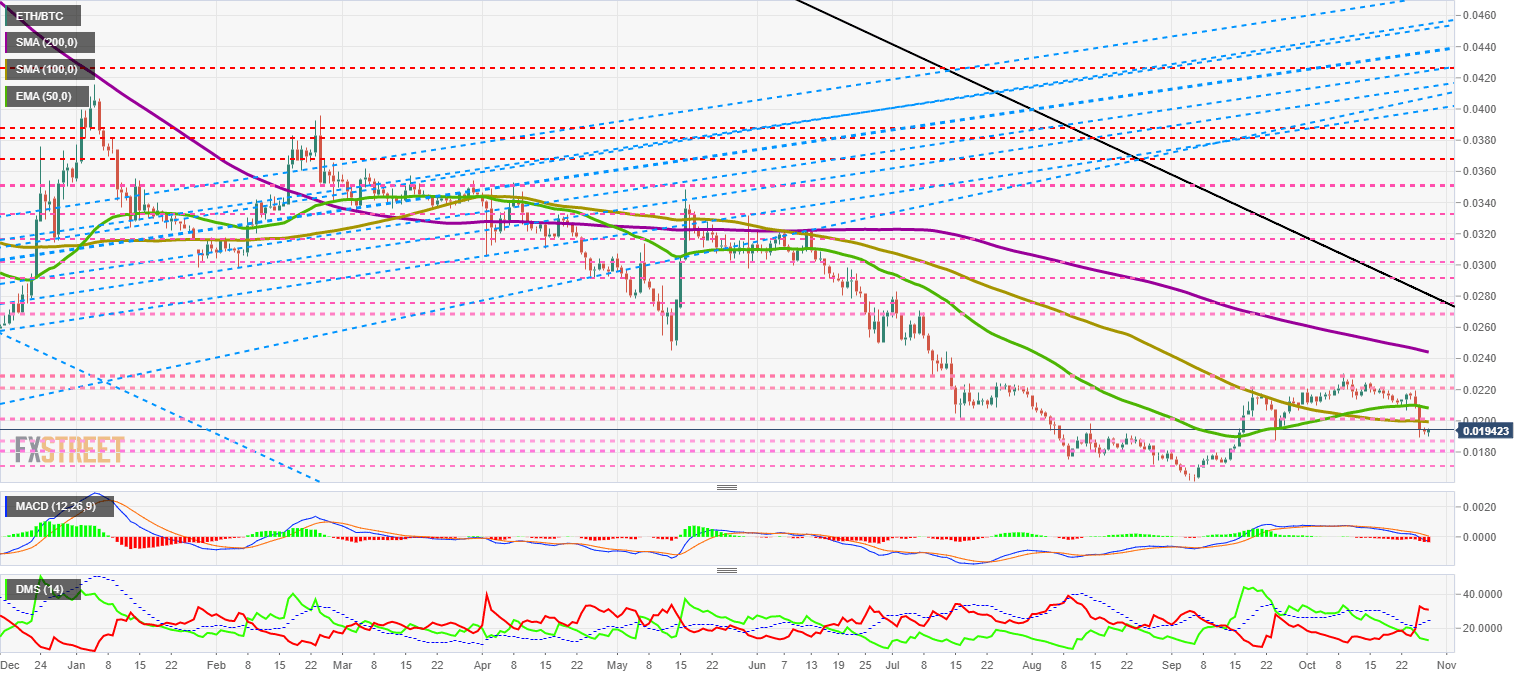
The MACD on the daily chart shows how the moving averages increase the bearish profile as well as the amplitude between the lines. The indicator enters the bearish zone and worsens the pattern in the short term.
The DMI on the daily chart shows how the bears are reacting very strongly to the bullish trend. The bulls moved down and lost the 20 level that signals an ongoing trend.
BTC/USD Daily Chart
The BTC/USD is currently trading at the $9,378 price level and marks the third day in a row that it is unable to close above the SMA200, which is trading at $9,650.
Above the current price, the first resistance level at $9,650, then the second at $10,550 and the third one at $11,300.
Below the current price, the first support level is at $9,150, then the second at $8,900 and the third one at $8,450.
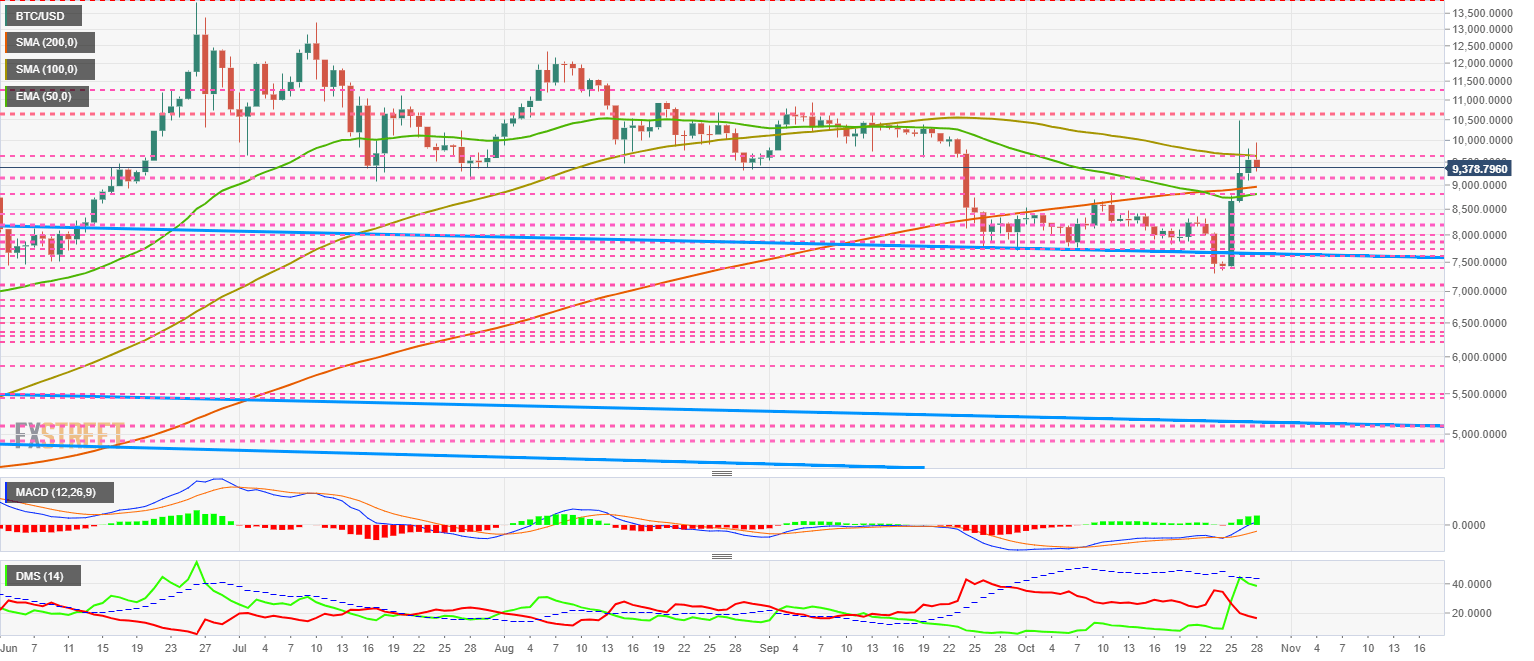
The MACD on the daily chart increases its bullish profile and also the distance between moving averages. The averages enter slightly into the bullish zone, subtracting some strength from the momentum.
The DMI on the daily chart shows a worrying signal that needs to be watched closely. Bulls go up with a lot of force but are unable to overcome the ADX line, a sign that there is more resistance than it may seem.
ETH/USD Daily Chart
The ETH/USD is currently trading at the $183.6 price level, up sharply from last week's levels.
It seems that Ethereum has once again been the least rewarded by the bullish momentum, but a detailed analysis gives us another piece of information.
Above the current price, the first resistance level is at $190, then the second at $195 and the third one at $200.
Below the current price, the first support level is at $180, then the second at $170 and the third one at $160.
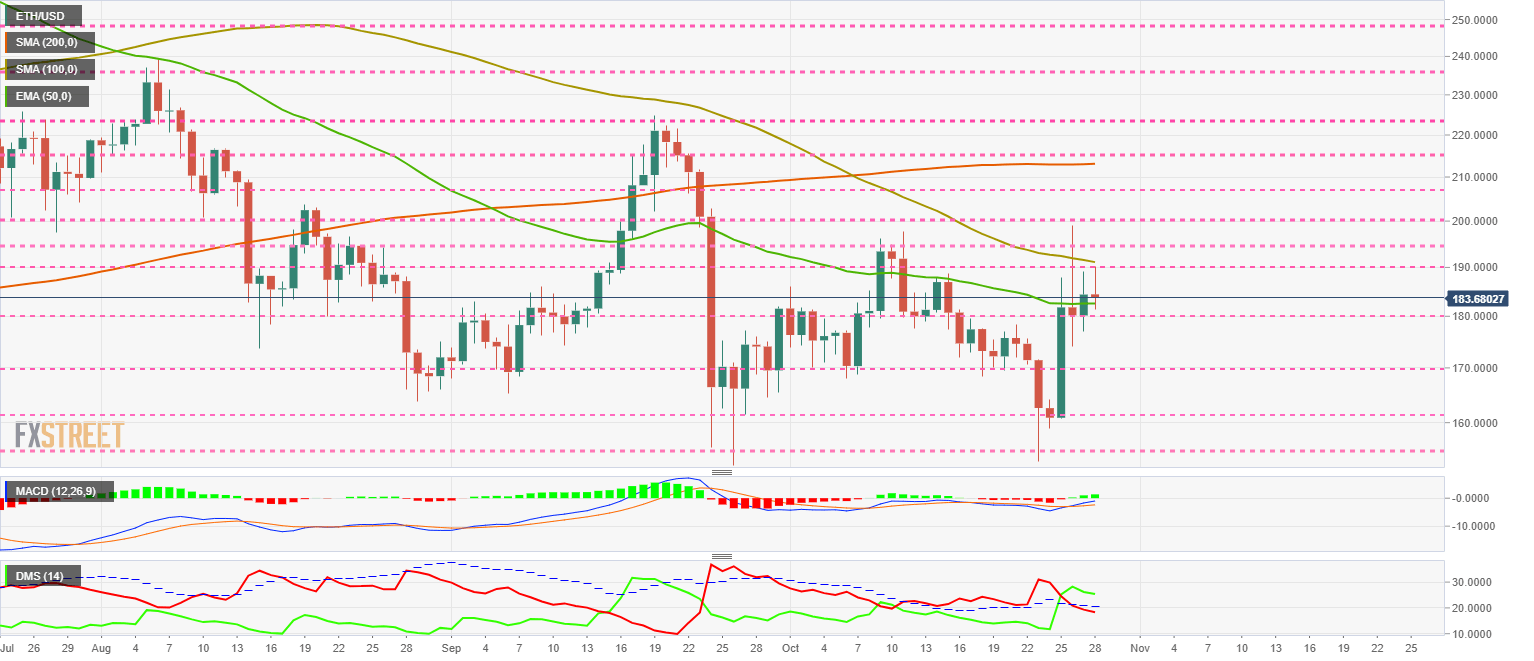
The MACD on the daily chart crosses upwards and remains in the negative zone of the indicator, although with a good chance of turning the situation around.
The DMI on the daily chart shows us how in the case of the ETH/USD pair, the bulls do manage to break the ADX line upwards and are set to continue rising. The bears, on the other hand, lose the level 20 and the support, opening a scenario of bearish continuity.
XRP/USD Daily Chart
The XRP/USD is currently trading at the $0.2978 price level and confirms that the price level to be beaten is $0.30. While last week's price declines strongly affected the XRP price, it doesn't look like the declines are working as well.
Above the current price, the first resistance level is at $0.30, then the second at $0.31 and the third one at $0.32.
Below the current price, the first support level is at $0.295, then the second at $0.29 and the third one at $0.285.
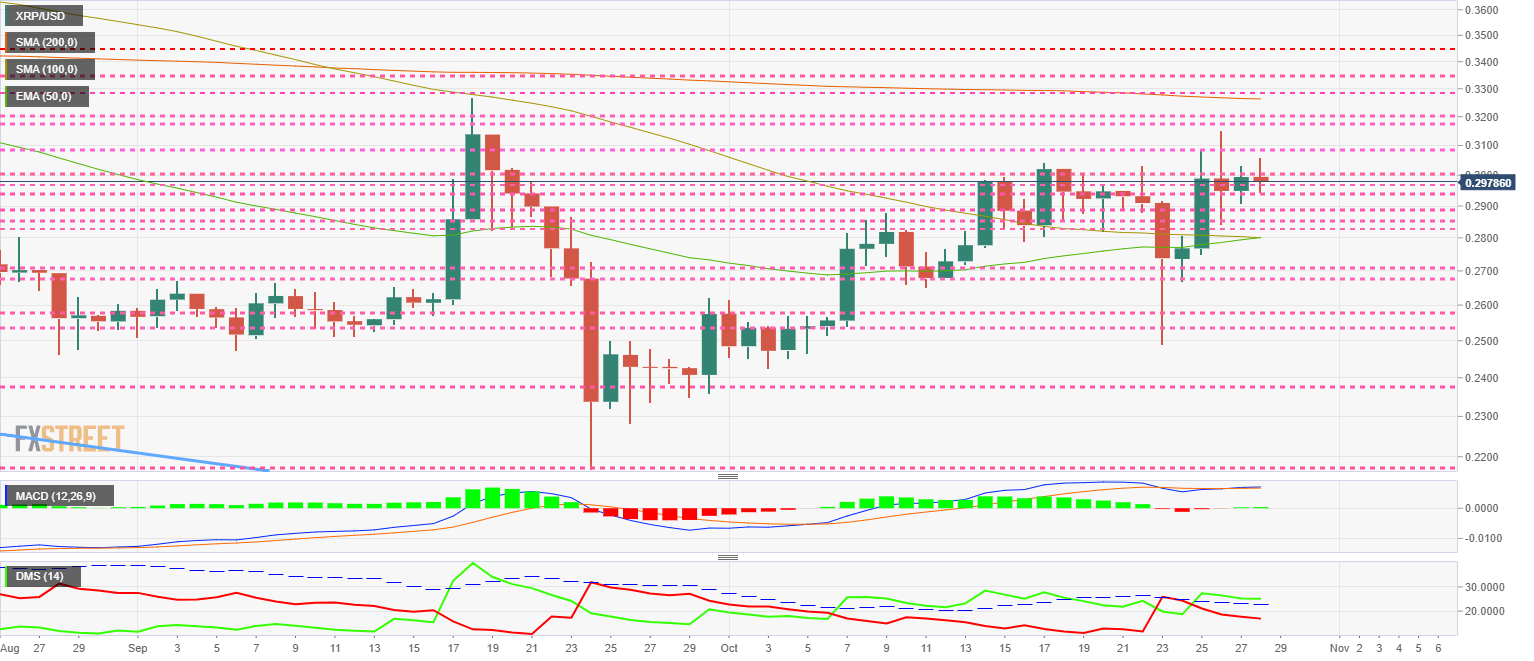
The MACD on the daily chart appears completely flat with hardly any distance between the lines. It gives us a clear picture of the situation and development in the short term. Active volatility chapters are likely to appear in the XRP/USD pair.
The DMI on the daily chart shows how the bulls manage to stay above the ADX line and even improve from last week's levels. The bears fall below the 20 levels of the indicator and propose to continue to fall.
Get 24/7 Crypto updates in our social media channels: Give us a follow at @FXSCrypto and our FXStreet Crypto Trading Telegram channel
Information on these pages contains forward-looking statements that involve risks and uncertainties. Markets and instruments profiled on this page are for informational purposes only and should not in any way come across as a recommendation to buy or sell in these assets. You should do your own thorough research before making any investment decisions. FXStreet does not in any way guarantee that this information is free from mistakes, errors, or material misstatements. It also does not guarantee that this information is of a timely nature. Investing in Open Markets involves a great deal of risk, including the loss of all or a portion of your investment, as well as emotional distress. All risks, losses and costs associated with investing, including total loss of principal, are your responsibility. The views and opinions expressed in this article are those of the authors and do not necessarily reflect the official policy or position of FXStreet nor its advertisers. The author will not be held responsible for information that is found at the end of links posted on this page.
If not otherwise explicitly mentioned in the body of the article, at the time of writing, the author has no position in any stock mentioned in this article and no business relationship with any company mentioned. The author has not received compensation for writing this article, other than from FXStreet.
FXStreet and the author do not provide personalized recommendations. The author makes no representations as to the accuracy, completeness, or suitability of this information. FXStreet and the author will not be liable for any errors, omissions or any losses, injuries or damages arising from this information and its display or use. Errors and omissions excepted.
The author and FXStreet are not registered investment advisors and nothing in this article is intended to be investment advice.
Recommended Content
Editors’ Picks

Bitcoin Weekly Forecast: Slow but positive start
Bitcoin edges slightly lower, trading around $96,500 on Friday after an over 2.5% recovery this week, with historical data showing modest average January returns of 3.35%. On-chain metrics suggest the bull market remains intact, indicating a cooling-off phase rather than a cycle peak.

Stellar bulls aim for double-digit rally ahead
Stellar extends its gains, trading above $0.45 on Friday after rallying more than 32% this week. On-chain data indicates further rally as XLM’s Open Interest and Total Value Locked rise. Additionally, the technical outlook suggests a rally continuation projection of further 40% gains.

BTC, ETH and XRP eyes for a rally
Bitcoin’s price finds support around its key level, while Ethereum’s price is approaching its key resistance level; a firm close above it would signal a bullish trend. Ripple price trades within a symmetrical triangle on Friday, a breakout from which could signal a rally ahead.

Could XRP surge to new highs in January 2025? First two days of trading suggest an upside bias
Ripple's XRP is up 7% on Thursday, extending its rally that began during the New Year's Day celebration. If long-term holders (LTH) continue their recent accumulation, XRP could overcome the $2.9 resistance level and aim for a new all-time high.

Bitcoin: 2025 outlook brightens on expectations of US pro-crypto policy
Bitcoin price has surged more than 140% in 2024, reaching the $100K milestone in early December. The rally was driven by the launch of Bitcoin Spot ETFs in January and the reduced supply following the fourth halving event in April.

Best Forex Brokers with Low Spreads
VERIFIED Low spreads are crucial for reducing trading costs. Explore top Forex brokers offering competitive spreads and high leverage. Compare options for EUR/USD, GBP/USD, USD/JPY, and Gold.