- The ceiling of the bear channel stops an army of Bitcoiners ready to go to the Moon.
- ETH/USD may extend its gains despite Bitcoin weakness.
- XRP/USD is facing increased volatility.
It is mid-morning in Europe, and the market continues with the tonic seen during the weekend of retreat and hammering of the roof of the long term bearish channel. For now, the wall resists, and the market reacts with increased lurching.
The overall structure is not conducive to an upward break in the short term, and if the market achieves this, is likely to consume a considerable amount of capital, and significant consolidation will be necessary.
In the meantime, the ETH/BTC cross continues to project the upward parallel line structure, and after the recent rises, a new lower parallel is drawn.
Long-term moving averages rotate upwards and enter the sequence of crosses that are likely to bring additional volatility until everything aligns upwards.
ETH/BTC Daily Chart
ETH/BTC is currently trading at the price level of 0.0316, just above the support by price congestion at 0.0315. The second support level is at 0.0305 (EMA50 and lower parallel bullish trend line and SMA200), then the third support level is 0.0291 (price congestion support and SMA100).
Above the current price, the first resistance level is at 0.033 (price congestion resistance and second upper parallel trendline), then the second resistance level for the ETH/BTC pair is at 0.035 (price congestion resistance and third upper parallel trendline). The third resistance level is at 0.037 (parallel bullish trend line).
-636939431342735078.png)
The MACD on the daily chart shows a very steep bearish cross profile. It remains in the positive zone of the indicator, and when it approaches the neutral level, we will have to pay attention to whether it stops the decline or dives deeper in negative territory, which would have severe consequences for the market.
The DMI on the daily chart shows a technical tie between the two sides of the market that is both at the level that indicates the presence of the trend or the lack thereof. The ADX sinks and faithfully represents the overall loss of momentum after the gains of the past few weeks.
BTC/USD Daily Chart
BTC/USD is currently trading at $7.877 after the morning attempt to beat the long term bullish channel ceiling by $8.240. The Japanese candlestick figure that is being drawn is complete in its upper zone, so if it closes at around $7.250 or lower, it will form a powerful bearish hedge.
Below the current price, BTC/USD has its first support level at $7,750 (price congestion support), then the second support level is at $7,600 (price congestion support). The third level of support is at $7,400 (price congestion support).
Above the current price, the BTC/USD pair has the first resistance level of $8,000 (price congestion resistance), then the second resistance level is at $8,250 (price congestion resistance). The third resistance level is at $8,400 (price congestion resistance), a level that would give the bullish signal to the real bull market ahead of Bitcoin.
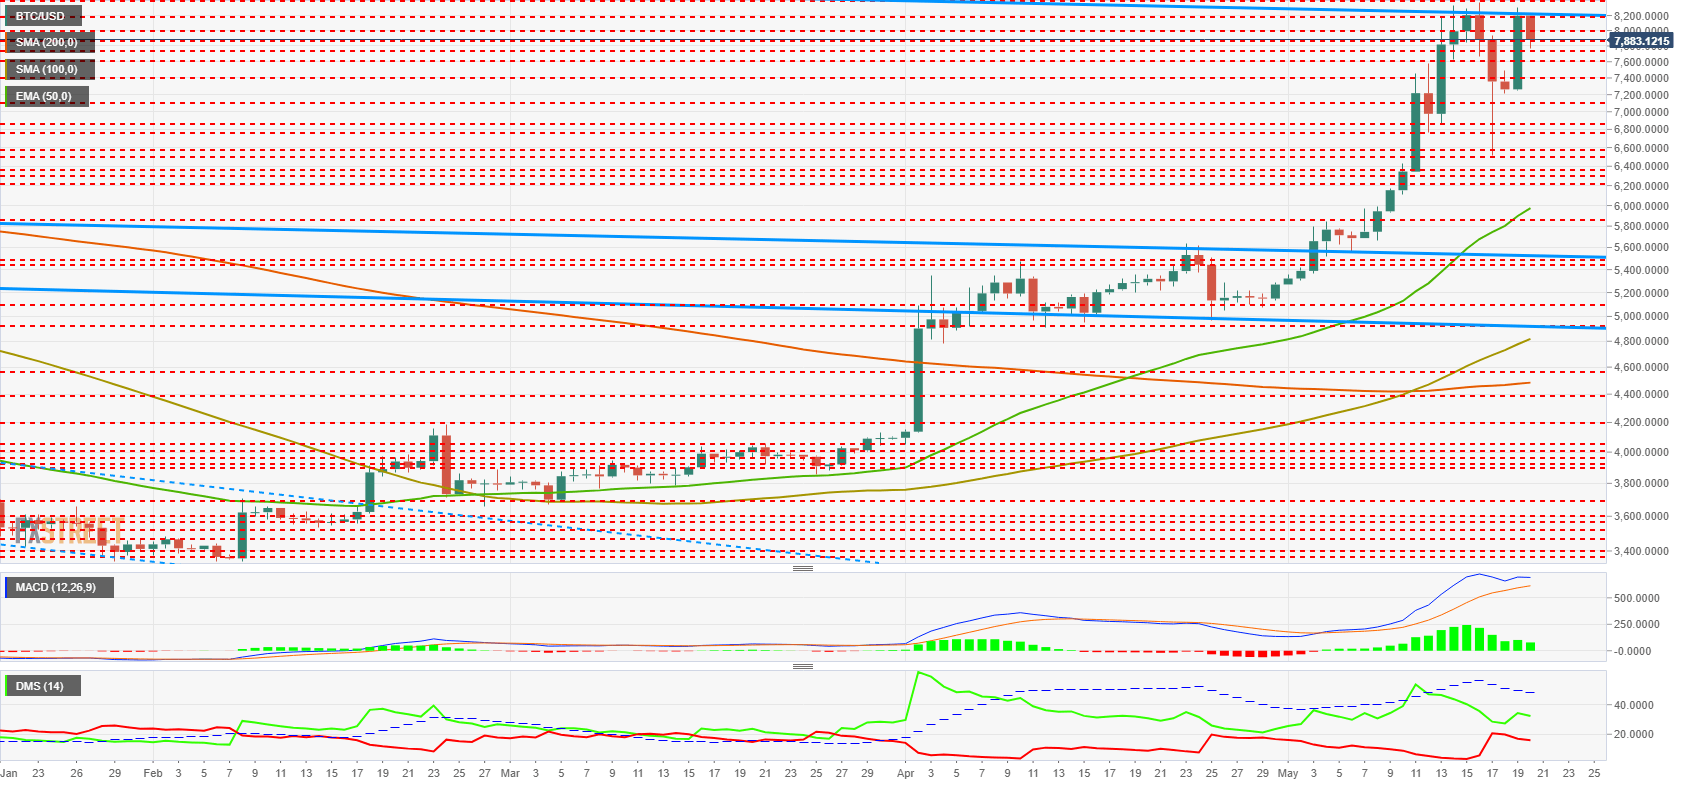
The MACD on the daily chart shows a bullish exhaustion structure and is heading for a more than likely bearish cross. This situation can be lengthened to the extreme.
The DMI on the daily chart shows bulls still ahead of bears. The bearish side's representatives have increased their strength in the last few days, and may soon be in a position to dispute the leadership of the bullish side's representatives.
ETH/USD Daily Chart
ETH/USD is currently trading at the $249 price level, based on the BTC/USD drawing.
Below the current price, the first support level for ETH/USD is $235 (price congestion support), then the second support level for ETH/USD is $224 (price congestion support). The third level of support is at $215 (price congestion support).
Above the current price, the first resistance level is $260 (price congestion resistance), so the second resistance level is $280 (relative maximum). The third resistance level for ETH/USD is at $290 (price congestion resistance).
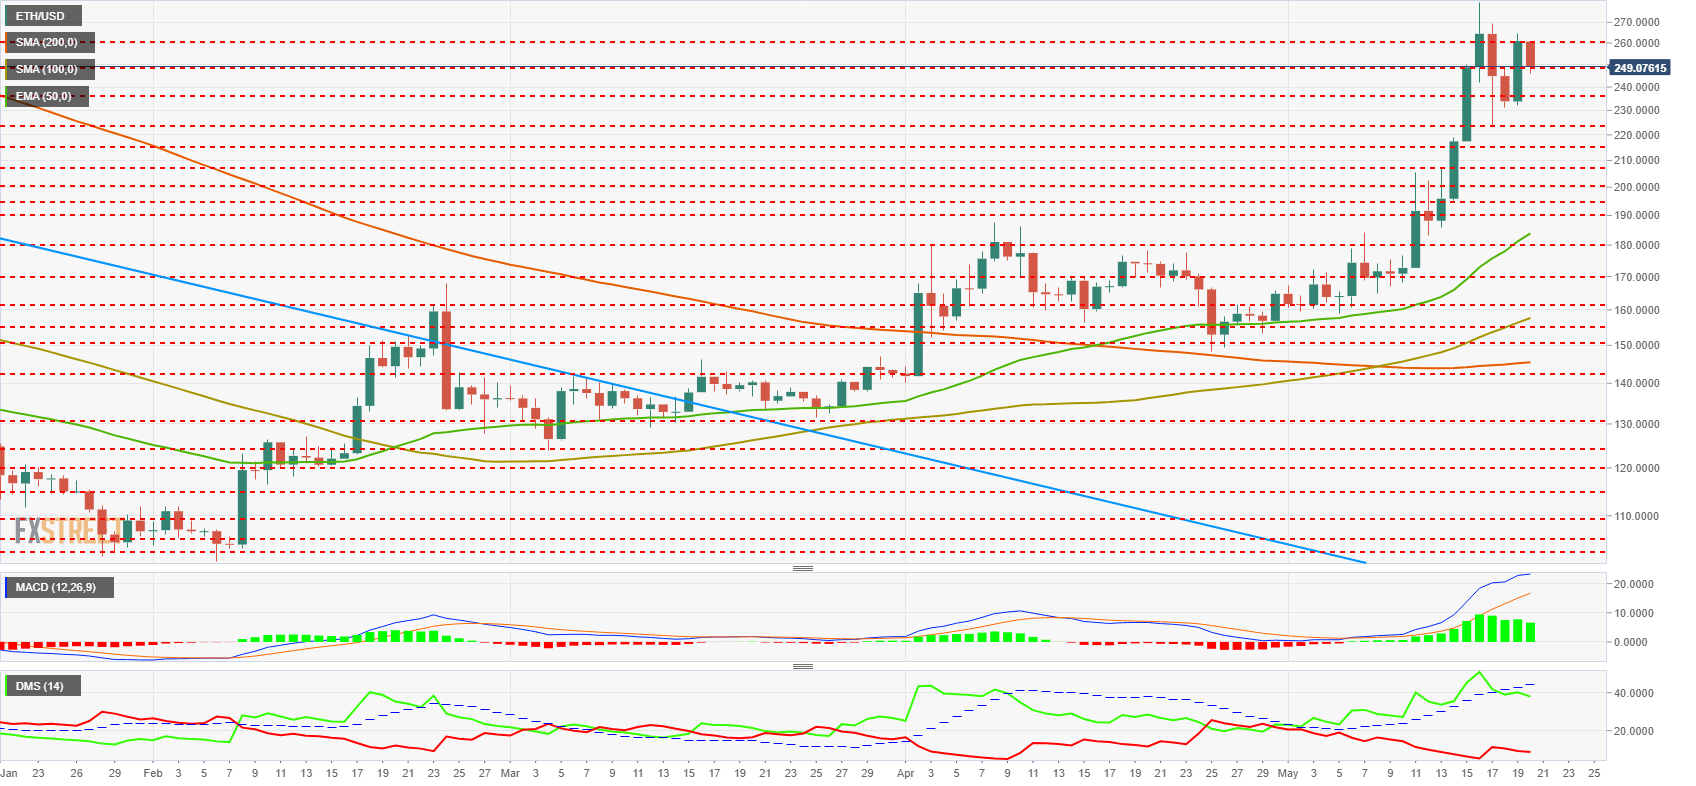
The MACD on the daily chart shows a profile where the bullish force begins to relax but still has a significant uptrend and good opening between the lines.
The DMI on the daily chart shows bulls dominating the market with clarity but that it is placed below the ADX line and initiates a pattern of exhaustion of the buyer side dominance.
XRP/USD Daily Chart
The XRP/USD is trading at $0.395 after a weekend of high intraday volatility that has driven the Ripple star product from $0.47 up to $0.368 down.
Below the current price, the first support level for the XRP/USD pair is $0.39 (price congestion support), then the second support level is $0.37 (price congestion support). The third level of support is at $0.35, a stable zone where the SMA200, the EMA50, and a price congestion support appear.
Above the current price, the first resistance level is $0.412 (price congestion resistance), then the second resistance level is $0.43 (price congestion resistance). The third resistance level is at $0.44 (price congestion resistance).
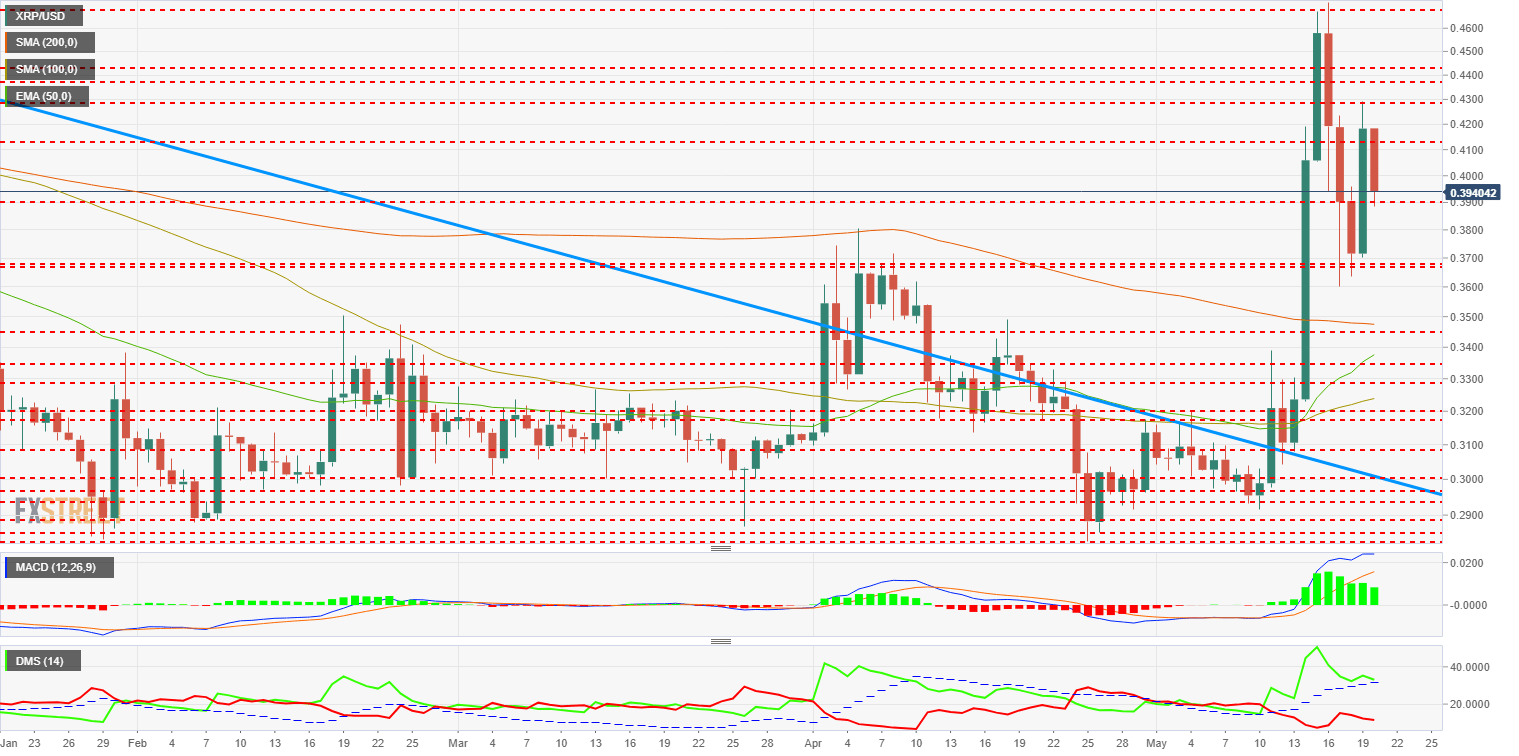
The MACD on the daily chart shows a bullish structure in the depletion phase, although it retains a good opening between the lines and a significant uptrend in the slow average. With this profile, the rises can continue, but in a weak environment.
The DMI on the daily chart shows bulls in control of the market and still above the ADX line but for a short time, as the bulls lose strength and head towards a cross below the trend strength indicator. I want to highlight that the bears do not believe this weakness and withdraw after increasing their trend strength at the end of last week.
Get 24/7 Crypto updates in our social media channels: Give us a follow at @FXSCrypto and our FXStreet Crypto Trading Telegram channel
Information on these pages contains forward-looking statements that involve risks and uncertainties. Markets and instruments profiled on this page are for informational purposes only and should not in any way come across as a recommendation to buy or sell in these assets. You should do your own thorough research before making any investment decisions. FXStreet does not in any way guarantee that this information is free from mistakes, errors, or material misstatements. It also does not guarantee that this information is of a timely nature. Investing in Open Markets involves a great deal of risk, including the loss of all or a portion of your investment, as well as emotional distress. All risks, losses and costs associated with investing, including total loss of principal, are your responsibility. The views and opinions expressed in this article are those of the authors and do not necessarily reflect the official policy or position of FXStreet nor its advertisers. The author will not be held responsible for information that is found at the end of links posted on this page.
If not otherwise explicitly mentioned in the body of the article, at the time of writing, the author has no position in any stock mentioned in this article and no business relationship with any company mentioned. The author has not received compensation for writing this article, other than from FXStreet.
FXStreet and the author do not provide personalized recommendations. The author makes no representations as to the accuracy, completeness, or suitability of this information. FXStreet and the author will not be liable for any errors, omissions or any losses, injuries or damages arising from this information and its display or use. Errors and omissions excepted.
The author and FXStreet are not registered investment advisors and nothing in this article is intended to be investment advice.
Recommended Content
Editors’ Picks

Litecoin Price Prediction: LTC tries to retake $100 resistance as miners halt sell-off
Litecoin price grazed 105 mark on Monday, rebounding 22% from the one-month low of $87 recorded during last week’s market crash. On-chain data shows sell pressure among LTC miners has subsided. Is the bottom in?

Bitcoin fails to recover as Metaplanet buys the dip
Bitcoin price struggles around $95,000 after erasing gains from Friday’s relief rally over the weekend. Bitcoin’s weekly price chart posts the first major decline since President-elect Donald Trump’s win in November.

SEC Commissioner Hester Pierce sheds light on Ethereum ETF staking under new administration
In a Friday interview with Coinage, SEC Commissioner Hester Peirce discussed her optimism about upcoming regulatory changes as the agency transitions to new leadership under President Trump’s pick for new Chair, Paul Atkins.

Bitcoin dives 3% from its recent all-time high, is this the cycle top?
Bitcoin investors panicked after the Fed's hawkish rate cut decision, hitting the market with high selling pressure. Bitcoin's four-year market cycle pattern indicates that the recent correction could be temporary.
Bitcoin: 2025 outlook brightens on expectations of US pro-crypto policy
Bitcoin price has surged more than 140% in 2024, reaching the $100K milestone in early December. The rally was driven by the launch of Bitcoin Spot ETFs in January and the reduced supply following the fourth halving event in April.

Best Forex Brokers with Low Spreads
VERIFIED Low spreads are crucial for reducing trading costs. Explore top Forex brokers offering competitive spreads and high leverage. Compare options for EUR/USD, GBP/USD, USD/JPY, and Gold.