- A close above $8,350 would end the long term bearish trend for Bitcoin.
- Until now, BTC/USD has been within a long-term downward structure.
- XRP/USD may explode upwards if it consolidates the momentum.
Bitcoin continues to advance relentlessly towards the roof of the long-term downspout. This channel has governed the development of the King of cryptocurrencies since the beginning of 2017.
The arrival at this level of resistance should cause a pause in the enormous current upward movement of Bitcoin, a break that should be used by the Altcoins to raise and close the current negative differential against the King.
The ETH/BTC guidance chart continues to show the ongoing bearish trend, despite the sharp rises taking place throughout the Altcoins universe. Bitcoin is doing exceptionally well that very few manage to gain ground.
In the last three weeks, Bitcoin has had a 20% higher net yield versus a basket made of 50% Ethereum + 50% other main Altcoins. This situation should be corrected if the typical pattern is still active, but there is a possibility that the Crypto market has entered another paradigm where things don't work that way.
ETH/BTC Daily Chart
The ETH/BTC crypto cross is trading at the price level of 0.026, after setting a low at 0.02454 and as it continues crushing Altcoiners' morale.
Above the current price, the first resistance level is at 0.0269 (price congestion resistance). The second resistance level for the ETH/BTC pair is at 0.0275 (price congestion resistance and EMA50), then the third resistance level is at 0.029 (price congestion resistance and SMA100).
Below the current price, the first support level should be sought in the early months of 2017. This old support level is at 0.0229 (price congestion support), then the second support level is at 0.0200 (price congestion support). The third level of support for the ETH/BTC pair is at 0.0155 (price congestion support).
-636934241301610041.png)
The MACD on the four-hour chart crossed down again yesterday, and today, it seems to want to try the upside once again. This development must be the natural one as the indicator is in very negative territory, but in the meantime, the bearish trend is still active.
The DMI on the 4-hour chart shows that bears are losing some strength while the bulls do just the opposite and approach the 20 levels of the indicator. A meeting between both sides of the market is possible already today and if Ethereum wins, it could start an Altcoins season that promises to be spectacular.
BTC/USD Daily Chart
BTC/USD is currently trading at $8.225 after reaching the long term bearish channel ceiling. Yes, you read that right, bearish. At least at the time of writing.
Bitcoin, which has risen from $3,200 to $8,330 since December, remains within a bearish structure. If it breaks it up, we will finally be able to end the significant 2018/2019 downtrend, and the limit for the Bitcoin price will be in unchartered territories, beyond the all-time highs.
Above the current price, the first resistance level is $8,230 (long term bear channel ceiling), then the second resistance level is at $8,430 (price congestion resistance). The third resistance level for the BTC/USD pair is at $8,775 (price congestion resistance).
Below the current price, the first support level is $8,000 (price congestion support), then the second support level is at $7,980 (price congestion support). The third level of support for BTC/USD is $7,750 (price congestion support).
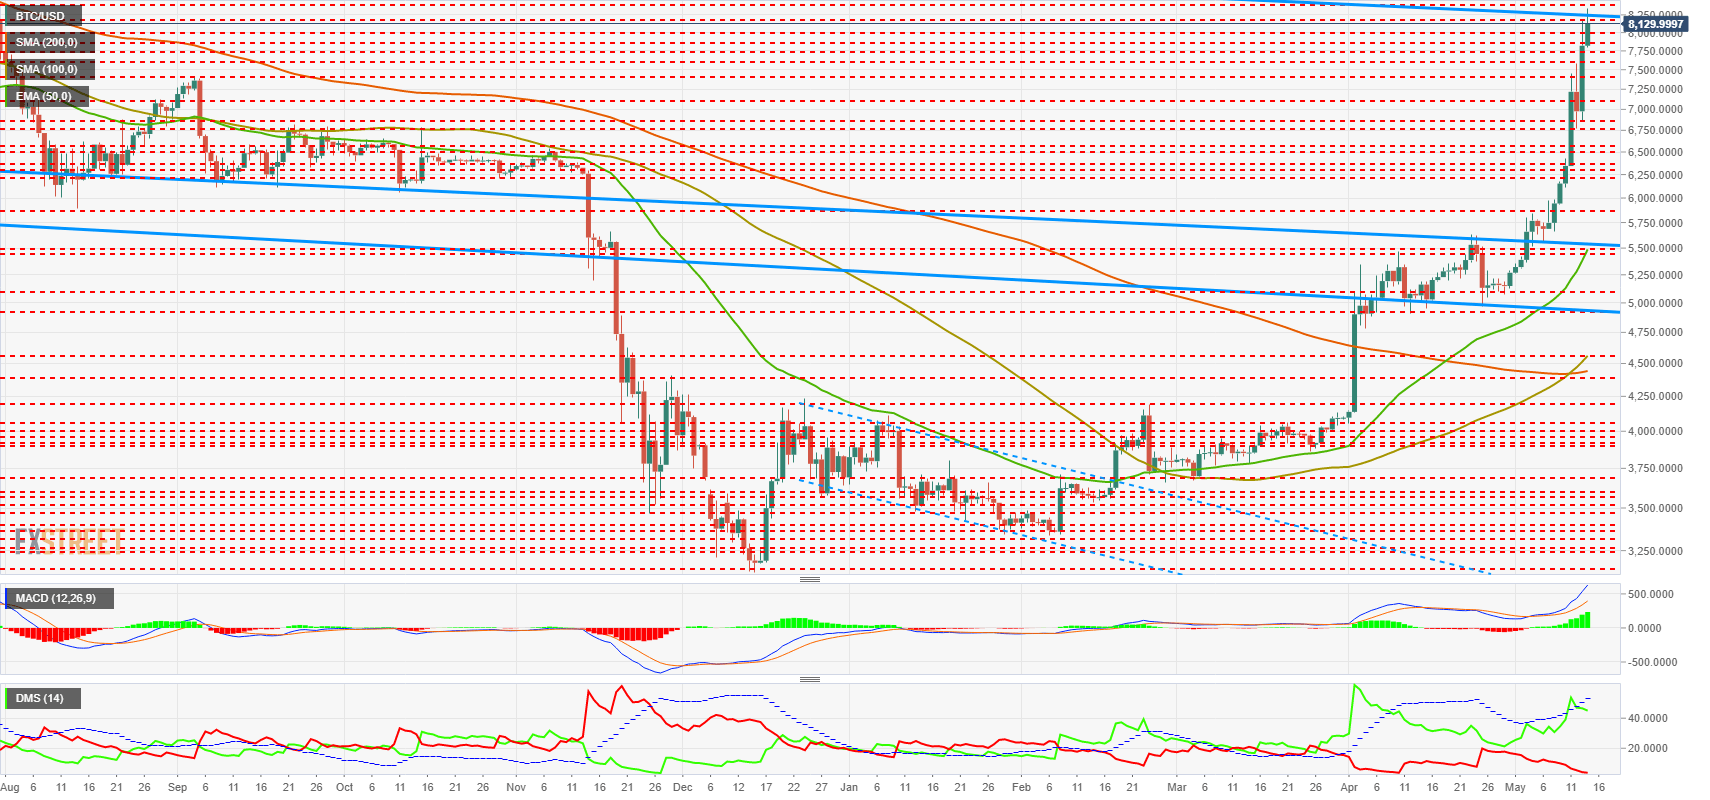
The MACD on the daily chart shows an extreme bullish profile with a large opening between the lines. The indicator shows such a strongly bullish structure that at any time a quick and robust correction can appear as normal.
The DMI on the daily chart shows how bears go to minimum levels that are typically followed by price cuts. Bulls dominate the moment, although they cross down the ADX line, which heralds an increase in market instability.
ETH/USD Daily Chart
ETH/USD is trading at $208. As we can see from the daily chart, Ethereum escaped the bearish structure in March, and since then it has been moving slightly higher. Perhaps the time has come for it to move higher with more violence.
Above the current price, the first resistance level is at $208.5 (price congestion resistance), then the second resistance level is at $225 (price congestion resistance). The third resistance level is at $236 (price congestion resistance).
Below the current price, the first support level is at $199.9 (price congestion support), then the second support level is at $190 (price congestion support). The third level of support for the ETH/USD pair is at $180 (price congestion support).
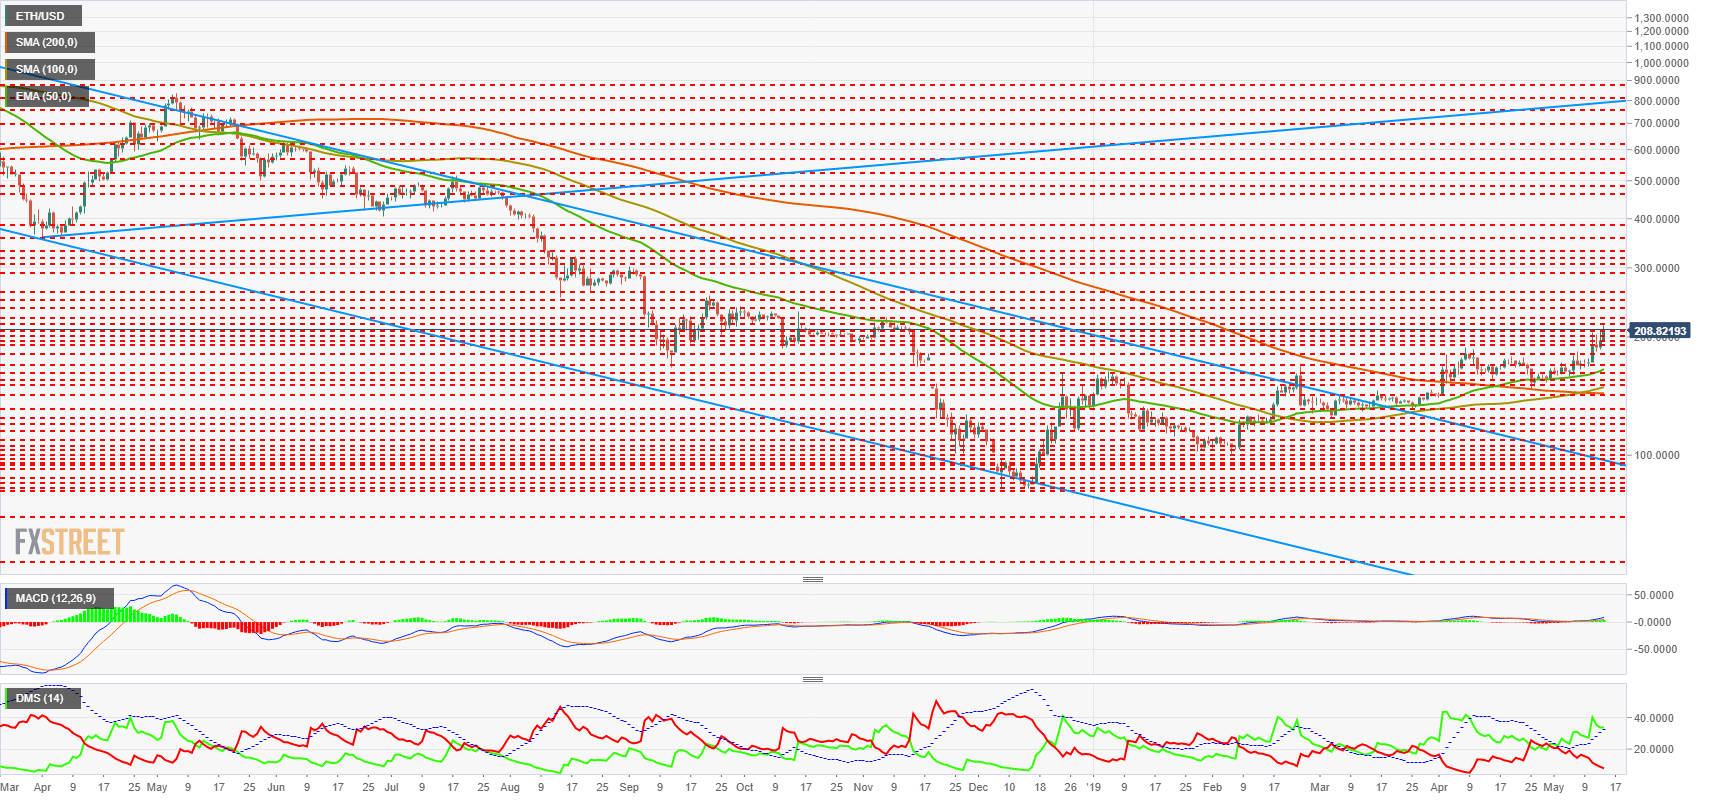
The MACD on the daily chart shows a reasonably bullish profile with a good opening between the lines. The structure is less developed than in the case of Bitcoin, so it retains more potential than consuming before entering final phases.
The DMI in the daily chart shows that bulls are in control of the situation and still well placed above the ADX line. The bears, on the other hand, go to the lows but with room to fall even lower.
XRP/USD Daily Chart
XRP/USD is currently trading at $0.374, after hitting a session high above $0.40. As we can see, XRP has come out of the long term bearish parallel channel, entering through the big door on the bullish neutral side of the market.
Above the current price, the first resistance level is at $0.39 (price congestion resistance), then the second resistance level is at $0.413 (price congestion resistance), while the third resistance level for the XRP/USD pair is at $0.423 (price congestion resistance).
Below the current price, the first support level is $0.368 (price congestion support), then the second support level is $0.346 (price congestion support). The third level of support is for the XRP/USD pair at $0.334 (price congestion support).
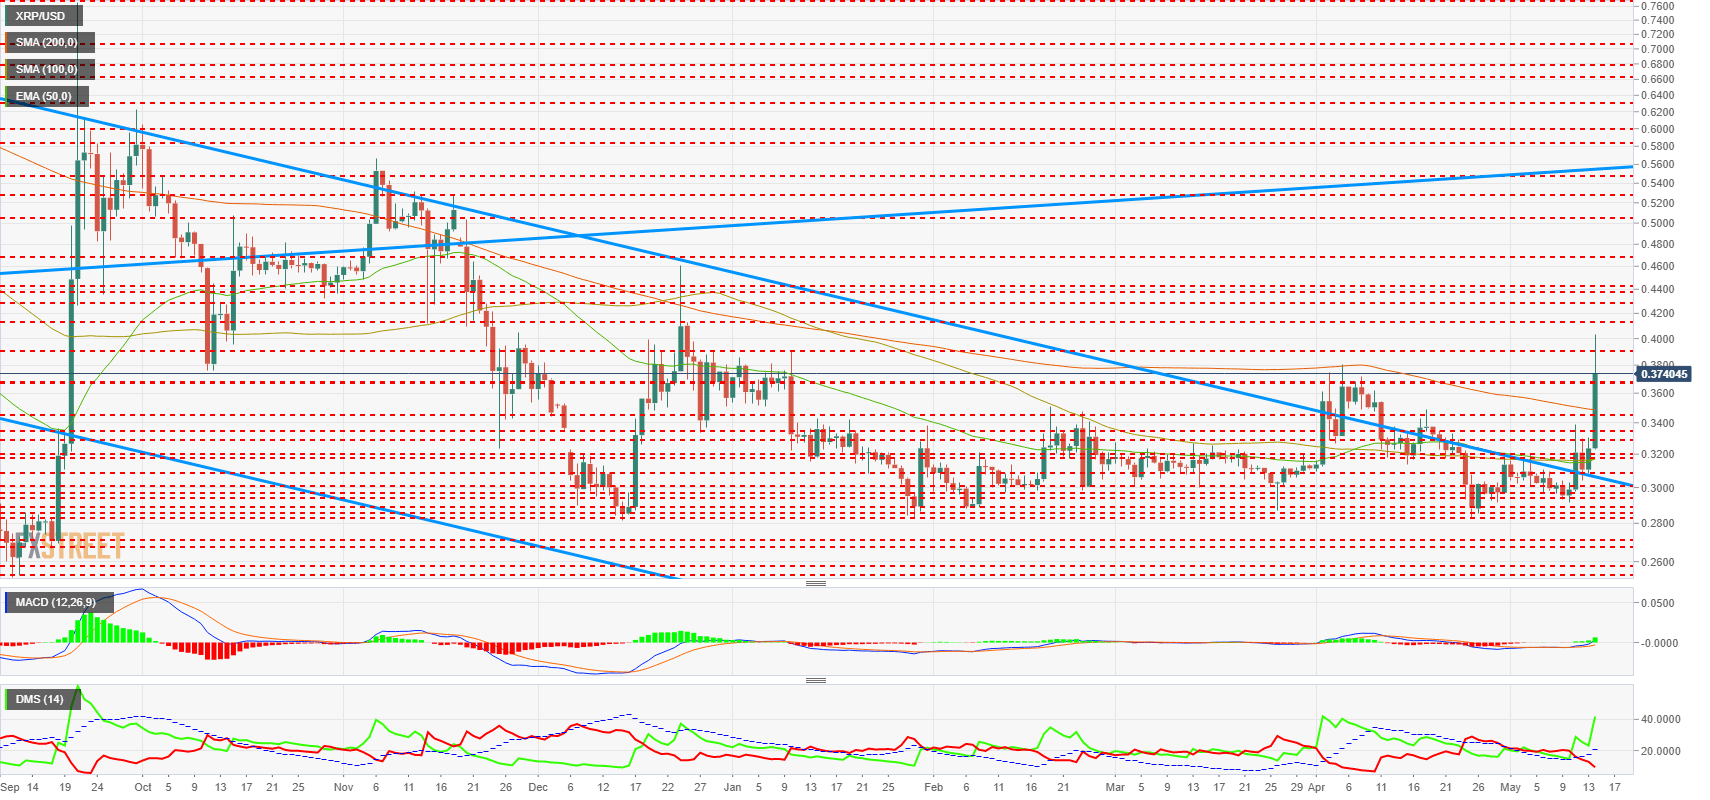
The MACD on the daily chart shows a slightly cross profile on the upside with a little opening between the lines as a result of the youthfulness of the movement. Besides, the indicators remain below the zero lines of the indicator, so if the trend persists and enters the positive zone, the rises can be scandalously bullish.
The DMI on the daily chart shows the bulls taking control with authority as the bears' sink. The structure is at an early stage, so you have a long way to go.
Get 24/7 Crypto updates in our social media channels: Give us a follow at @FXSCrypto and our FXStreet Crypto Trading Telegram channel
Information on these pages contains forward-looking statements that involve risks and uncertainties. Markets and instruments profiled on this page are for informational purposes only and should not in any way come across as a recommendation to buy or sell in these assets. You should do your own thorough research before making any investment decisions. FXStreet does not in any way guarantee that this information is free from mistakes, errors, or material misstatements. It also does not guarantee that this information is of a timely nature. Investing in Open Markets involves a great deal of risk, including the loss of all or a portion of your investment, as well as emotional distress. All risks, losses and costs associated with investing, including total loss of principal, are your responsibility. The views and opinions expressed in this article are those of the authors and do not necessarily reflect the official policy or position of FXStreet nor its advertisers. The author will not be held responsible for information that is found at the end of links posted on this page.
If not otherwise explicitly mentioned in the body of the article, at the time of writing, the author has no position in any stock mentioned in this article and no business relationship with any company mentioned. The author has not received compensation for writing this article, other than from FXStreet.
FXStreet and the author do not provide personalized recommendations. The author makes no representations as to the accuracy, completeness, or suitability of this information. FXStreet and the author will not be liable for any errors, omissions or any losses, injuries or damages arising from this information and its display or use. Errors and omissions excepted.
The author and FXStreet are not registered investment advisors and nothing in this article is intended to be investment advice.
Recommended Content
Editors’ Picks

Bitcoin to extend its consolidation between the $75,000 to $88,000 range
Bitcoin price faces a slight rejection around the $85,000 resistance level on Wednesday after recovering 3.16% the previous day. A K33 report highlights that Cryptocurrencies and Equities have largely de-risked going into Donald Trump’s “Liberation Day” on Wednesday.

Maker, Gala and Polygon lead $100k whale transactions, can altcoins defy looming macro uncertainty?
Maker (MKR), GALA, and Polygon (POL) are among the crypto projects that have seen a spike in whale transactions of at least $100,000 in the past week, as revealed by Santiment on-chain data.

Cardano and Binance Coin Price Forecast: Altcoins ADA and BNB show weakness in momentum indicators
Cardano (ADA) and Binance Coin (BNB) prices edge slightly down, trading around $0.66 and $598, respectively, at the time of writing on Wednesday after a mild recovery so far this week.
Public firms turn balance sheets into Bitcoin vaults: Gamestop raises $1.5 billion; Metaplanet adds 160 BTC
Public companies are increasingly converting their balance sheets into Bitcoin reserves. Gamestop (GME) has raised $1.5 billion in capital, with potential plans to allocate part of the funds toward expanding its Bitcoin treasury.

Bitcoin: BTC remains calm before a storm
Bitcoin's price has been consolidating between $85,000 and $88,000 this week. A K33 report explains how the markets are relatively calm and shaping up for volatility as traders absorb the tariff announcements. PlanB’s S2F model shows that Bitcoin looks extremely undervalued compared to Gold and the housing market.

The Best brokers to trade EUR/USD
SPONSORED Discover the top brokers for trading EUR/USD in 2025. Our list features brokers with competitive spreads, fast execution, and powerful platforms. Whether you're a beginner or an expert, find the right partner to navigate the dynamic Forex market.