Top 3 Price Prediction Bitcoin, Ethereum, XRP: The next crypto bullish expansion phase has begun
- Bitcoin price breaks out of the bull flag.
- Ethereum price makes new all-time highs, upside potential may be limited.
- XRP price action is ready to pop – a massive spike higher is likely.

Bitcoin price breaks out above the bull flag and continues higher. Ethereum price cracks above $4,500 and makes new all-time highs - $5,000 value area is insight. As a result, XRP price is positioned for one of the most bullish patterns in Point and Figure analysis.
Bitcoin price extends gains above the bull flag, must keep momentum or risks creating a fake-out
Bitcoin price action has been very bullish during the early US trading session, spiking over 3% higher during the day. The breakout comes after clear support against the daily Tenkan-Sen and Kijun-Sen. The past three trade days have all traded lower, but there has been clear buying participation against those two Ichimoku levels. As a result, Bitcoin is currently trading at a ten-day high.
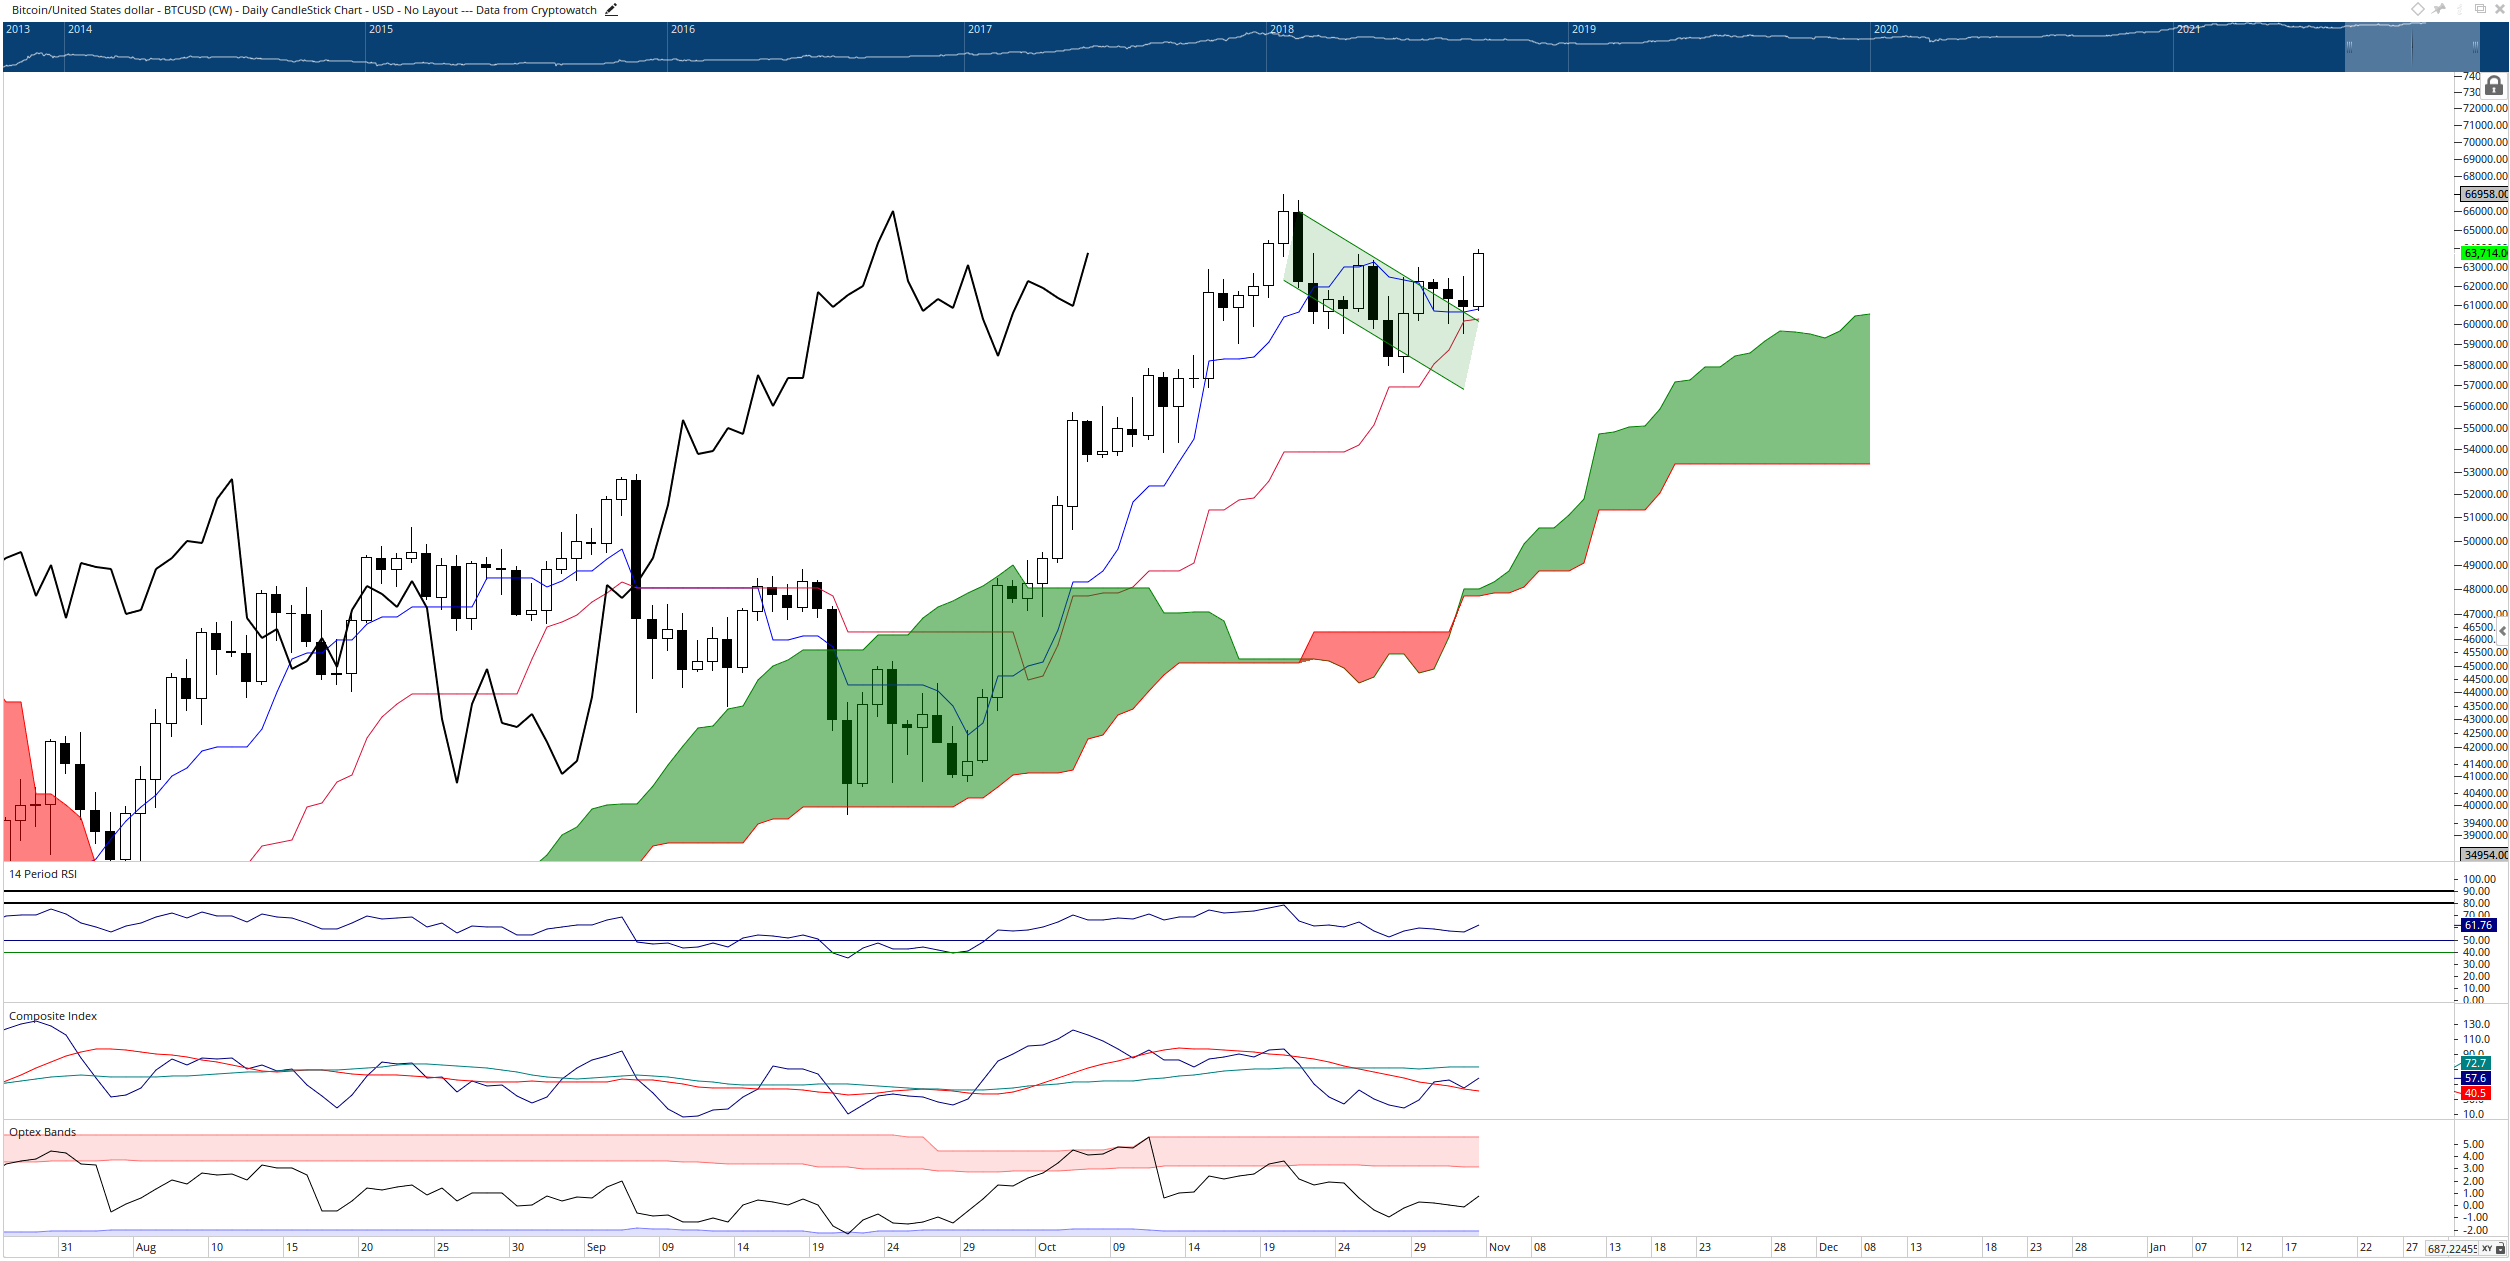
BTC/USD Daily Ichimoku Chart
Some caution should be maintained, however. While the oscillators show good positioning for a sustained rally of Bitcoin price, the Composite Index may be hinting at some weakness. Specifically, if the Composite Index creates a high above the October 20th peak, but Bitcoin fails to produce a new all-time high, some bearish divergence could limit Bitcoin’s upside potential.
Ethereum price pushes higher, gains of 4% and more ahead
Ethereum price on the $50/3-box Point and Figure chart shows a parabolic rise could be coming. The previous column of Xs was the column that saw Ethereum print the prior all-time high after the initial rejection in mid-October. The current column of Xs is the first extension after the pullback. The theoretical trade setup is a buy limit order at $4,550 with a stop loss at $4,350 and a profit target at $5,550. The implied profit target projection is based on the Vertical Profit Target Method in Point and Figure analysis.
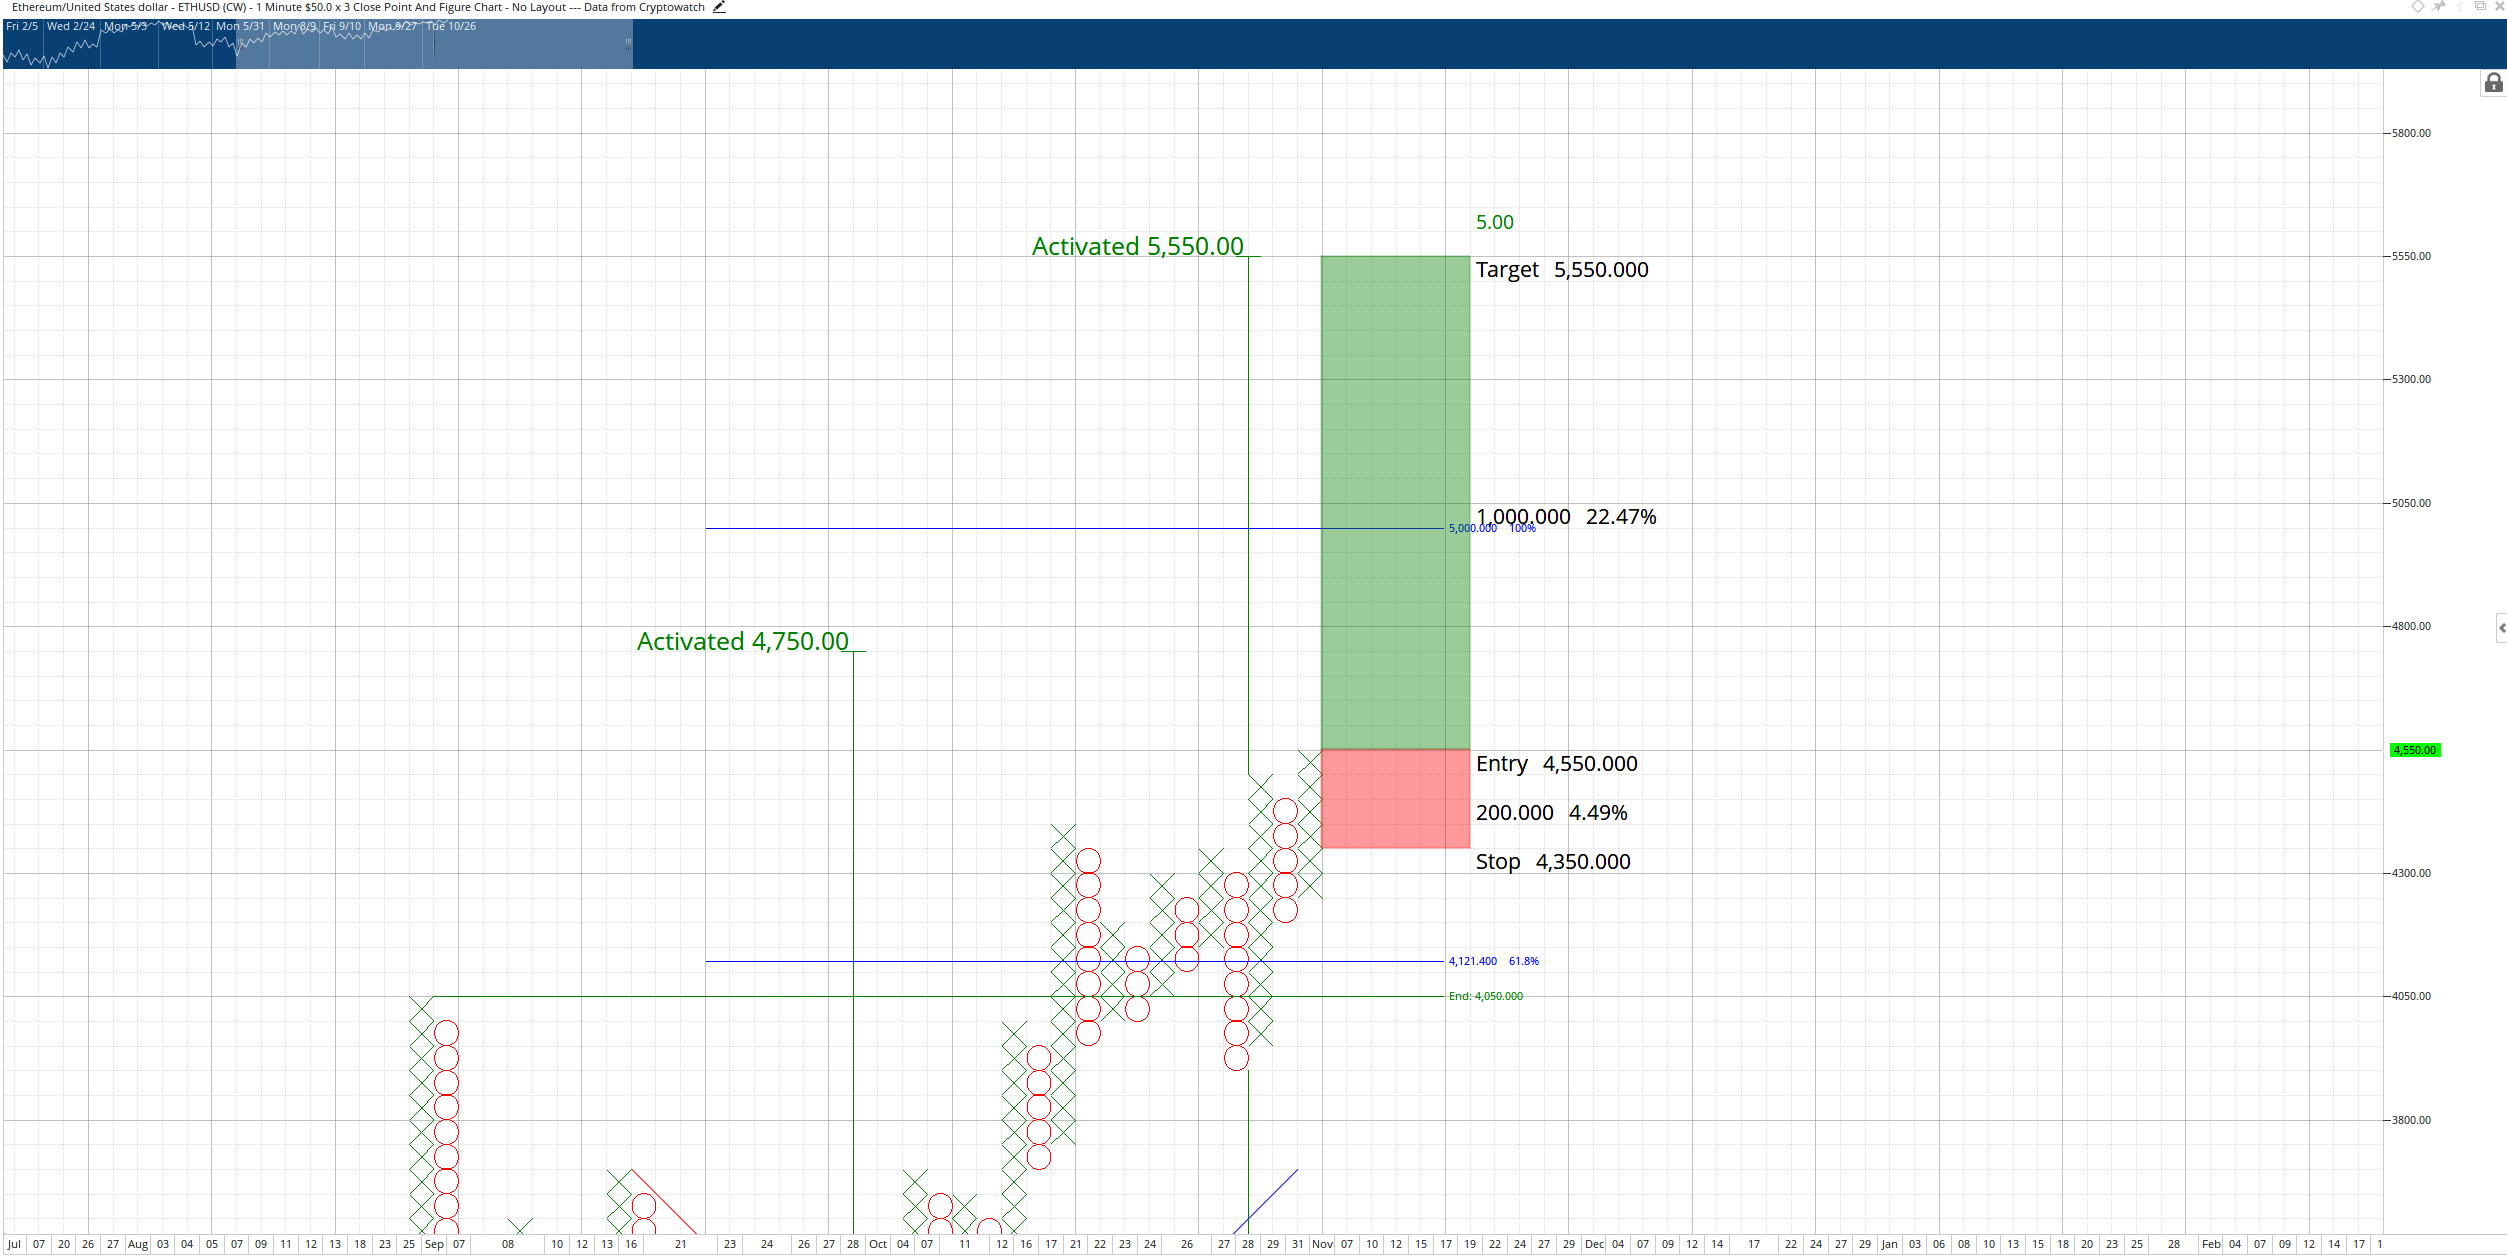
ETH/USD $50/3-box Reversal Point and Figure Chart
Bulls should be aware that Ethereum could be positioned for a bull-trap. However unlikely it may seem, a bull trap would occur if Ethereum returns to $4,150. From there, the buyers may return to support Ethereum price between the $3,400 and $3,800 value areas.
XRP price is likely to outperform Bitcoin and Ethereum if it can crack the nearby resistance
XRP price has more bullish breakout potential and percentage gains ahead than Bitcoin or Ethereum. The pent-up demand and indecision could very well be coming to a close. XRP has a triple-top developing on its Point and Figure chart. That creates an ideal hypothetical long trade scenario with a buy stop at $1.18, a stop loss at $1.10, and a profit target at $1.50. However, the $1.50 profit target may be too conservative, but it is the threshold measured on a breakout above the triple-top.
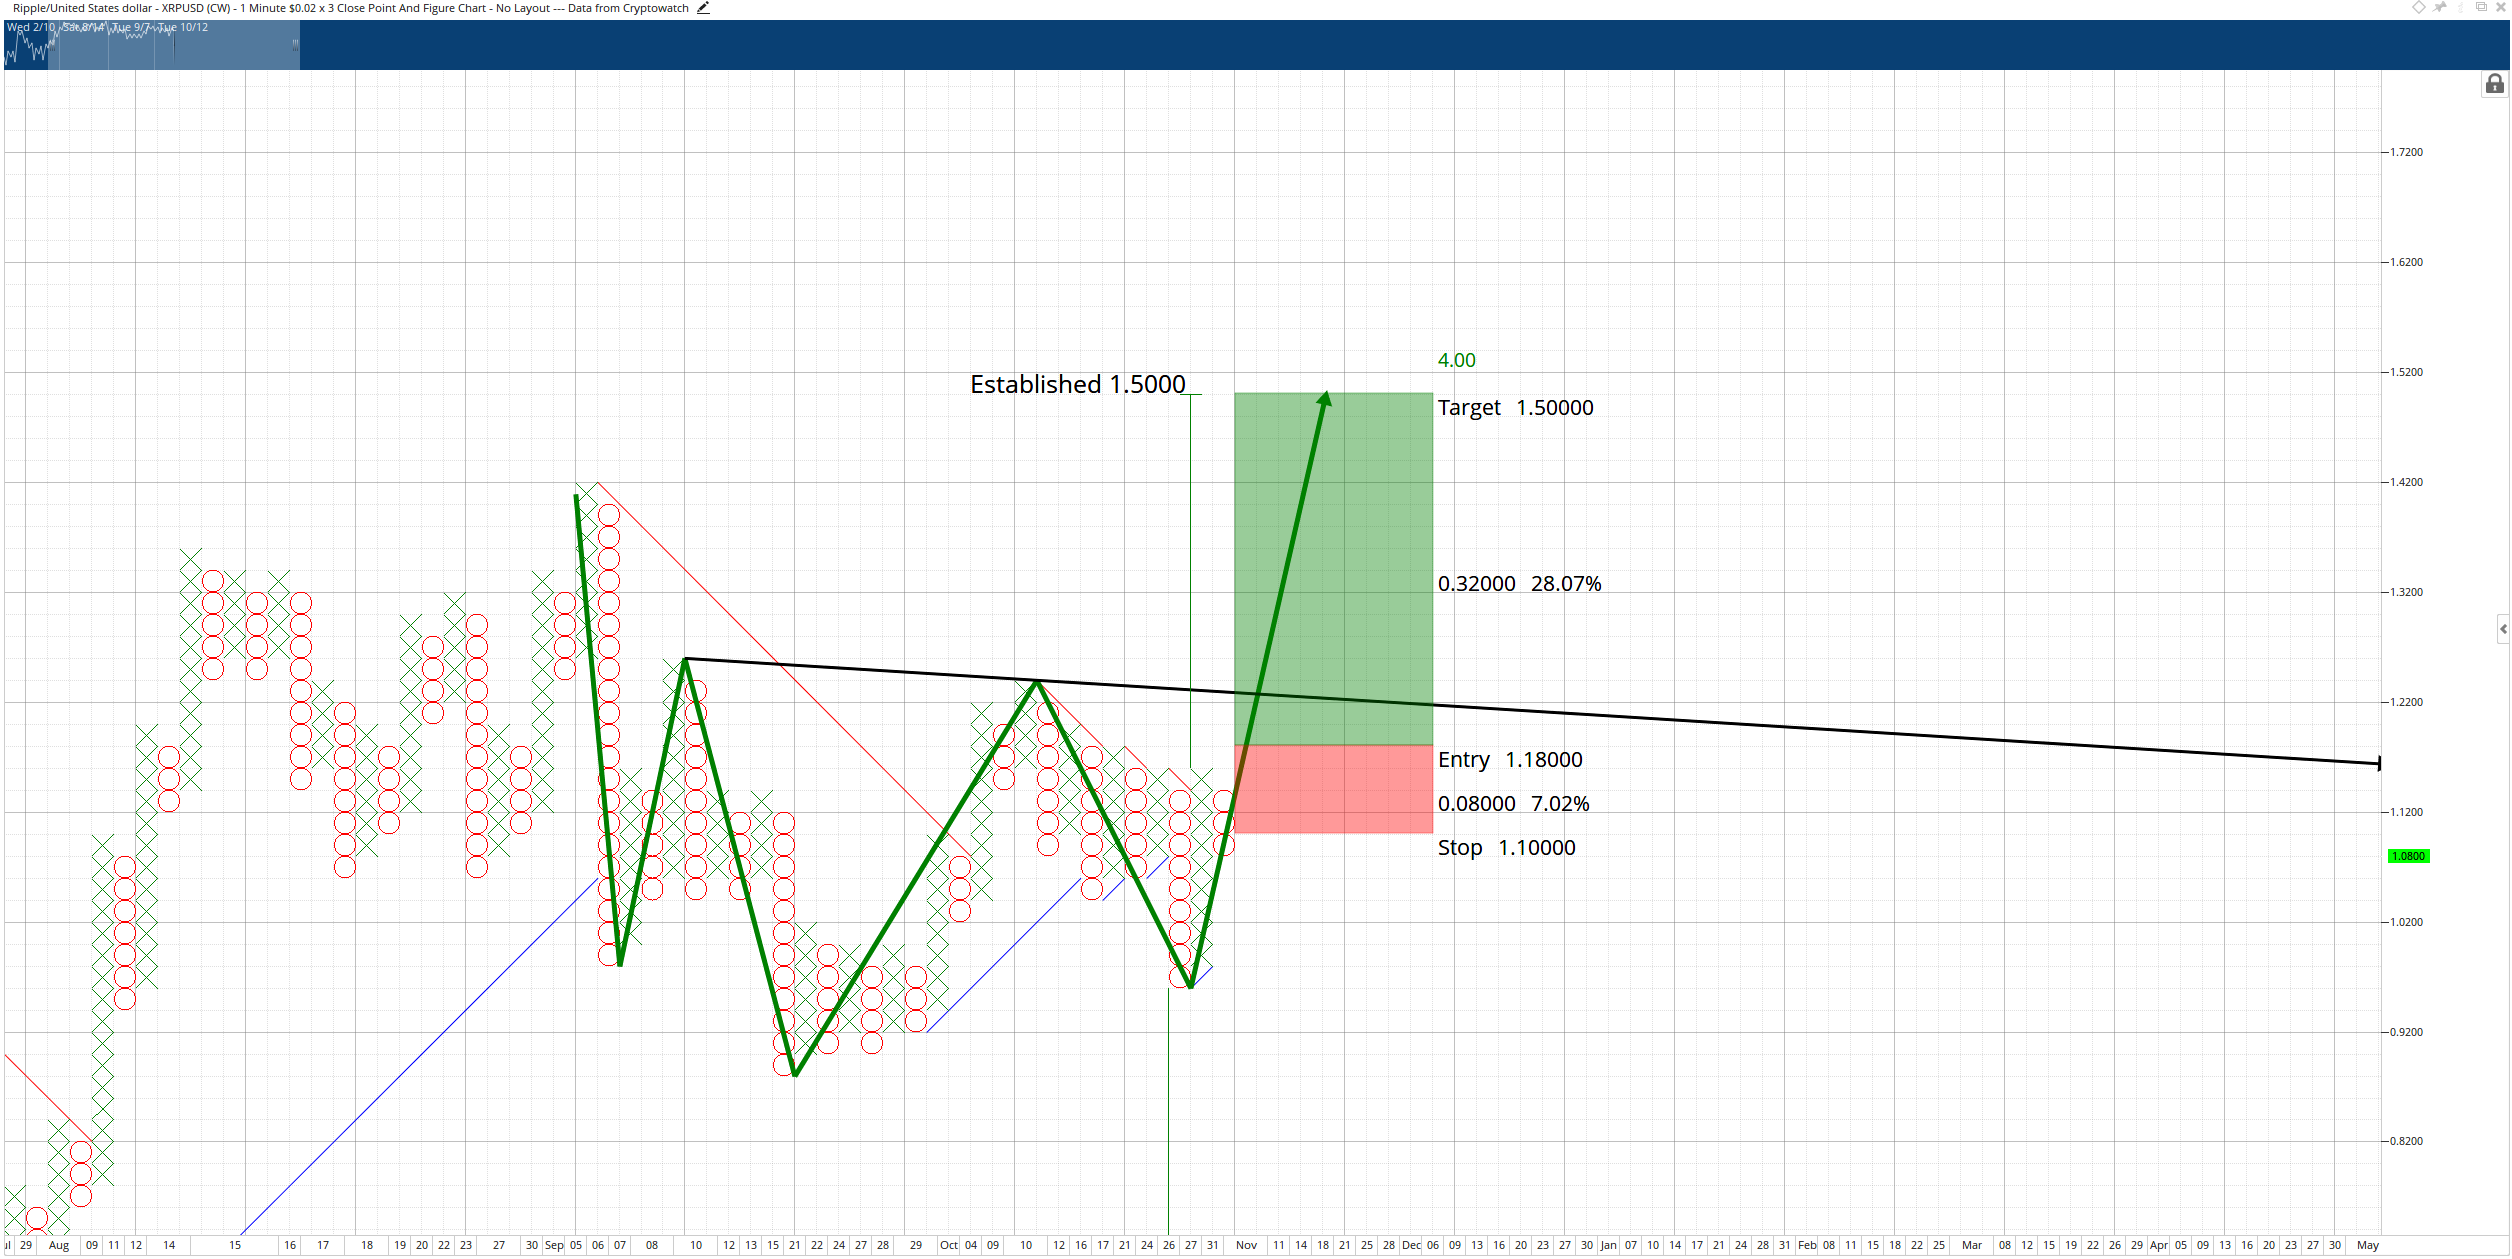
XRP/USD $0.02/3-box Reversal Point and Figure Chart
While invalidation of this bullish setup is not very likely – especially given the firm buying support XRP price continues to enjoy – there are risks. Any daily close below the $0.98 to $1.00 value areas could trigger longs to sell and bears to begin shorting.
Author

Jonathan Morgan
Independent Analyst
Jonathan has been working as an Independent future, forex, and cryptocurrency trader and analyst for 8 years. He also has been writing for the past 5 years.


