![]() Jonathan Morgan
Jonathan Morgan
Independent Analyst
- Bitcoin price hits new five-month lows, highly oversold.
- Ethereum price action points to a colossal bullish reversal.
- XRP price could quickly return to $1.00 if recent bearish breakouts fail to sustain further selling pressure.
Bitcoin price action shows evidence that a bottom may be forming, denying bears any further movement lower. Ethereum price has developed a ridiculously extended hidden bullish divergence condition on its weekly chart, warning of an imminent bullish reversal. XRP price hammered with two major short setups, but sellers failed to push XRP lower.
Bitcoin price displays buying opportunity before BTC hits $60k
Bitcoin price has developed an excellent theoretical long setup on its $1,000/3-box reversal Point and Figure chart. The long entry idea is a buy stop at $44,000, a stop loss at $40,000, and a profit target at $61,000. This trade represents a 4.25:1 reward/risk setup with an implied target of 40.5% from the entry. A trailing stop of two or three boxes would help protect any profit generated post entry.
The profit target is based on the vertical profit target method in Point and Figure analysis, but it may be too conservative. However, if Bitcoin price moves to $61,000, it will more than likely fulfill all the requirements for an Ideal Bullish Ichimoku Breakout on its weekly Ichimoku chart. If that scenario plays out, Bitcoin will be well on its way to new all-time highs.
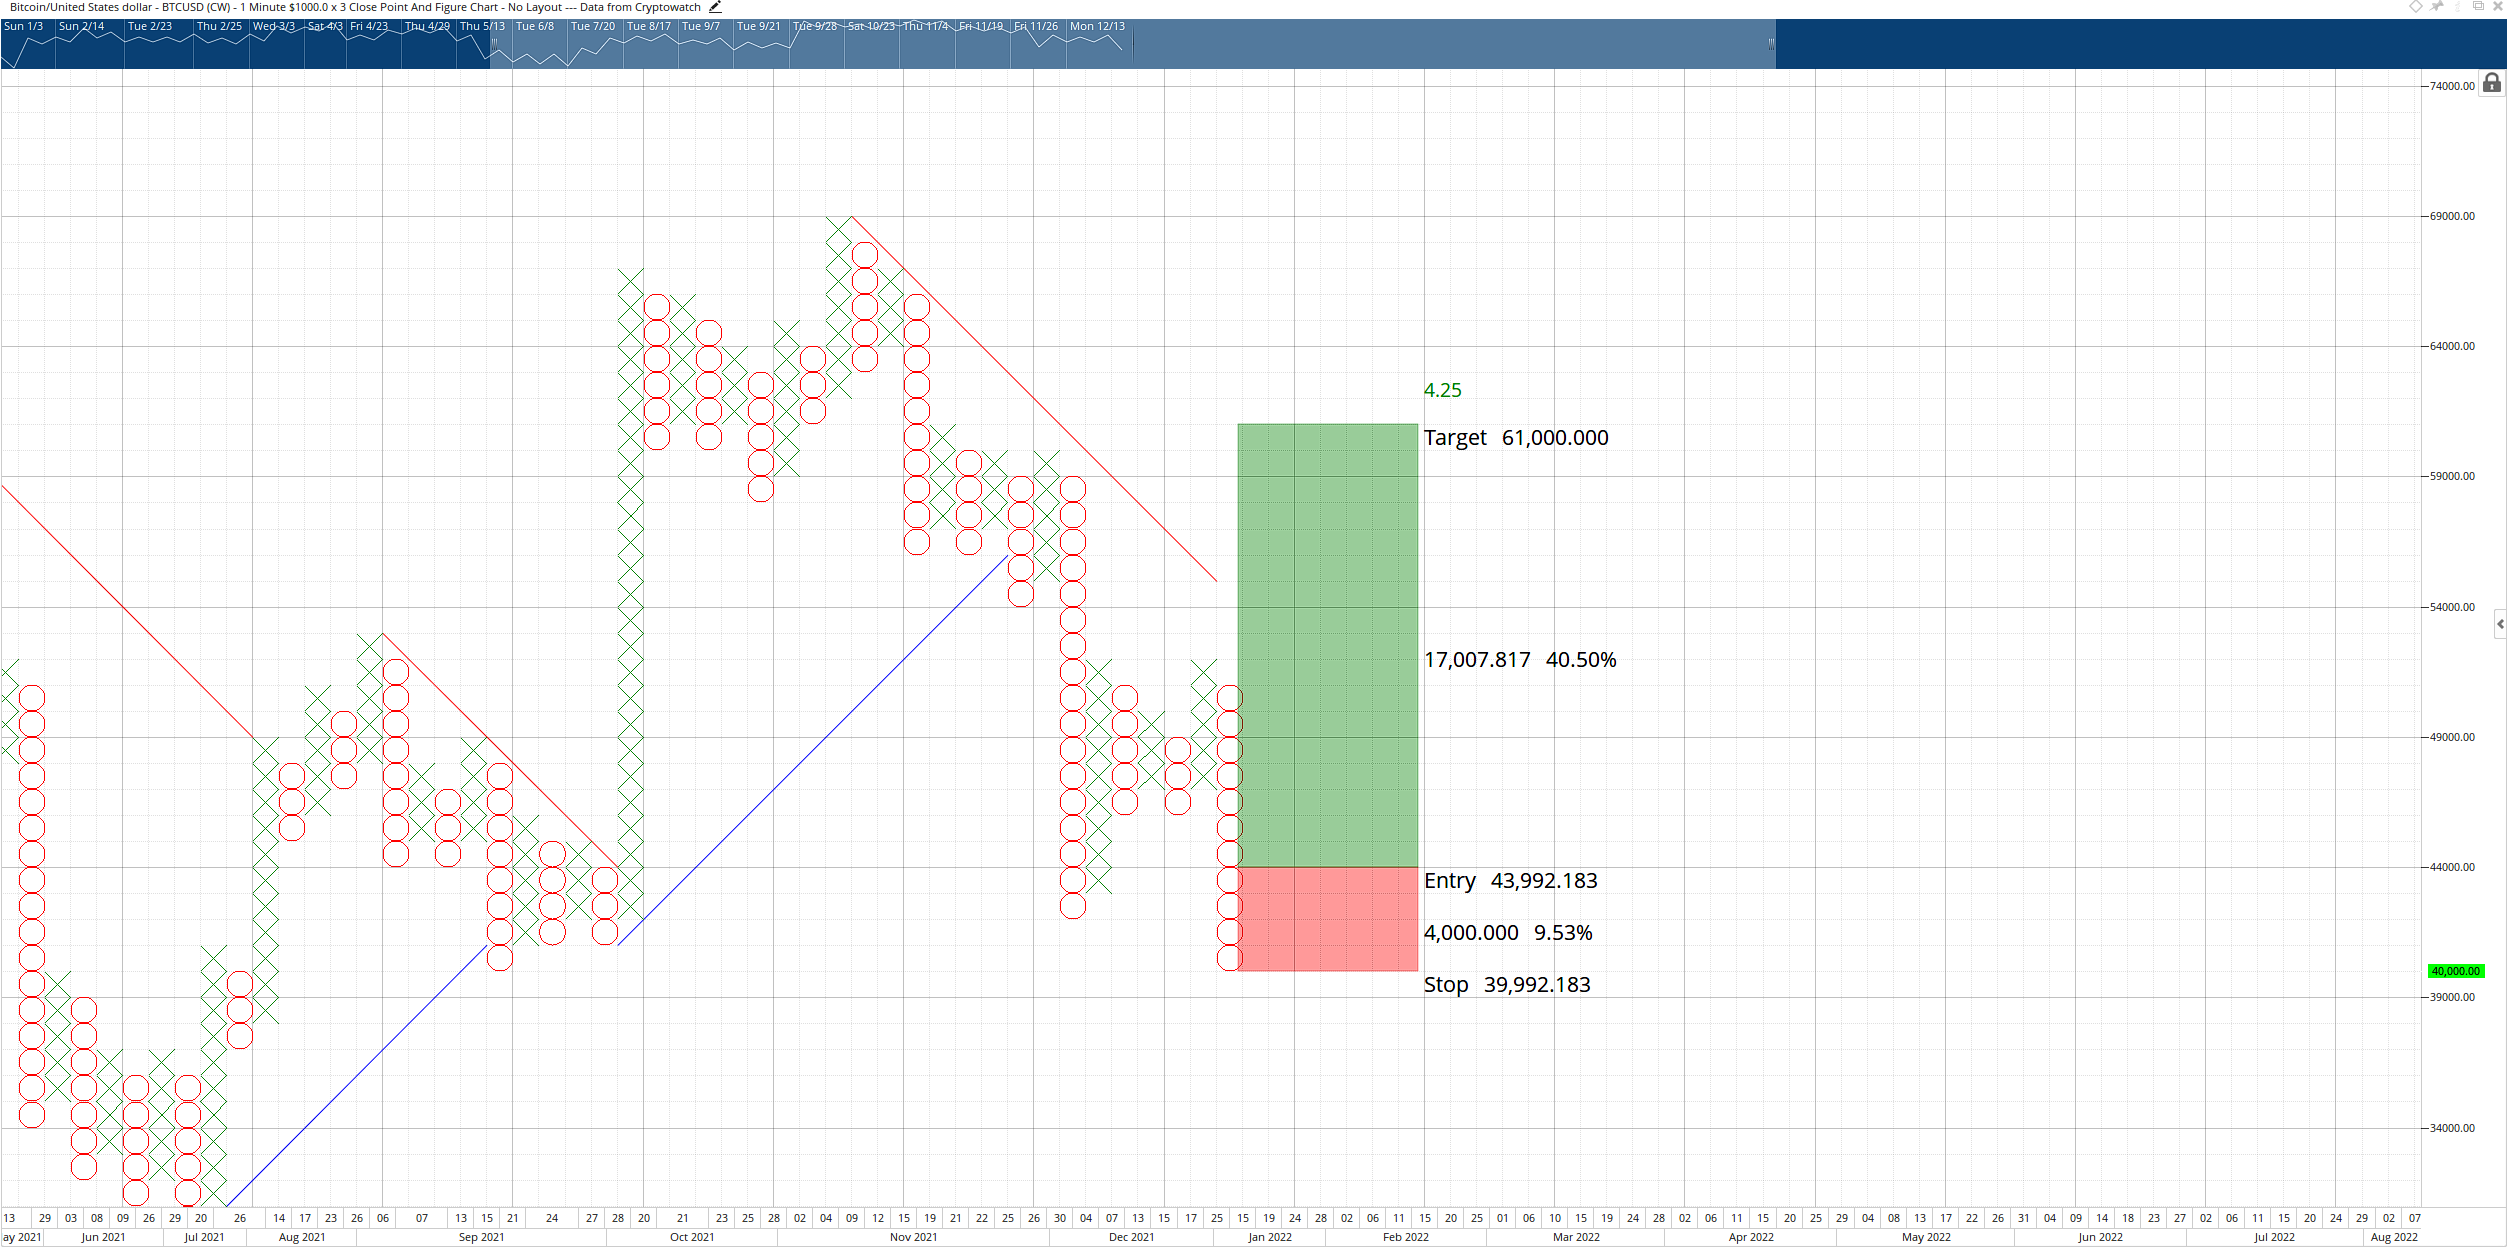
BTC/USD $1,000/3-box Reversal Point and Figure Chart
Because of this Point and Figure setup structure, there is no invalidation point for the theoretical long entry. If Bitcoin continues to slide south, the entry and stop move in tandem – but the profit target remains.
Ethereum price to reverse hard and fast, $4,000 in bulls’ crosshairs
Ethereum price is likely poised for a swift and incredible bullish reversal very, very soon. The reasons for this imminent reversal are based on the support found against the 50% Fibonacci retracement on the weekly Ichimoku chart and the hidden bullish divergence between the candlesticks and the Composite Index - the Composite Index is at lows not seen since September 2019.

ETH/USD Weekly Ichimoku Chart
Hidden bullish divergence is a warning that the current corrective move is about to end and that a resumption of the uptrend is likely to continue soon. As a result, a trade opportunity is now present on the Point and Figure chart.
There is a hypothetical long entry for Ethereum price on its $100/3-box reversal Point and Figure chart. The long setup is a buy stop order at $3,400, a stop loss at $3,000, and a profit target at $5,500. The hypothetical buy entry is a 5.25:1 reward/risk setup with a projected profit target of over 65% from the entry. A three-box trailing stop would help protect any profit generated after hitting the entry.

ETH/USD $100/3-box Reversal Point and Figure Chart
As with Bitcoin, there is no invalidation point for Ethereum price within its hypothetical buy setup. If Ethereum moves lower, the buy stop and stop loss move with the lower price action, but the profit target remains the same.
XRP price assaulted with several bearish Point and Figure setups but sellers not following through
XRP price has a double whammy of bearish activity on its $0.01/3-box reversal Point and Figure chart. The Bearish Catapult pattern and Descending Triple Bottom pattern created a simultaneous bearish short setup at the $0.72 price level. Sellers did push XRP to $0.70, but that was it.
The two bearish short entry patterns represent two of the most potent short strategies in Point and Figure analysis. That bears have been unable or unwilling to capitalize on the bearish structure is very telling and warns of bullish reversal.
XRP price has a possible long entry opportunity with a buy stop order at $0.75, a stop loss at $0.71, and a profit target at $0.96. The trade represents a 5:1 reward/risk with an implied profit target of nearly 29% from the entry. A tight trailing stop of two boxes would help protect any profit made post entry.

XRP/USD $0.01/3-box Reversal Point and Figure Chart
Traders should expect some initial resistance at the 38.2% Fibonacci retracement and bottom of the Cloud (Senkou Span A) confluence zone at $0.81. However, this possible long entry is invalidated if XRP price moves to a daily close below the $0.69 price level.
Note: All information on this page is subject to change. The use of this website constitutes acceptance of our user agreement. Please read our privacy policy and legal disclaimer. Opinions expressed at FXstreet.com are those of the individual authors and do not necessarily represent the opinion of FXstreet.com or its management. Risk Disclosure: Trading foreign exchange on margin carries a high level of risk, and may not be suitable for all investors. The high degree of leverage can work against you as well as for you. Before deciding to invest in foreign exchange you should carefully consider your investment objectives, level of experience, and risk appetite. The possibility exists that you could sustain a loss of some or all of your initial investment and therefore you should not invest money that you cannot afford to lose. You should be aware of all the risks associated with foreign exchange trading, and seek advice from an independent financial advisor if you have any doubts.
Recommended Content
Editors’ Picks

Grayscale files S-3 form for Digital Large Cap ETF comprising Bitcoin, Ethereum, XRP, Solana, and Cardano
Grayscale, a leading digital asset manager operating the GBTC ETF, has filed the S-3 form with the United States (US) Securities and Exchange Commission (SEC) in favor of a Digital Large Cap ETF.

Top 3 Price Prediction Bitcoin, Ethereum, Ripple: BTC, ETH, and XRP brace for volatility amid Trump’s ‘Liberation Day’
Bitcoin price faces a slight rejection around its $85,000 resistance level on Wednesday after recovering 3.16% the previous day. Ripple follows BTC as it falls below its critical level, indicating weakness and a correction on the horizon.

Top crypto news: VanEck hints at BNB ETF, Circle files S-1 application for IPO
Asset manager VanEck registered a BNB Trust in Delaware on Tuesday, marking its intention to register for an ETF product with the Securities & Exchange Commission (SEC).

Solana Price Forecast for April 2025: SOL traders risk $120 reversal as FTX begins $800M repayments on May 30
Solana price consolidated below $130 on Tuesday, facing mounting headwinds in April as investors grow wary of looming FTX sell-offs.

Bitcoin: BTC remains calm before a storm
Bitcoin's price has been consolidating between $85,000 and $88,000 this week. A K33 report explains how the markets are relatively calm and shaping up for volatility as traders absorb the tariff announcements. PlanB’s S2F model shows that Bitcoin looks extremely undervalued compared to Gold and the housing market.

The Best brokers to trade EUR/USD
SPONSORED Discover the top brokers for trading EUR/USD in 2025. Our list features brokers with competitive spreads, fast execution, and powerful platforms. Whether you're a beginner or an expert, find the right partner to navigate the dynamic Forex market.