![]() Jonathan Morgan
Jonathan Morgan
Independent Analyst
- Bitcoin price printed a solid bullish reversal candlestick on its weekly chart, indicating a likely bottom to its current trend.
- Ethereum price handily rejects bearish continuation with a spectacular weekly close and bullish candlestick reversal pattern.
- XRP price establishes a bottom, a retest of $0.75 coming soon.
Bitcoin price created a bullish hammer pattern on its weekly chart, giving bulls hope that the past eleven-week downtrend is at its end. Ethereum price rallied more than 18% off its lows last week, shocking short-sellers and initiating a powerful short squeeze. XRP price continues to underperform BTC and ETH but is positioned for a significant price spike.
Bitcoin price hits major support, BTC targets a return to $42,000
Bitcoin price action was a bit of a nail-biter last Friday. For most of the week, Bitcoin struggled to get back inside the Cloud and above the bottom of the Ichimoku Cloud (Senkou Span B) at $37,250. The combination of the bullish hammer pattern and support holding at Senkou Span B gives bulls a high probability of a swing low being found on this current pullback.
For bulls, not much has changed from last week's risk. Bitcoin price needs to have the current weekly candlestick close above Senkou Span B. The key resistance zone ahead for BTC is in the $41,000 to $42,000 value area where the 61.8% Fibonacci retracement ($41,165), top of the Ichimoku Cloud ($41,500), Tenkan-Sen ($42,500), and the 2022 Volume Point Of Control ($42,500) exist.
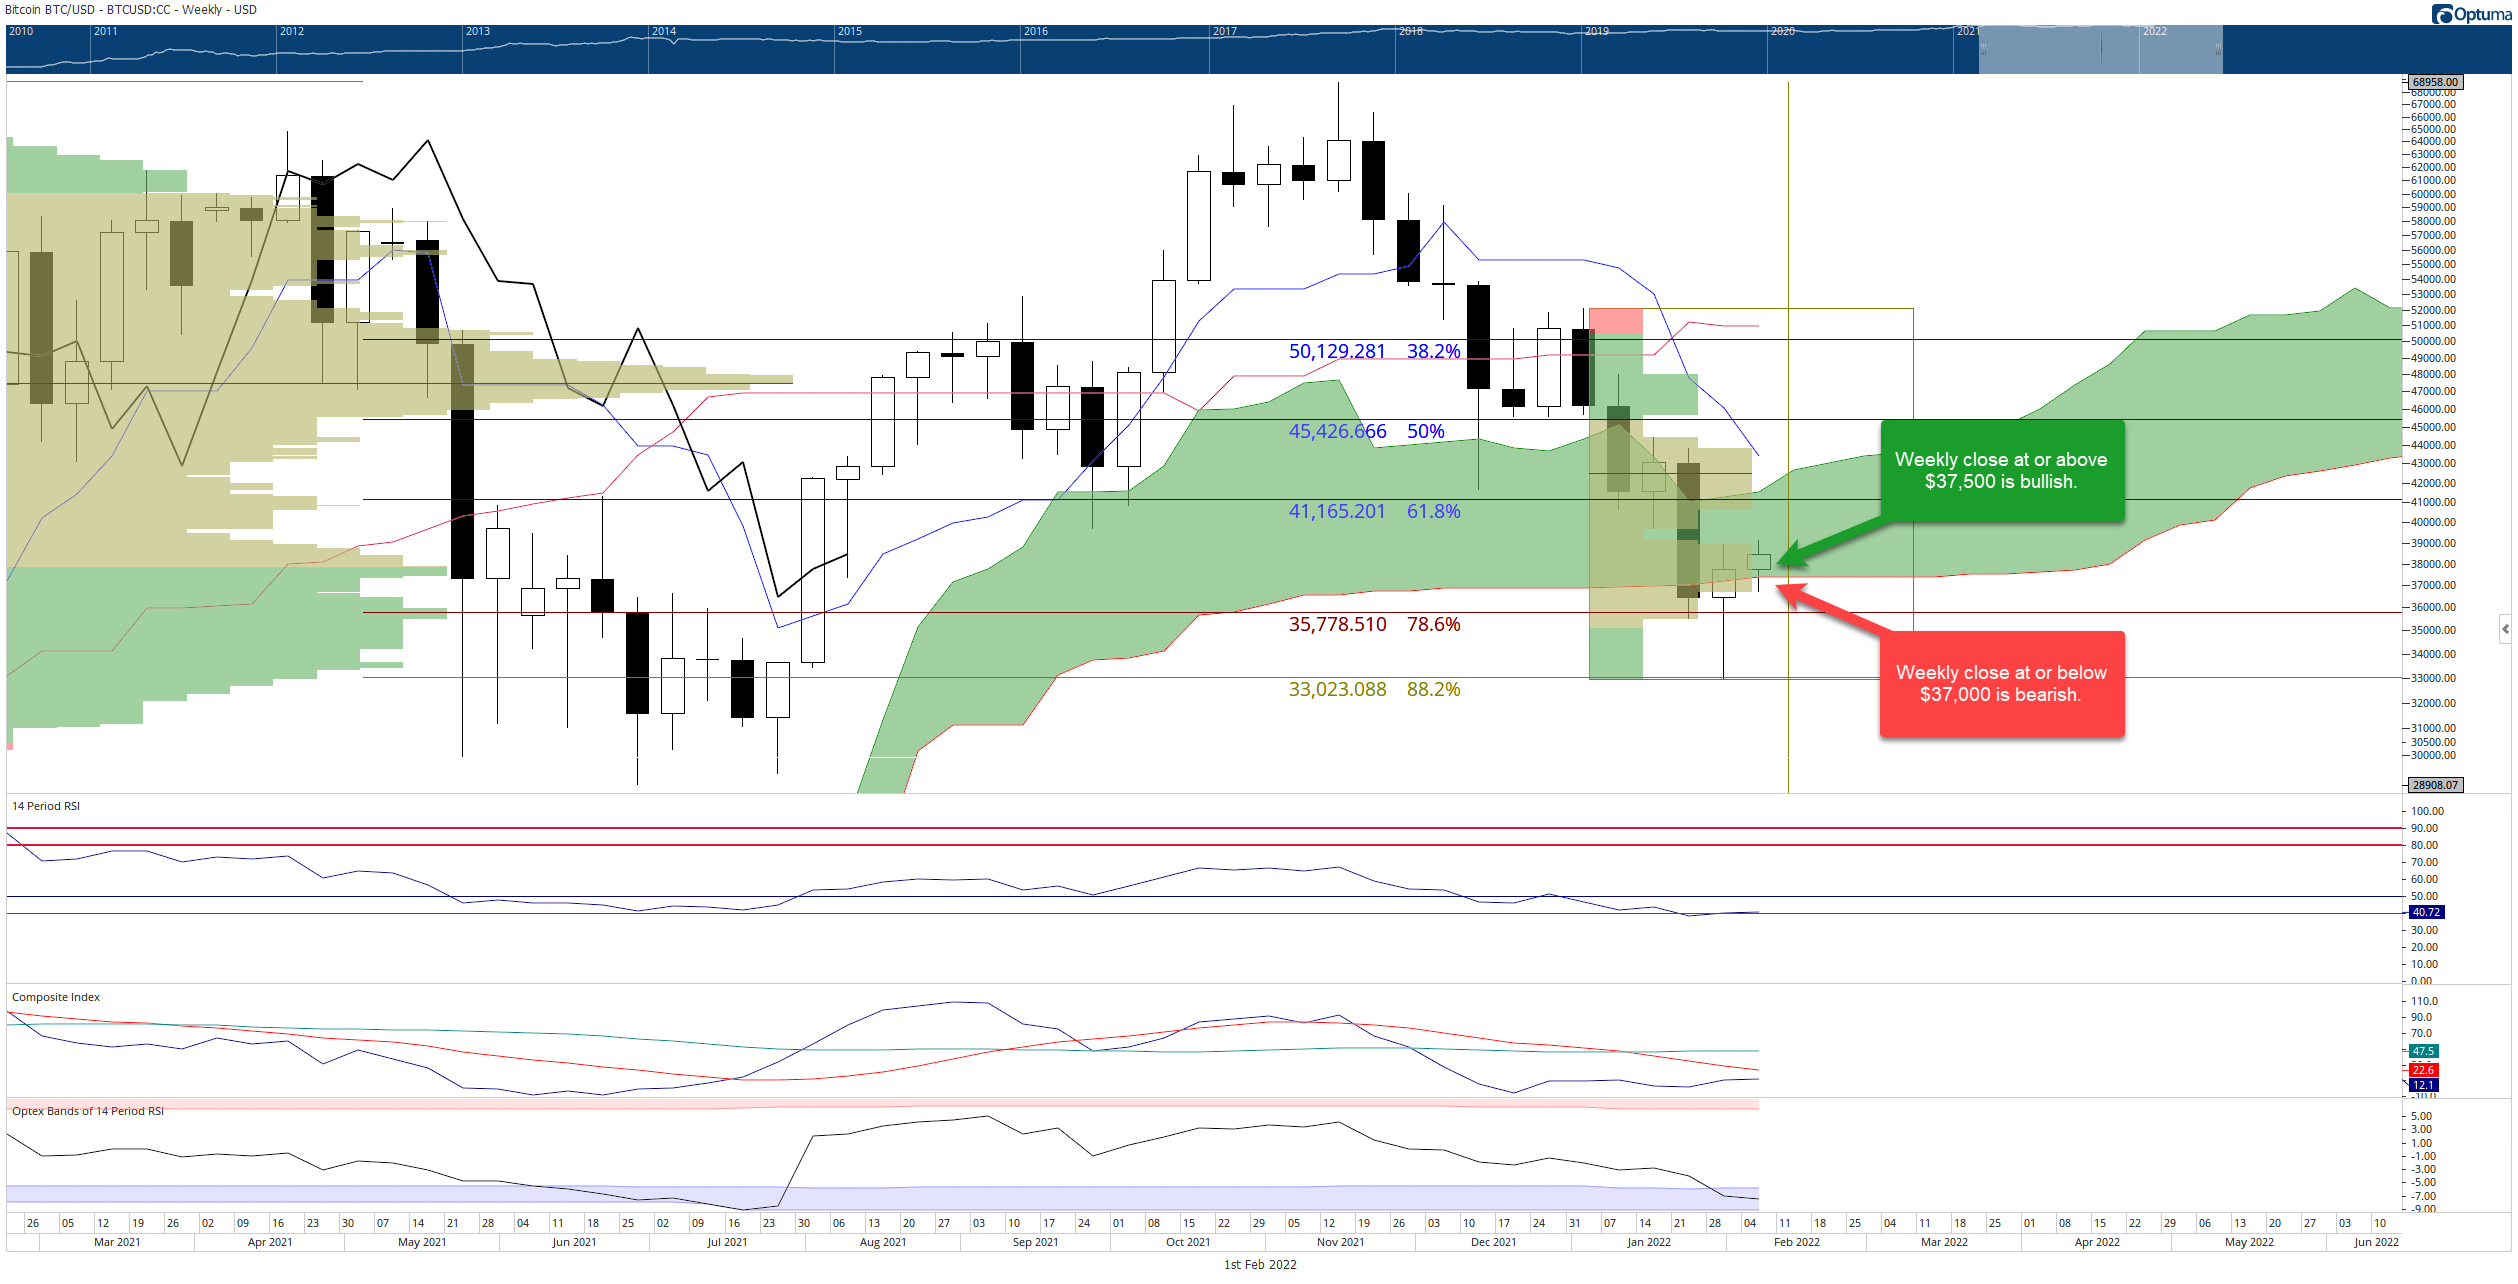
BTC/USD Weekly Ichimoku Kinko Hyo Chart
A weekly close below the Ichimoku Cloud at or below $37,000 would position Bitcoin into an Ideal Bearish Ichimoku Breakout short condition. If the Ideal Bearish Ichimoku Breakout condition occurs, it will be the first time since the Covid-crash in March 2020 that it occurred on the weekly chart and only the second time since June 2018.
Ethereum price achieved a robust recovery last week, giving momentum to a new uptrend
Ethereum price action last week was hands down, one of the biggest bearish rejection weekly candlesticks in recent memory. At one point last week, short-sellers destroyed long positions by pushing Ethereum lower nearly 16% and below the Ichimoku Cloud, threatening an Ideal Bearish Ichimoku Breakout setup. Like Bitcoin, it would have been the first time that the Ichimoku short setup appeared since the March 2020 Covid-crash and only the second occurrence since June 2018.
Ethereum printed a rare and powerful bullish candlestick pattern known as a Dragonfly Doji. From a psychological perspective, it is easy to see why short-sellers were likely shocked by Ethereum's performance last week. The oscillator conditions continue to show extreme oversold conditions, with a huge bullish reversal coming soon.
The Composite Index is coming off of levels not seen since July 2019. In addition, the Optex Bands oscillator has entered into severely oversold conditions for the first time since September 2019. At the same time, the Relative Strength Index remains in bull market conditions and has bounced off the final oversold level at 40.
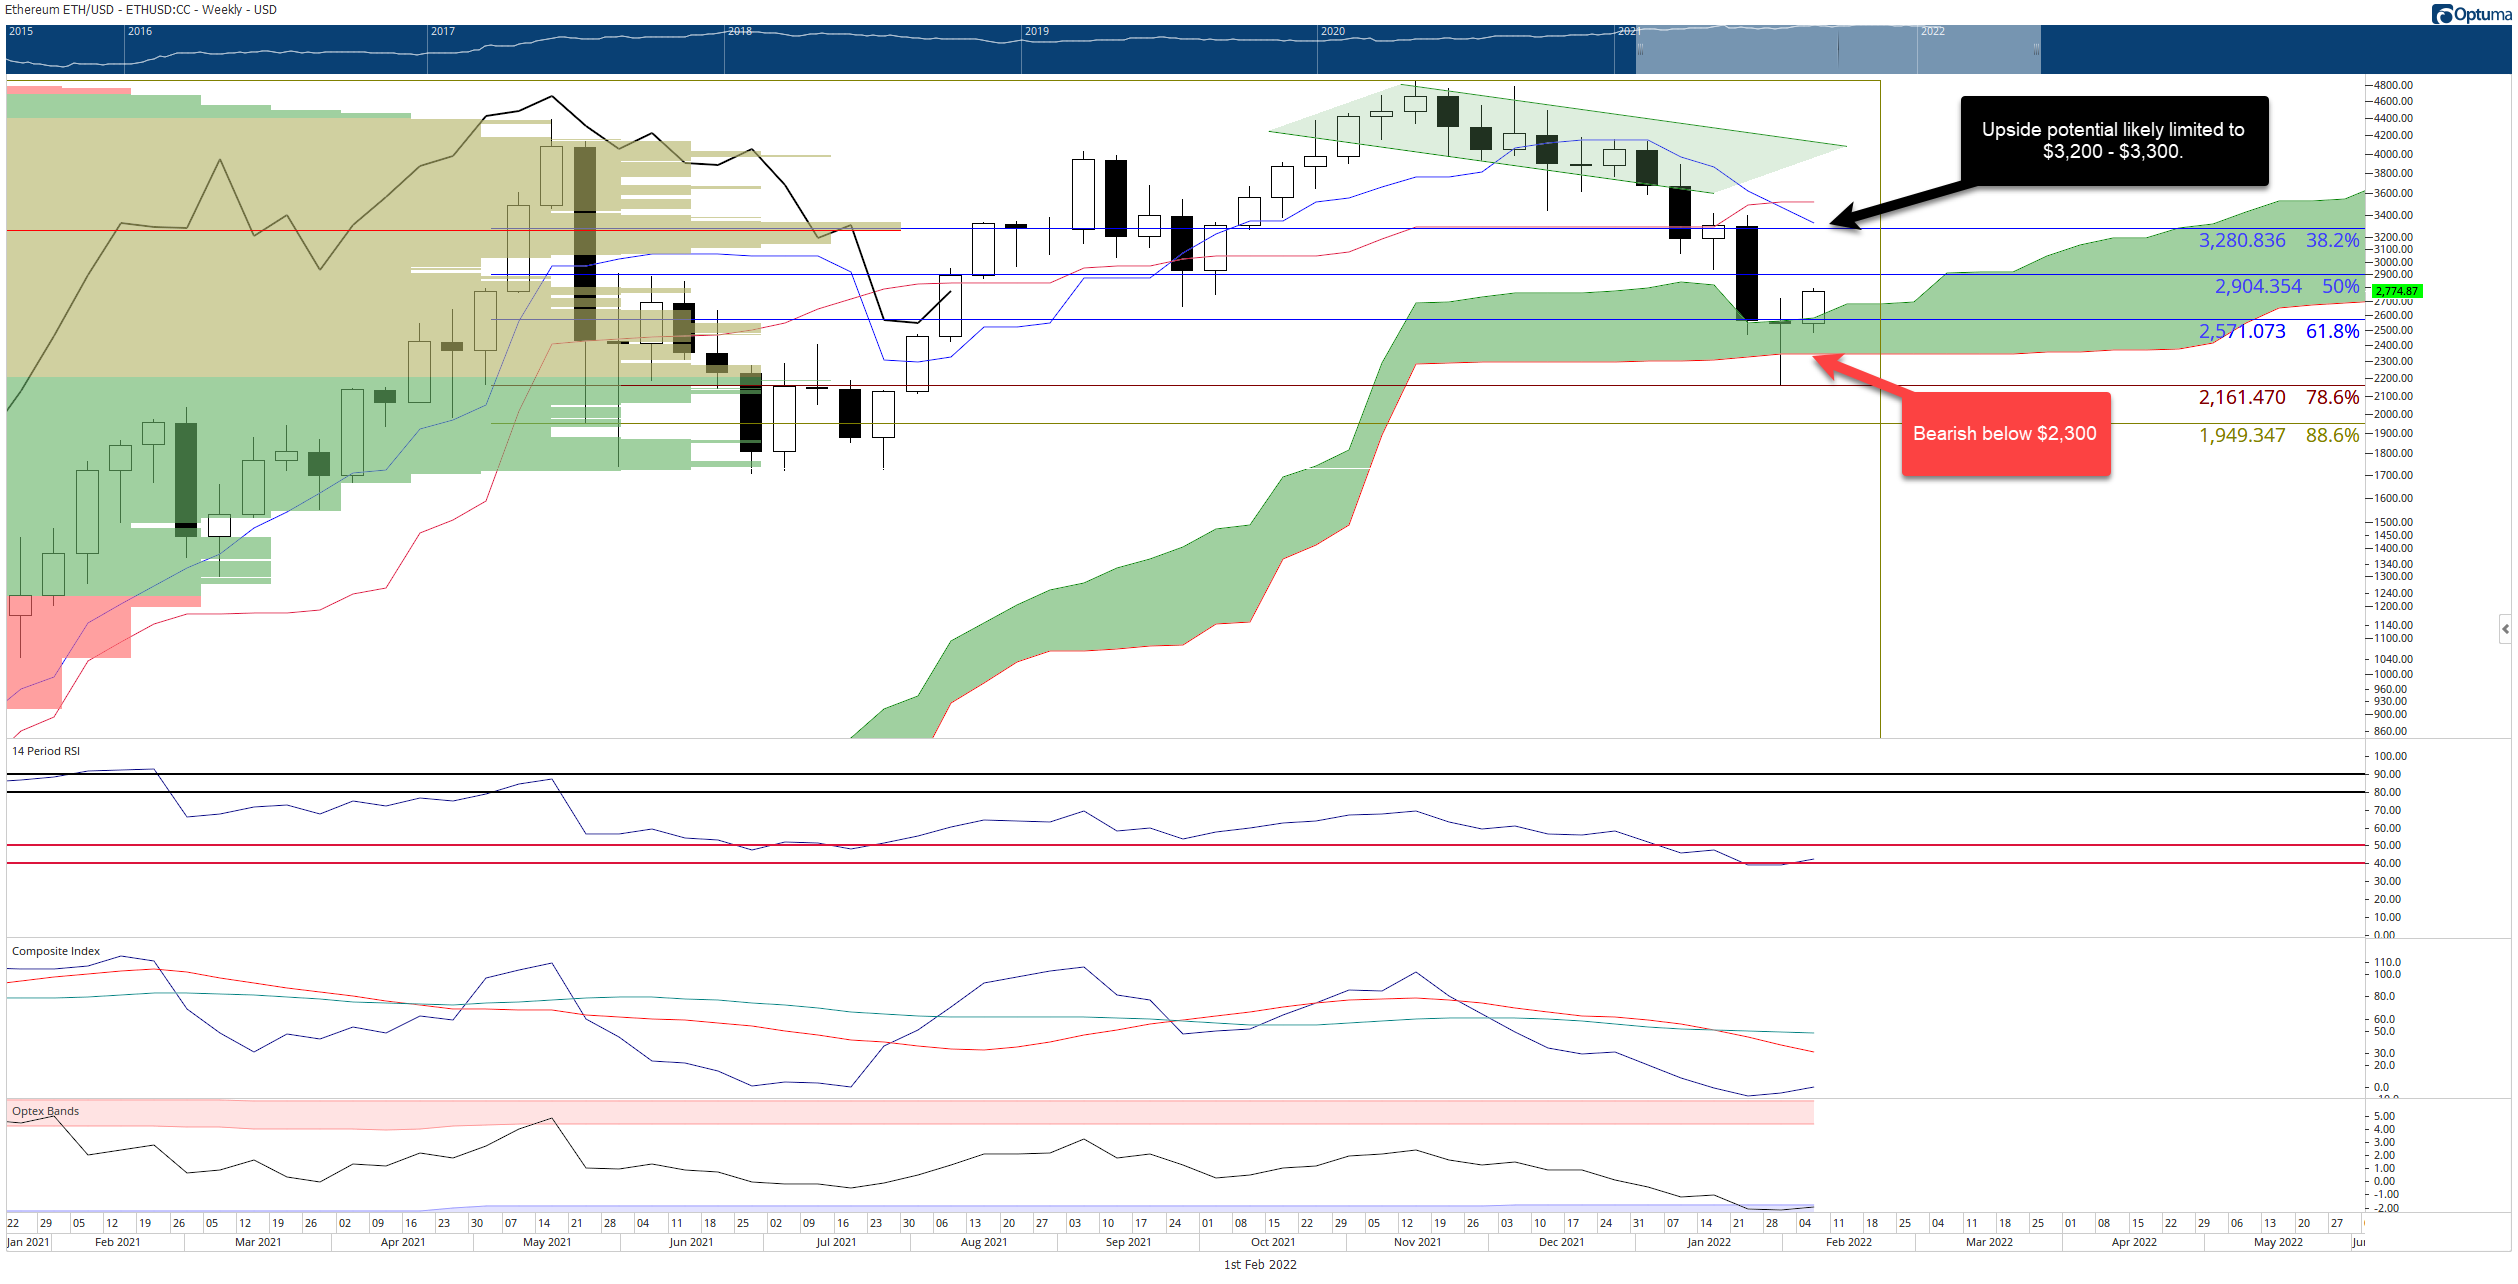
ETH/USD Weekly Ichimoku Kinko Hyo Chart
Upside potential is likely limited to the $3,300 value area where the 38.2$ Fibonacci retracement and weekly Tenkan-Sen exist. Any weekly close below the Cloud ($2,350) would trigger an Ideal Bearish Ichimoku Breakout and position Ethereum price for a swift move to the $1,800 value area.
XRP price holds $0.60, but too many bulls remain sidelined
XRP price recently triggered a bullish entry from a hypothetical long entry previously identified on January 26, 2022. The entry was a hypothetical long entry opportunity on its $0.01/3-box reversal Point and Figure chart. The trade setup was a buy stop order at $0.63, a stop loss at $0.59, and a profit target at $1.00. The trade represents a 7.2:1 reward/risk with an implied profit target of 58% from the entry.
It is currently trading just a hair below the original entry, but even an entry at $0.64 would still be appropriate given the risk's wide range of the reward. It is anticipated that because of the bullish reversal candlestick printed on the weekly Ichimoku chart, XRP price will have a strong initial bounce out of the $0.60 zone. Initial resistance should be expected between $0.80 (weekly Tenkan-Sen) and $0.84 (38.2% Fibonacci retracement).
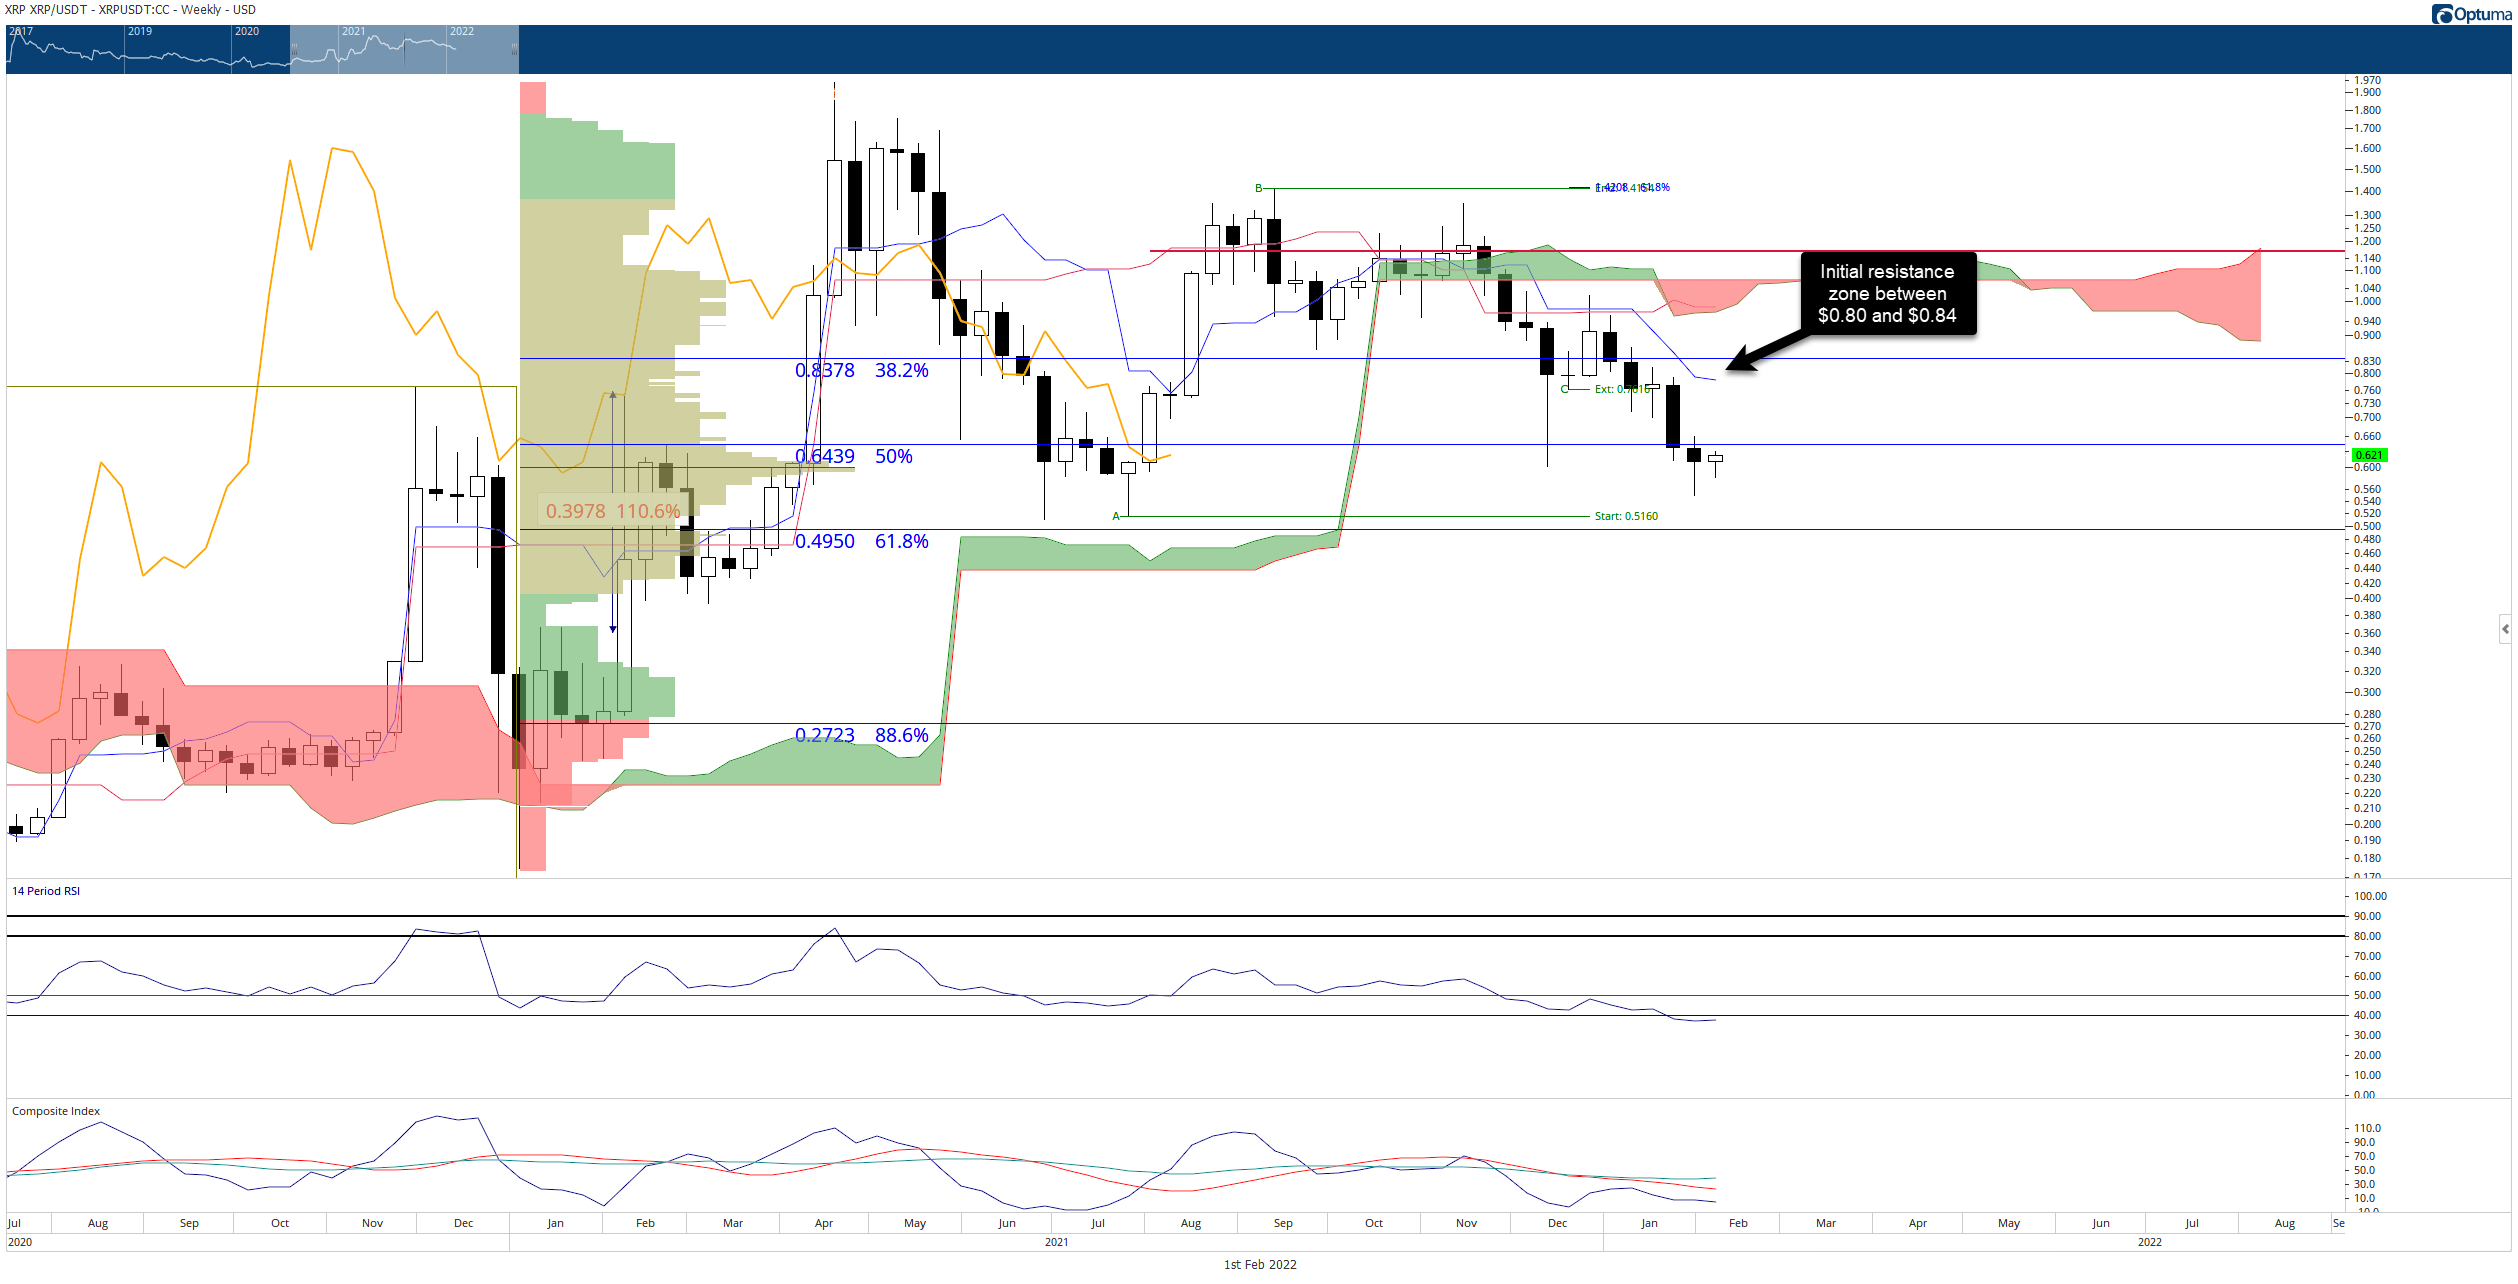
XRP/USDT Weekly Ichimoku Kinko Hyo Chart
Downside risks should be limited to the $0.50 value area. However, a weekly close below last week's low of $0.55 would invalidate any near-term bullish outlook.
Note: All information on this page is subject to change. The use of this website constitutes acceptance of our user agreement. Please read our privacy policy and legal disclaimer. Opinions expressed at FXstreet.com are those of the individual authors and do not necessarily represent the opinion of FXstreet.com or its management. Risk Disclosure: Trading foreign exchange on margin carries a high level of risk, and may not be suitable for all investors. The high degree of leverage can work against you as well as for you. Before deciding to invest in foreign exchange you should carefully consider your investment objectives, level of experience, and risk appetite. The possibility exists that you could sustain a loss of some or all of your initial investment and therefore you should not invest money that you cannot afford to lose. You should be aware of all the risks associated with foreign exchange trading, and seek advice from an independent financial advisor if you have any doubts.
Recommended Content
Editors’ Picks

Bitcoin holds $84,000 despite Fed’s hawkish remarks and spot ETFs outflows
Bitcoin is stabilizing around $84,000 at the time of writing on Thursday after facing multiple rejections around the 200-day EMA at $85,000 since Saturday. Despite risk-off sentiment due to the hawkish remarks by the US Fed on Wednesday, BTC remains relatively stable.

Crypto market cap fell more than 18% in Q1, wiping out $633.5 billion after Trump’s inauguration top
CoinGecko’s Q1 Crypto Industry Report highlights that the total crypto market capitalization fell by 18.6% in the first quarter, wiping out $633.5 billion after topping on January 18, just a couple of days ahead of US President Donald Trump’s inauguration.

Top meme coin gainers FARTCOIN, AIDOGE, and MEW as Trump coins litmus test US SEC ethics
Cryptocurrencies have been moving in lockstep since Monday, largely reflecting sentiment across global markets as United States (US) President Donald Trump's tariffs and trade wars take on new shapes and forms each passing day.

XRP buoyant above $2 as court grants Ripple breathing space in SEC lawsuit
A US appellate court temporarily paused the SEC-Ripple case for 60 days, holding the appeal in abeyance. The SEC is expected to file a status report by June 15, signaling a potential end to the four-year legal battle.
Bitcoin Weekly Forecast: Market uncertainty lingers, Trump’s 90-day tariff pause sparks modest recovery
Bitcoin (BTC) price extends recovery to around $82,500 on Friday after dumping to a new year-to-date low of $74,508 to start the week. Market uncertainty remains high, leading to a massive shakeout, with total liquidations hitting $2.18 billion across crypto markets.

The Best brokers to trade EUR/USD
SPONSORED Discover the top brokers for trading EUR/USD in 2025. Our list features brokers with competitive spreads, fast execution, and powerful platforms. Whether you're a beginner or an expert, find the right partner to navigate the dynamic Forex market.