![]() Jonathan Morgan
Jonathan Morgan
Independent Analyst
- Bitcoin price makes new five-month and 2022 lows but nears a major support level.
- Ethereum price hits major historical lows in its oscillators, signaling strong oversold conditions.
- XRP price approaches the lowest weekly close in six months – but right inside a massive support zone.
Bitcoin price has made a significant dip this week, dropping more than 11% and returning levels not trades since August 2021. Etheruem price hits new three-month lows, threatens a return to the $2,300 value area. XRP price looks determined to push lower to the $0.65 support zone before generating another bull run.
Bitcoin price enters buy zone; downside risks limited
Despite the substantial drop, Bitcoin price has gotten very close to one of the most intense support levels on its weekly chart: the bottom of the Ichimoku Cloud (Senkou Span B). Within the Ichimoku Kinko Hyo system, the strongest support and resistance level is Senkou Span B.
Senkou Span B sits in a value area between $37.500 and $38,000 – a value area currently being tested by Bitcoin. It is very likely that support has been hit, generating a buy zone for Bitcoin. There is a regular bullish divergence between the candlestick chart and the Composite Index, supporting near-term support occurring at $38,000. Additionally, the Optex Bands oscillator resting just above the extremely oversold level adds to the thesis that support has been found.
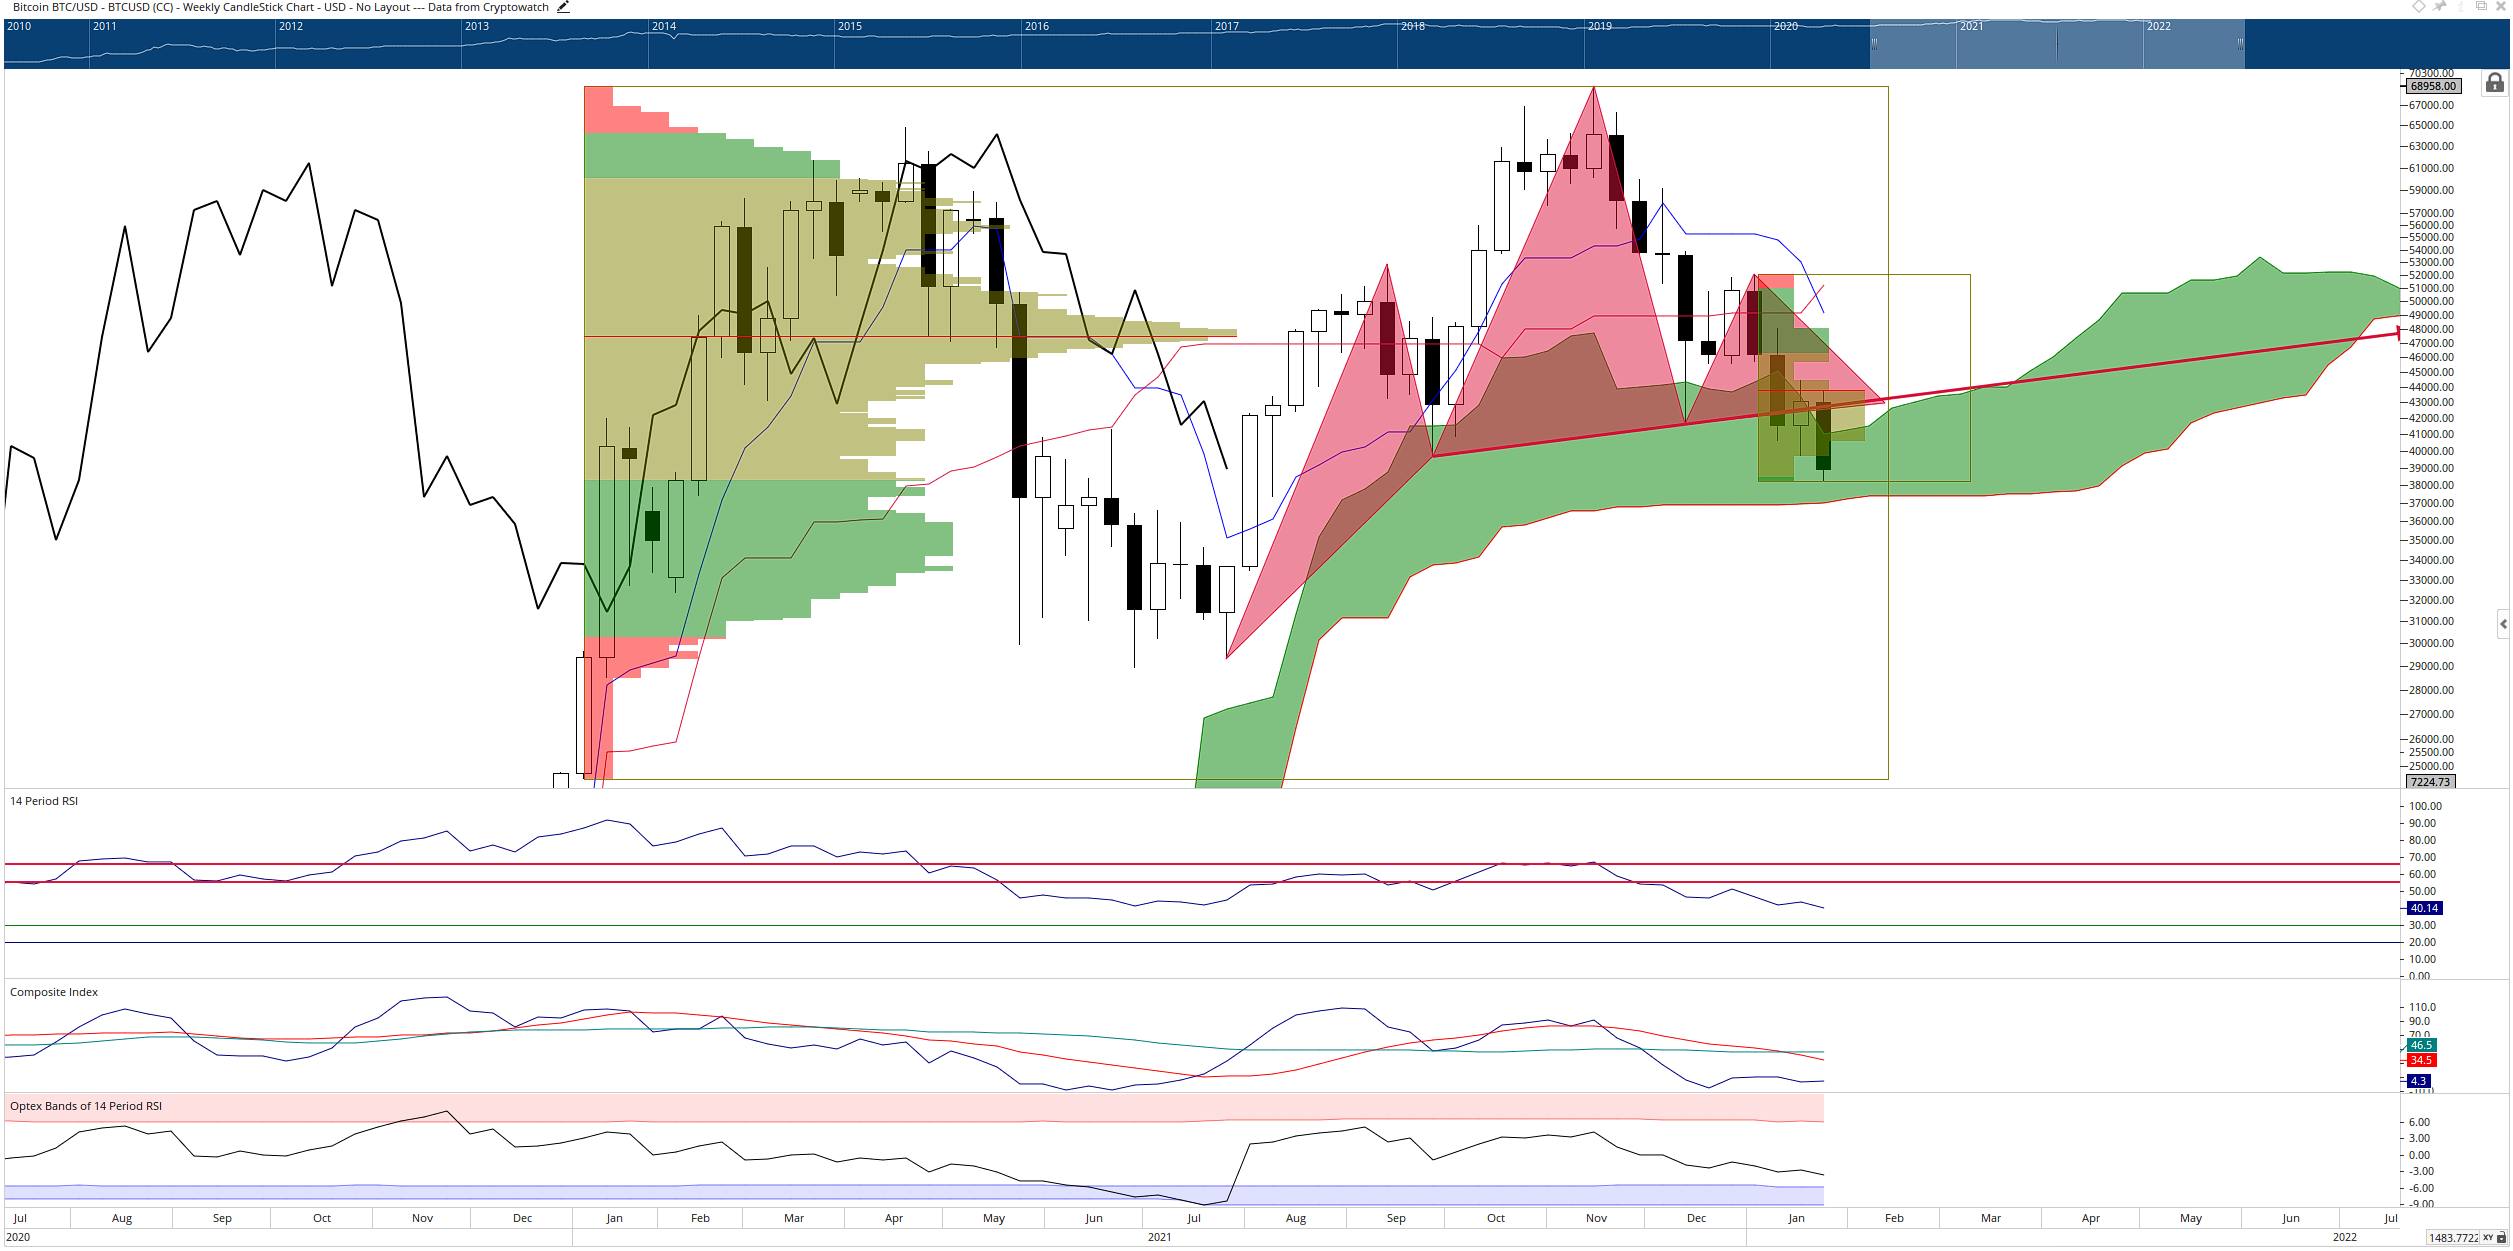
BTC/USD Weekly Ichimoku Kinko Hyo Chart
If Bitcoin experiences a close where the Chikou Span is below the bodies of the candlesticks and the close is below the Cloud, then a much more violent sell-off would likely occur, pushing Bitcoin to the $20,000 value area very quickly. Upside potential is likely limited to the $49,000 price level.
Ethereum price remains above primary weekly Ichimoku support zones but closes in on solid support
Ethereum price remains above the top of the Cloud (Senkou Span A) at $2,500, a price level that ETH could quickly drop to and test. Ethereum may likely need to hit Senkou Span A before a new rally can commence, but it is not necessary. From an oscillator perspective, reasons abound why Ethereum may bounce very soon.
The Relative Strength Index remains in a bull market and is currently testing the last oversold condition at 40, hovering just above at 42. The Optex Bands oscillator, likewise, has moved into extreme oversold conditions. Finally, the most critical oscillator condition is the location of the Composite Index. There is a dramatic, almost imperceptible hidden bullish divergence between the candlestick chart and the Composite Index.
It's important to note the historical significance of these oscillator values. The last time the Optex Bands oscillator was near its present value area was in December 2019. The Relative Strength Index is trading at the same level it was in March 2020. Finally, the Composite Index has hit lows not seen since September 2019.
The combination of Ethereum near a strong support price level, the RSI near its final oversold level, the Optex Bands at extreme oversold conditions with the hidden bullish divergence in the Composite Index creates a concoction that could generate a flash spike higher for Ethereum at any moment.
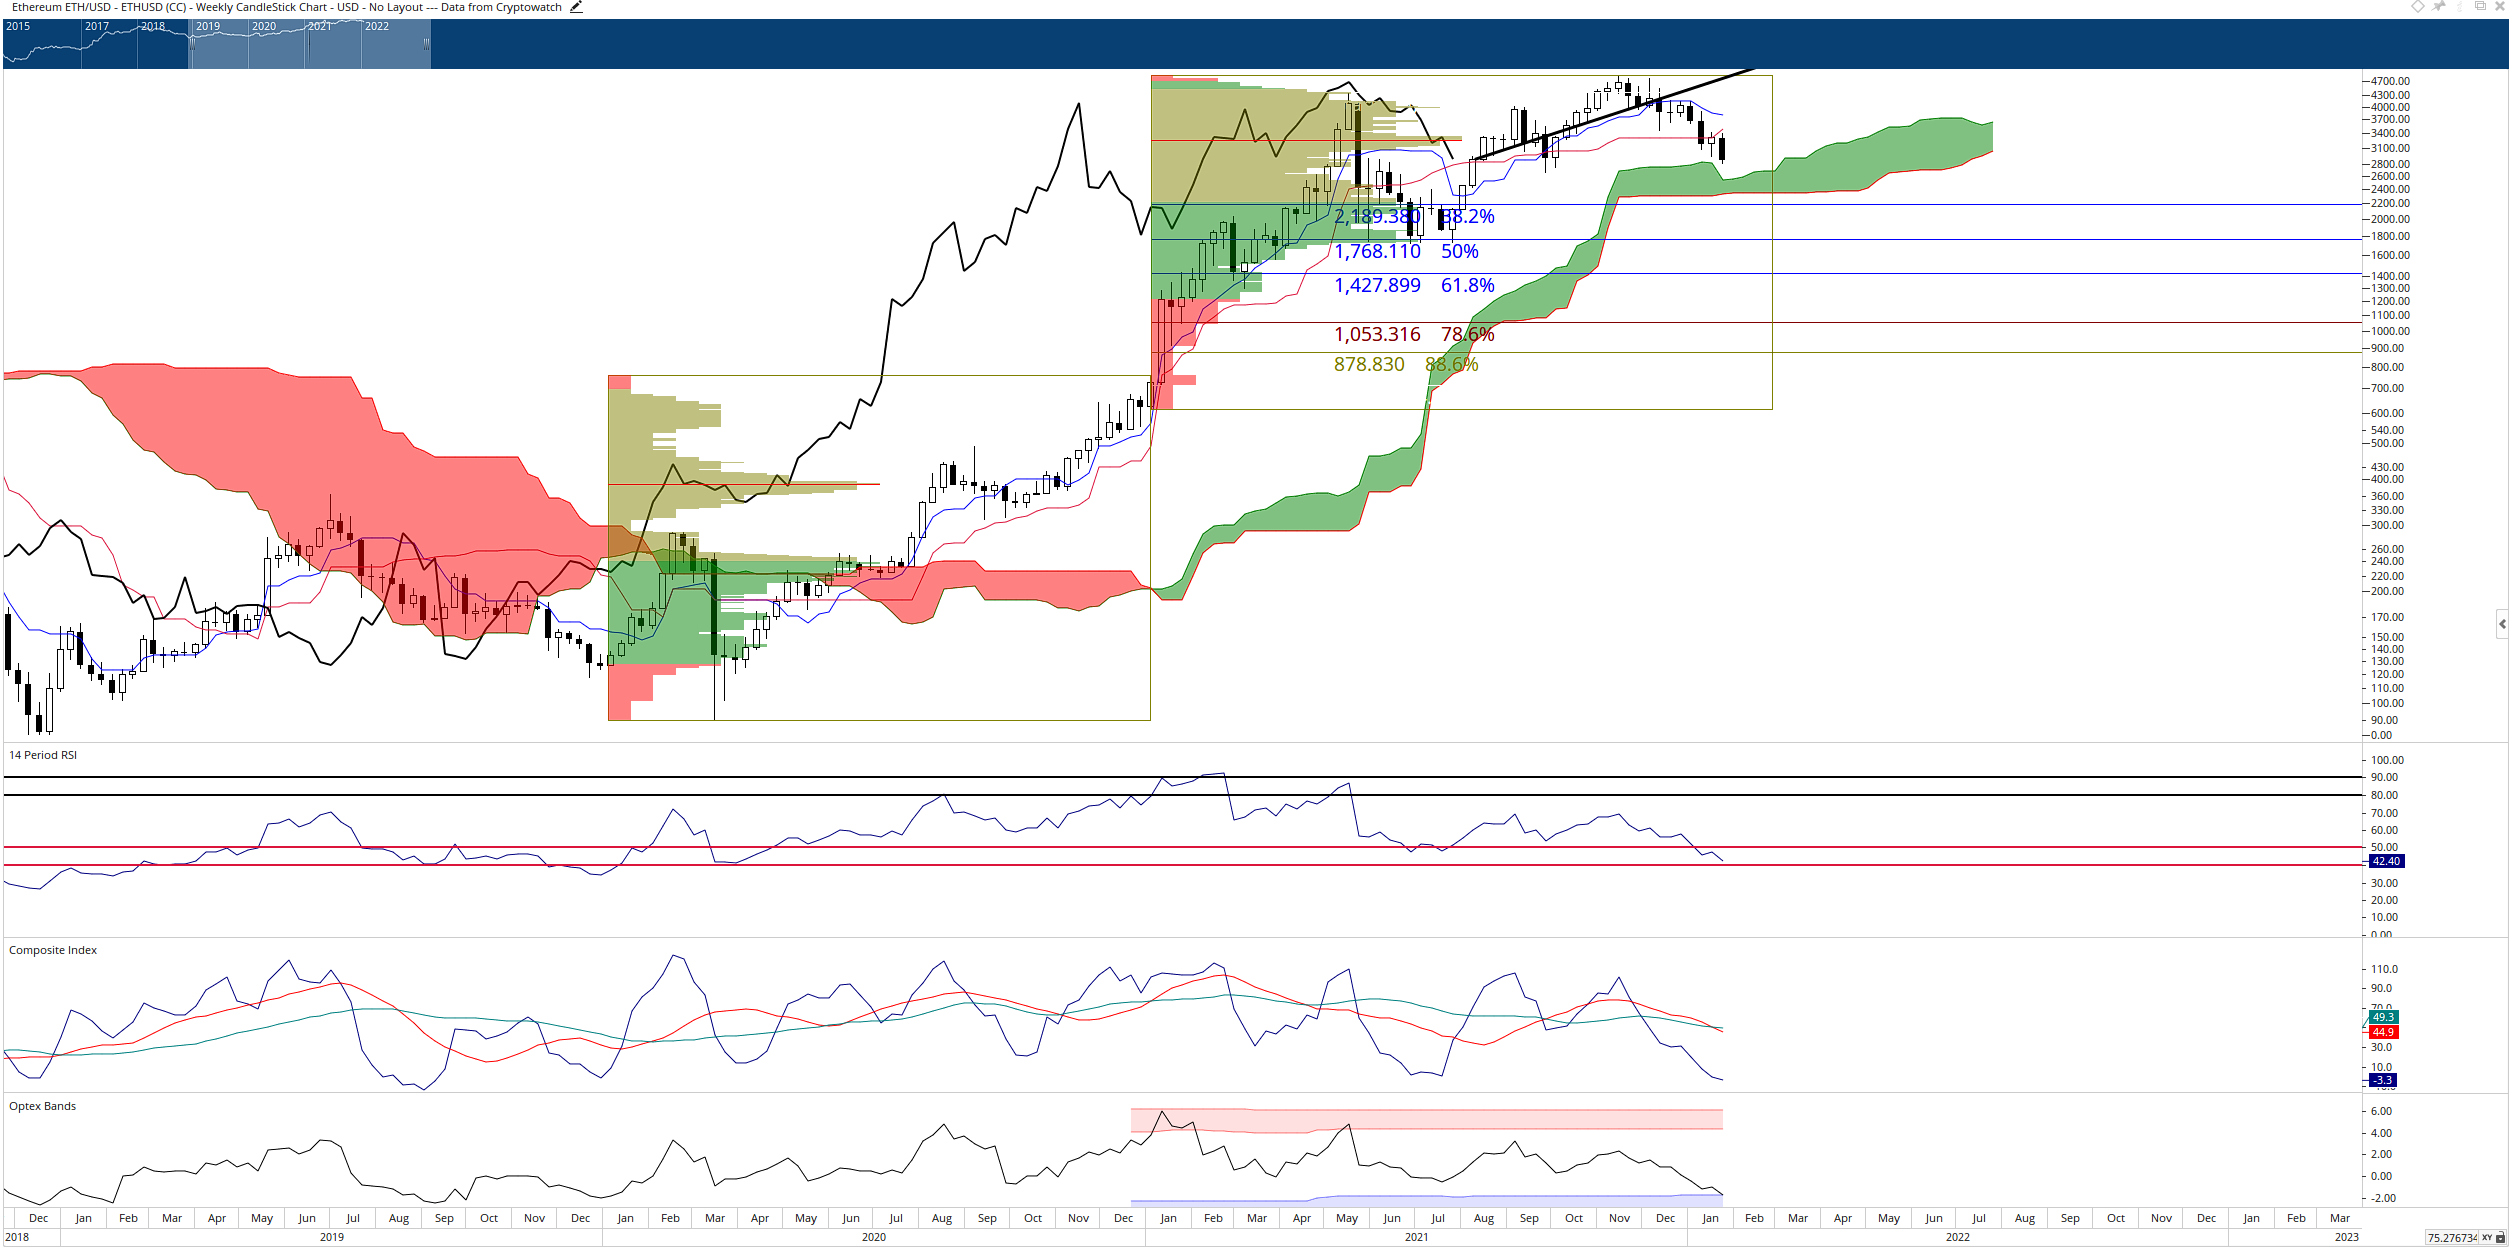
ETH/USD Weekly Ichimoku Kinko Hyo Chart
Downside risks for Ethereum could most certainly drop to the bottom of the Cloud (Senkou Span B) in the $2,300 value area – any weekly close below that zone would initiate an Ideal Bearish Ichimoku Breakout move that could trigger a flash-crash towards $1,500. Upside potential is likely limited to the $4,000 value area.
XRP price approaches new five-month and 2022 lows – but just inside a buy zone
XRP price action has certainly been some of last year's most boring, bearish, and disappointing. The combination of US customers essentially blocked from buying XRP to the SEC's ongoing legal issues has put considerable fear, uncertainty, and doubt into Ripple. Any weakness in the broader market seems to impact XRP with a little more strength than other altcoins.
However, XRP price is not without some hope. XRP price is quickly approaching one of the most potent support zones on its chart. The 50% Fibonacci retracement at $0.65 and the Volume Point Of Control at $0.61 represent the single most vital support zone on XRP's chart. As a result, traders should expect significant volatility and whipsaws in price action (even anomalous wicks down to the $0.50 range) the closer XRP gets to $0.61 – but in the end, support should hold.
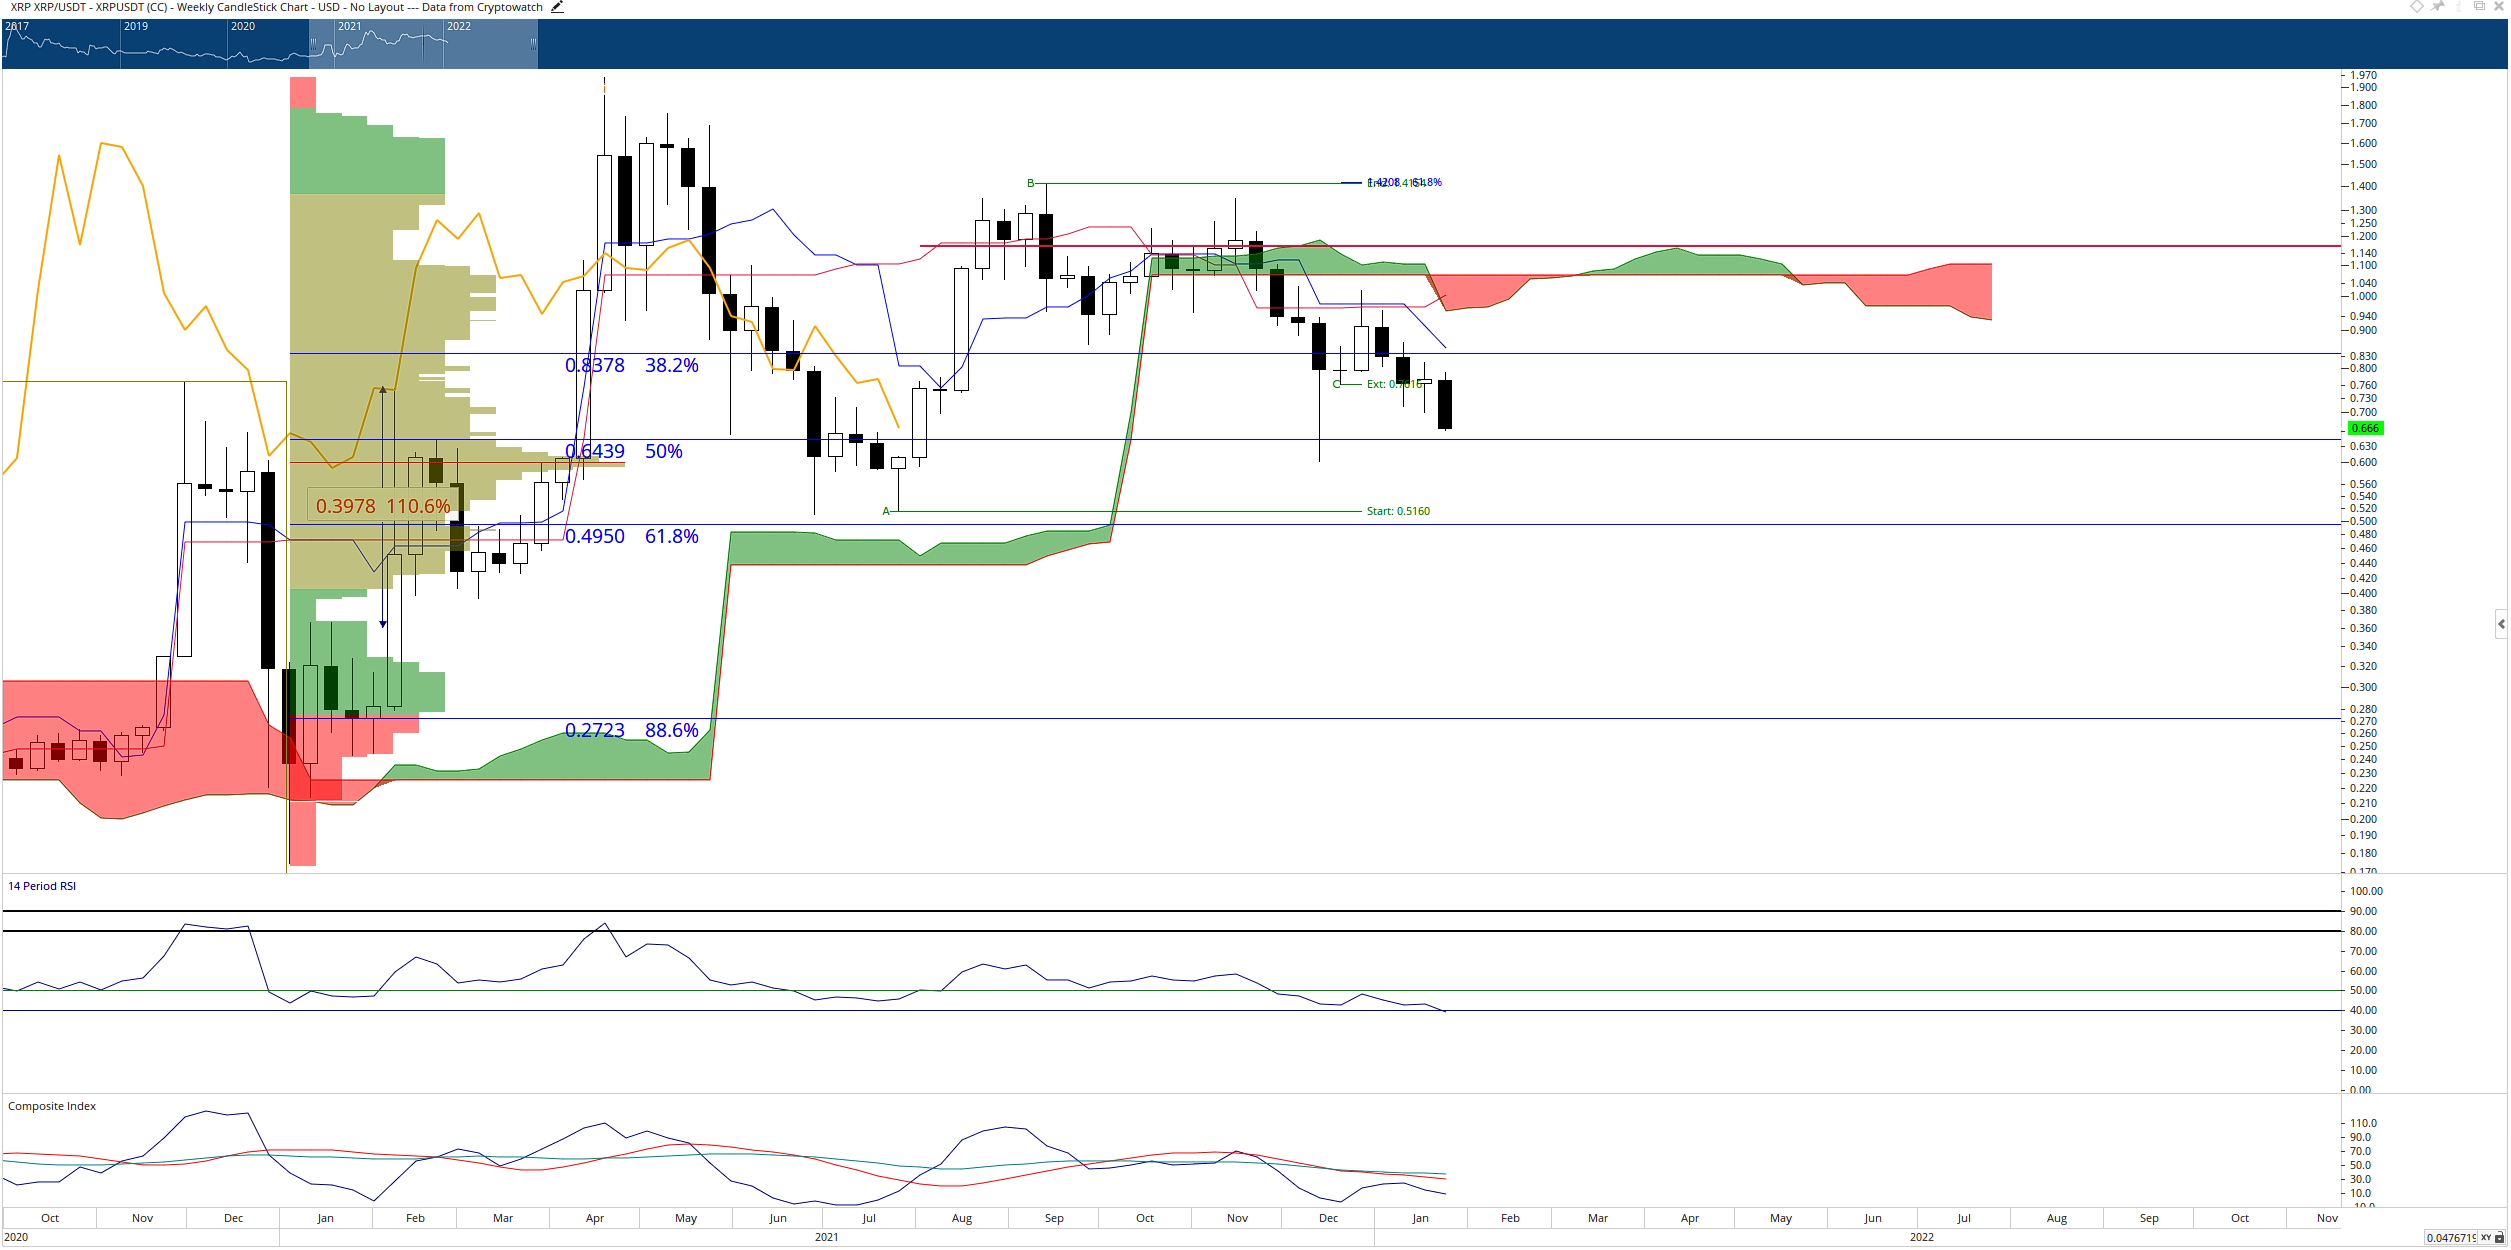
XRP/USDT Weekly Ichimoku Kinko Hyo Chart
A weekly close below $0.60 would position XRP into an Ideal Bearish Ichimoku Breakout setup and invalidate any remaining bullish outlook.
Note: All information on this page is subject to change. The use of this website constitutes acceptance of our user agreement. Please read our privacy policy and legal disclaimer. Opinions expressed at FXstreet.com are those of the individual authors and do not necessarily represent the opinion of FXstreet.com or its management. Risk Disclosure: Trading foreign exchange on margin carries a high level of risk, and may not be suitable for all investors. The high degree of leverage can work against you as well as for you. Before deciding to invest in foreign exchange you should carefully consider your investment objectives, level of experience, and risk appetite. The possibility exists that you could sustain a loss of some or all of your initial investment and therefore you should not invest money that you cannot afford to lose. You should be aware of all the risks associated with foreign exchange trading, and seek advice from an independent financial advisor if you have any doubts.
Recommended Content
Editors’ Picks

Top 3 Price Prediction Bitcoin, Ethereum, Ripple: BTC, ETH, and XRP decline as President Trump’s team considers “broader and higher tariffs”
Bitcoin continues its decline, trading below $82,000 on Monday after falling 4.29% the previous week. Ethereum and Ripple followed BTC’s footsteps and declined by 9.88% and 12.40%, respectively.

XRP Price Forecast: Weak demand and rising supply could trigger a downtrend
Ripple's XRP is down 7% on Friday following bearish pressure from macroeconomic factors, including United States (US) President Donald Trump's tariff threats and rising US inflation.

Crypto Today: XRP, SOL and ETH prices tumble as South Carolina moves to buy up to 1 million BTC
Bitcoin price tumbled below the $85,000 support on Friday, plunging as low as $84,200 at press time. The losses sparked over $449 million in liquidations across the crypto derivatives markets.

Hackers accelerate ETH decline following $27 million dump, bearish macroeconomic factors
Ethereum (ETH) declined below $2,000 on Friday following a series of hacks traced to accounts of crypto exchange Coinbase users, which caused a loss of $36 million.

Bitcoin: BTC remains calm before a storm
Bitcoin's price has been consolidating between $85,000 and $88,000 this week. A K33 report explains how the markets are relatively calm and shaping up for volatility as traders absorb the tariff announcements. PlanB’s S2F model shows that Bitcoin looks extremely undervalued compared to Gold and the housing market.

The Best brokers to trade EUR/USD
SPONSORED Discover the top brokers for trading EUR/USD in 2025. Our list features brokers with competitive spreads, fast execution, and powerful platforms. Whether you're a beginner or an expert, find the right partner to navigate the dynamic Forex market.