- Bitcoin price shows smart money accumulation signals. A bottom may be near.
- Ethereum price is likely to witness an influx of volatility, a swing trader's approach may be the most suitable.
- Ripple price remains in a bearish stronghold based on recent bearish influence.
Part two of an Elliott Wave, technical, and on-chain anlalytical thesis used to gauge current market behavior and forecast the next directional moves in the crypto market.
Bitcoin price looks bullish under the hood
Bitcoin price currently trades at $19,982. The recent breach of the $20,000 barrier has many analysts calling for a sweep-the-lows event of the June 18 bottom at $17,622. Based on the technicals, the call is justified. The Volume Profile shows an uptick near the top of the August bullrun, signaling smart money involvement. Additionally, the bears have persistently rejected Bitcoin's re-entrance of the $20,000 barrier on intra-hour time frames.
Still, a few on-chain analytical tools convey a different message. For example, the Santiments' 365-day Bitcoin Circulation map shows a massive decline in yearly circulating tokens. There are currently 5.96 million tokens in circulation, which is the lowest reading in the last six years. The last time this amount of tokens were in active circulation was in 2016, when Bitcoin traded at $5,711.
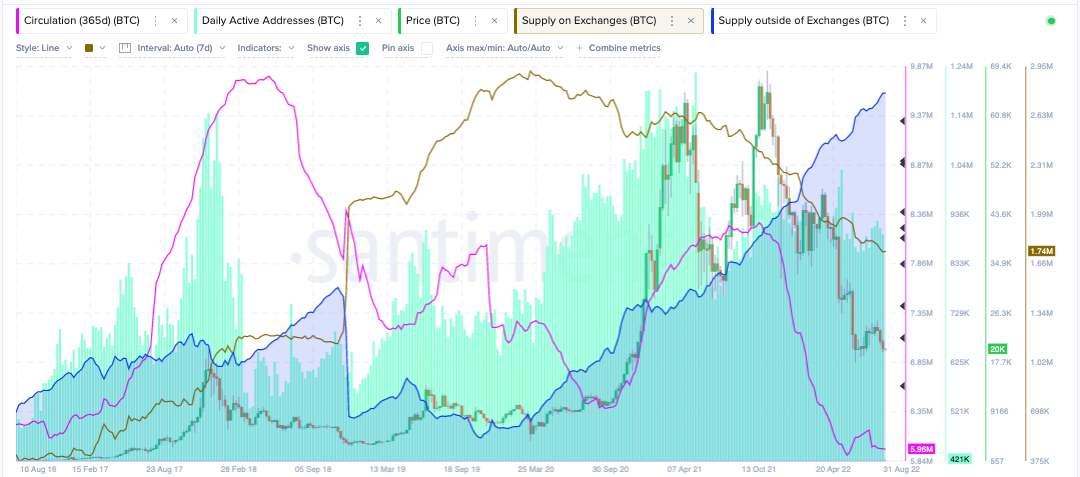
Santiment’s Price, 365-Day Circulation-Supply On & Off Exchanges Indicators
The Total Bitcoin Supply On All Crypto Exchanges indicator continues to fall. At 1.74 million currently, the exchanges are holding the lowest amount of liquid Bitcoins since October 2018, just before Bitcoin fell from $6,000 to the $3,000 lows.
Lastly, the Supply Outside of Exchanges indicator is going parabolic. At a new all-time high of 2.75 million Bitcoins, this indicator suggests whoever is buying Bitcoin is uninterested in short-term gains. In theory, the lower supply of tokens on the exchanges creates more demand for the token amongst retail and institutional investors.
In the following video, our analysts deep dive into the price action of Bitcoin, analyzing key levels of interest in the market. -FXStreet Team
Ethereum price tells a different story
Ethereum price has outperformed Bitcoin this summer by nearly 150%. Compared to Bitcoin’s 42% rally, the decentralized smart contract saw an increase of 126% since the June 18 liquidation.
ETH price currently auctions at $1,571. The technicals show a downtick in volume amidst the current sell-off, which is an optimistic signal of more gains to come.
Still, on-chain analysis tools suggest ETH will have difficulty repeating its impressive performance. Unlike Bitcoin, Santiment's Total Supply on Exchanges Indicator is actually turning to the upside.
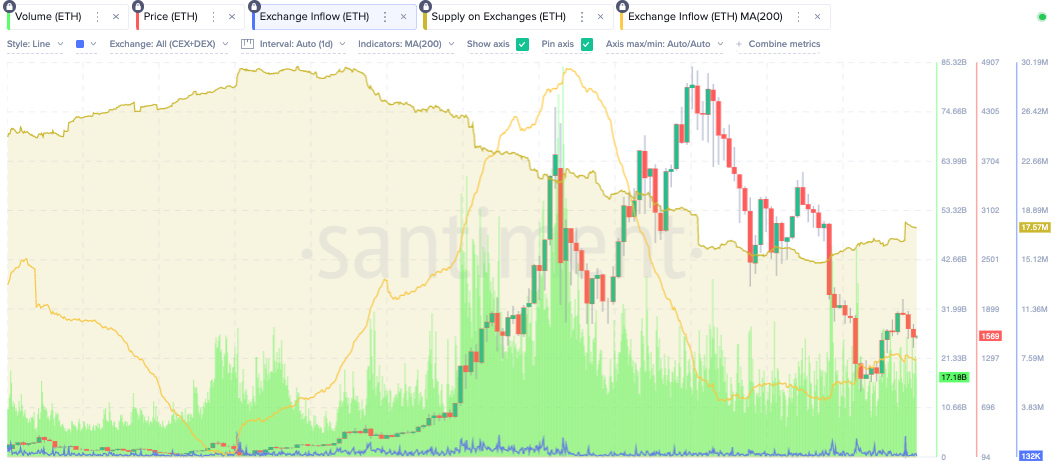
Santiment’s Price, Volume, 365-Day Circulation-Supply On Exchanges Indicators
Currently, at 17.6 million tokens, the last time the Ethereum inventory was this high on all exchanges was in November 2021, when the ETH price auctioned between the $4,200-$4,600 range.
In theory, the indicator suggests Ethereum price could be a volatile token ideal for day traders in the coming weeks. However, new all-time highs will be harder to accomplish than for its Bitcoin counterpart.
In the following video, our analysts deep dive into the price action of Ethereum, analyzing key levels of interest in the market. -FXStreet Team
Ripple price remains in bearish limbo
XRP price currently auctions at $0.325 as the digital remittance continues to underperform relative to its peers. Since June, the digital remittance token has rallied by 35%. What had once appeared to be a profit-taking consolidation near $0.37 ended up morphing into an all-out sellers frenzy, with the Ripple price declining 10% in one day on August 19.
The bearish August 19 engulfing candle is now the largest candle for the summer, hinting that the bears are now in control. The Volume Profile Indicator is progressively increasing in transactions amidst each market decline. Lastly, the XRP price has witnessed a rejection from both the 8- & 21-day simple moving averages, which will likely entice sidelined bears to jump in for more downside potential.
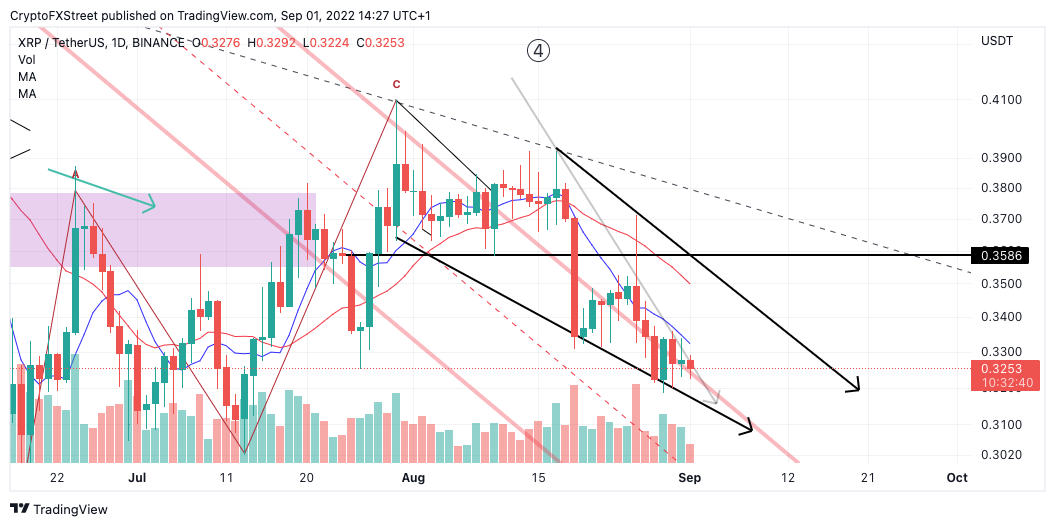
XRP/USDT 1-day chart
When combined, the XRP price could dispel a whirlwind of pain in the coming weeks. The bears are likely aiming for targets between $0.28 and $0.24. Traders looking to join the trend should keep an invalidation point above $0.41.
Traders should be wary of placing an entry too soon as closing a candle above $0.33 on the daily level could catalyze a sharp rise towards $0.37 in the short term.
In the following video, our analysts deep dive into the price action of Ripple, analyzing key levels of interest in the market. -FXStreet Team
Information on these pages contains forward-looking statements that involve risks and uncertainties. Markets and instruments profiled on this page are for informational purposes only and should not in any way come across as a recommendation to buy or sell in these assets. You should do your own thorough research before making any investment decisions. FXStreet does not in any way guarantee that this information is free from mistakes, errors, or material misstatements. It also does not guarantee that this information is of a timely nature. Investing in Open Markets involves a great deal of risk, including the loss of all or a portion of your investment, as well as emotional distress. All risks, losses and costs associated with investing, including total loss of principal, are your responsibility. The views and opinions expressed in this article are those of the authors and do not necessarily reflect the official policy or position of FXStreet nor its advertisers. The author will not be held responsible for information that is found at the end of links posted on this page.
If not otherwise explicitly mentioned in the body of the article, at the time of writing, the author has no position in any stock mentioned in this article and no business relationship with any company mentioned. The author has not received compensation for writing this article, other than from FXStreet.
FXStreet and the author do not provide personalized recommendations. The author makes no representations as to the accuracy, completeness, or suitability of this information. FXStreet and the author will not be liable for any errors, omissions or any losses, injuries or damages arising from this information and its display or use. Errors and omissions excepted.
The author and FXStreet are not registered investment advisors and nothing in this article is intended to be investment advice.
Recommended Content
Editors’ Picks

Bitcoin, Ethereum and XRP steady as China slaps 125% tariff on US, weekend sell-off looming?
The Cryptocurrency market shows stability at the time of writing on Friday, with Bitcoin (BTC) holding steady at $82,584, Ethereum (ETH) at $1,569, and Ripple (XRP) maintaining its position above $2.00.

Bitcoin Weekly Forecast: Market uncertainty lingers, Trump’s 90-day tariff pause sparks modest recovery
Bitcoin price extends recovery to around $82,500 on Friday after dumping to a new year-to-date low of $74,508 to start the week. Market uncertainty remains high, leading to a massive shakeout, with total liquidations hitting $2.18 billion across crypto markets.

Bitcoin, Ethereum, Dogecoin and Cardano stabilze – Why crypto is in limbo
Bitcoin, Ethereum, Dogecoin and Cardano stabilize on Friday as crypto market capitalization steadies around $2.69 trillion. Crypto traders are recovering from the swing in token prices and the Monday bloodbath.

Can FTX’s 186,000 unstaked SOL dampen Solana price breakout hopes?
Solana price edges higher and trades at $117.31 at the time of writing on Friday, marking a 3.4% increase from the $112.80 open. The smart contracts token corrected lower the previous day, following a sharp recovery to $120 induced by US President Donald Trump’s 90-day tariff pause on Wednesday.
Bitcoin Weekly Forecast: Market uncertainty lingers, Trump’s 90-day tariff pause sparks modest recovery
Bitcoin (BTC) price extends recovery to around $82,500 on Friday after dumping to a new year-to-date low of $74,508 to start the week. Market uncertainty remains high, leading to a massive shakeout, with total liquidations hitting $2.18 billion across crypto markets.

The Best brokers to trade EUR/USD
SPONSORED Discover the top brokers for trading EUR/USD in 2025. Our list features brokers with competitive spreads, fast execution, and powerful platforms. Whether you're a beginner or an expert, find the right partner to navigate the dynamic Forex market.