- Bitcoin tried to regain market share and activated sales in the Altcoin segment.
- BTC/USD, ETH/USD and XRP/USD are looking for supports and a rebound to push them to new relative highs.
- The current compression on the XRP/USD chart could trigger an exploding movement.
The cryptocurrency market reaches the end of the week with widespread declines in the crypto market. The week has been dominated by a boiling Altcoin segment that has set very significant rises.
The Bitcoin dominance chart was plummeting in the early hours of yesterday and picking up speed, threatening to move quickly to level 60. But when it started to turn around, the party was over on the rest of the board.
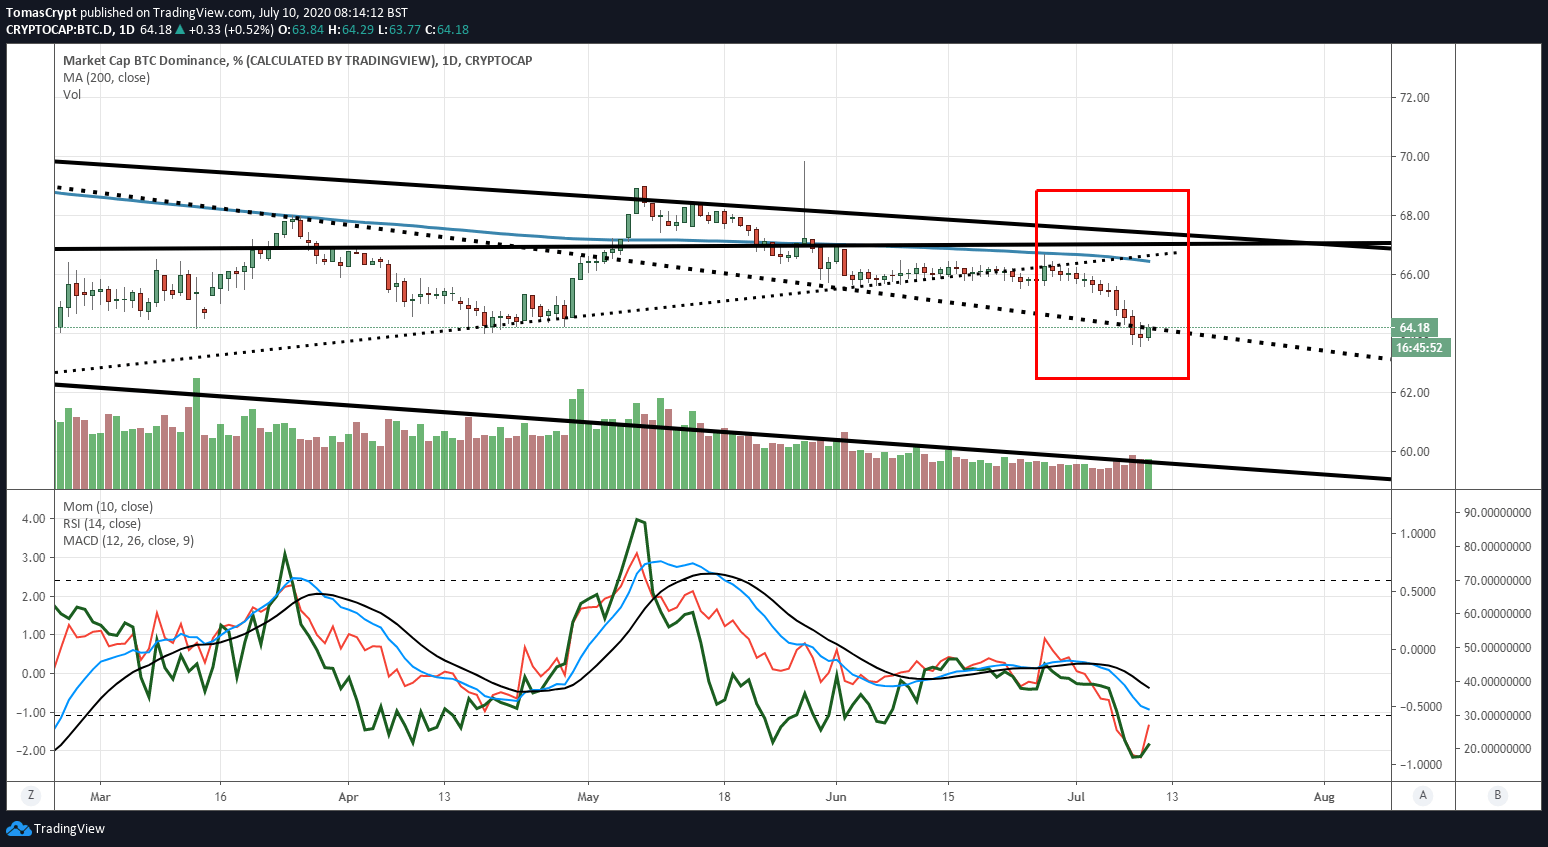
Sales in the Altcoin segment accelerated and ended up infecting the two market leaders.
Now at the start of the European session, Bitcoin is trying to overcome the dominance level of 64.15, causing the smaller cryptos to slow down because the environment is no longer favorable for them. Today's close will determine the development of the next weeks.
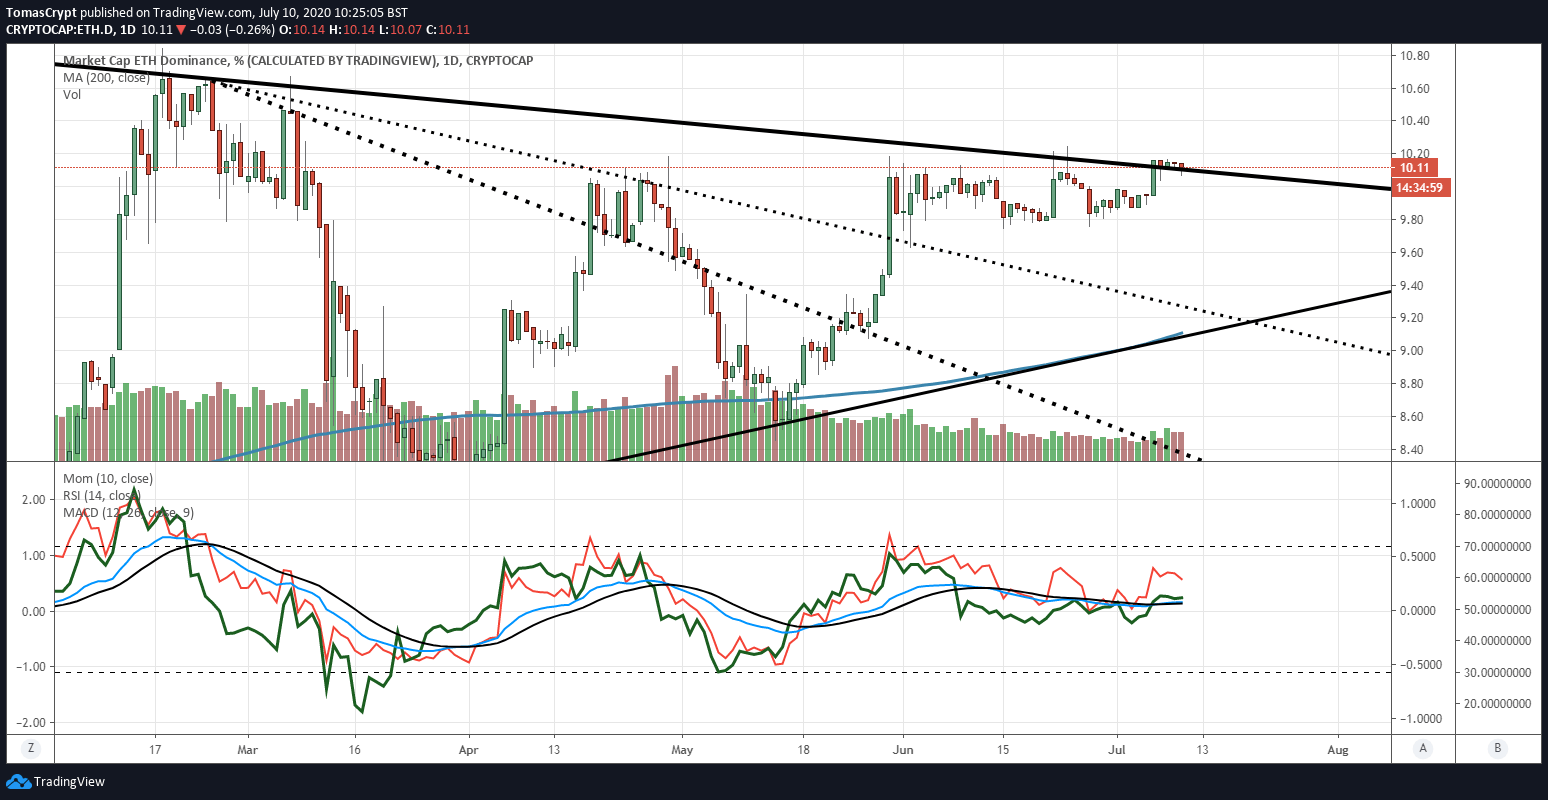
Ethereum shows a lot of strength and remains above the critical support level that goes through the 10% dominance level. The technical indicators in the Ethereum dominance chart keep the bullish pattern active, so the short term outlook remains favorable in the short term.
ETH/BTC Daily Chart
The ETH/BTC pair is currently trading at the price level of 0.02599 and imperfectly draws on the chart a classic return figure in Japanese candlestick reading. A close below 0.026 would lead to a loss of momentum for the ETH/BTC, tending to consolidation rather than significant declines.
Above the current price, the first resistance level is at 0.0276, then the second at 0.0295 and the third one at 0.0307.
Below the current price, the first support level is at 0.026, then the second at 0.0248 and the third one at 0.0235.
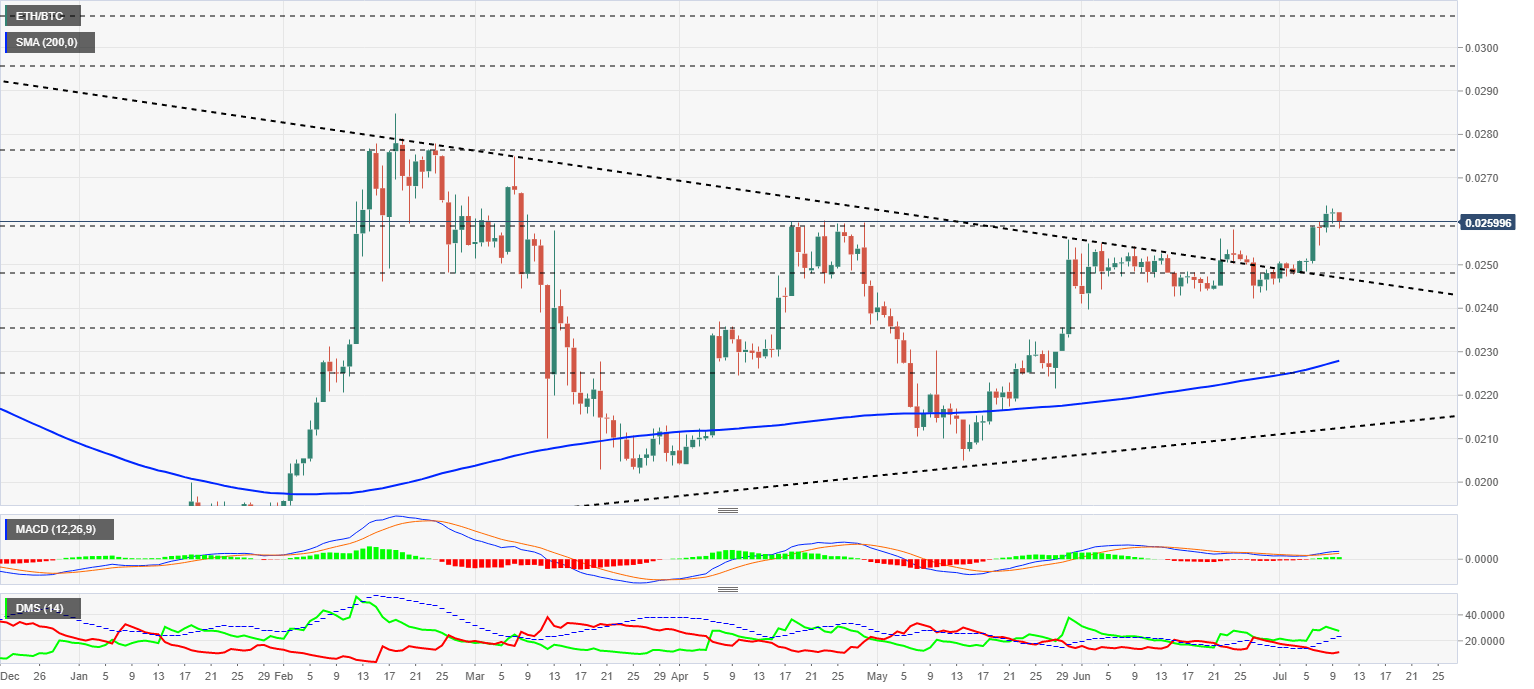
The MACD on the daily chart is losing its already weak bullish profile and is approaching a horizontal position that would confirm the loss of momentum.
The DMI on the daily chart shows the bulls controlling the ETH/BTC pair, although they are also losing momentum and appear to be looking for support at the ADX line. The bears are moving upwards and confirm the quick reaction of the sell-side.
BTC/USD Daily Chart
The BTC/USD pair is currently trading at the price level of $9172 and is moving towards the current scenario support level of $8900. Resistance at $9500 has been impossible to overcome and becomes the main challenge for the BTC/USD pair.
Above the current price, the first resistance level is at $9500, then the second at $10425 and the third one at $10700.
Below the current price, the first support level is at $8900, then the second at $8750 and the third one at $8450.
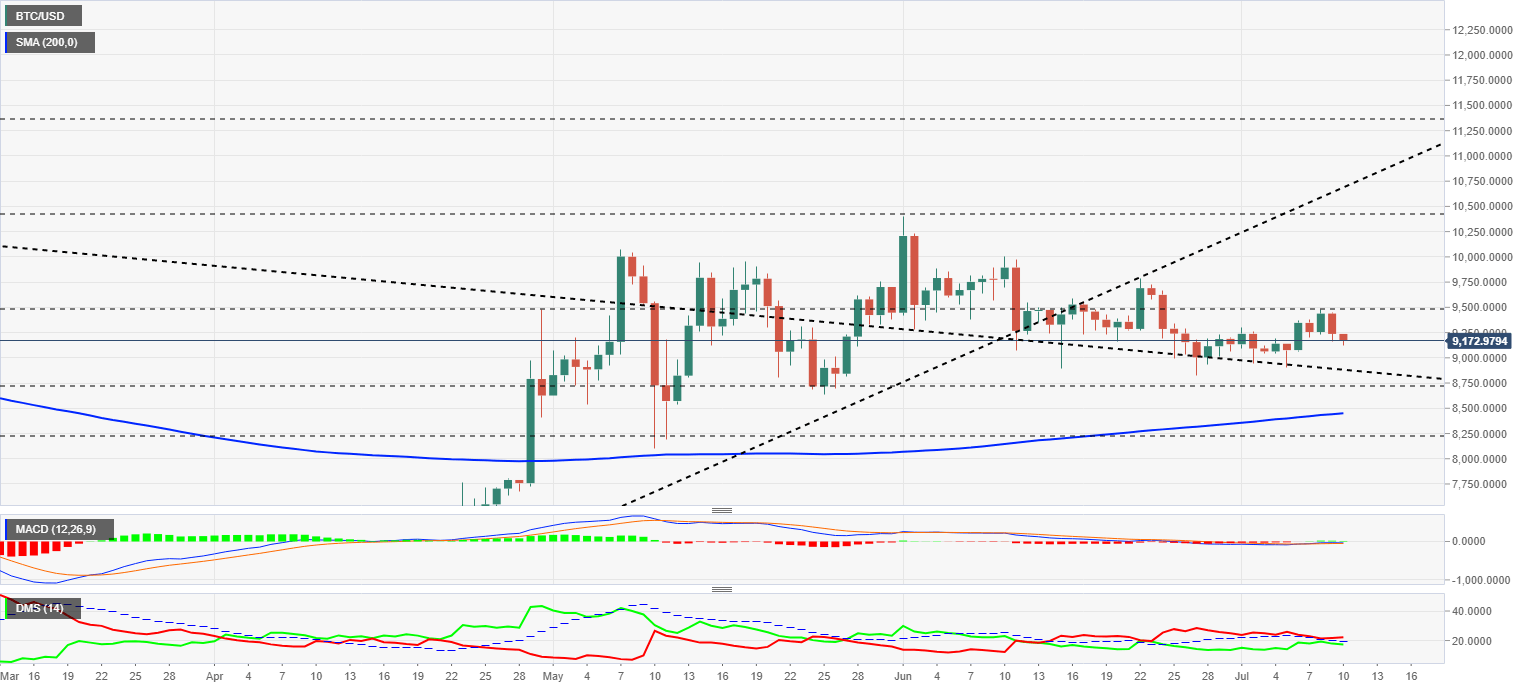
The MACD on the daily chart maintains one more day the horizontal and directionless profile of the last weeks. Despite the rise in the previous few days, the indicator is still in the negative territory.
The DMI on the daily chart shows bears leading the pair with a slight advantage over bulls. The presence of the ADX line above the bullish side positions limits the potential for the bulls to gain strength.
ETH/USD Daily Chart
The ETH/USD pair is currently trading at the $238.4 price level as it moves in search of support at the $235 level after failing to break above the $245 level.
Above the current price, the first resistance level is at $245, then the second at $260 and the third one at $270.
Below the current price, the first support level is at $235, then the second at $220 and the third one at $200.
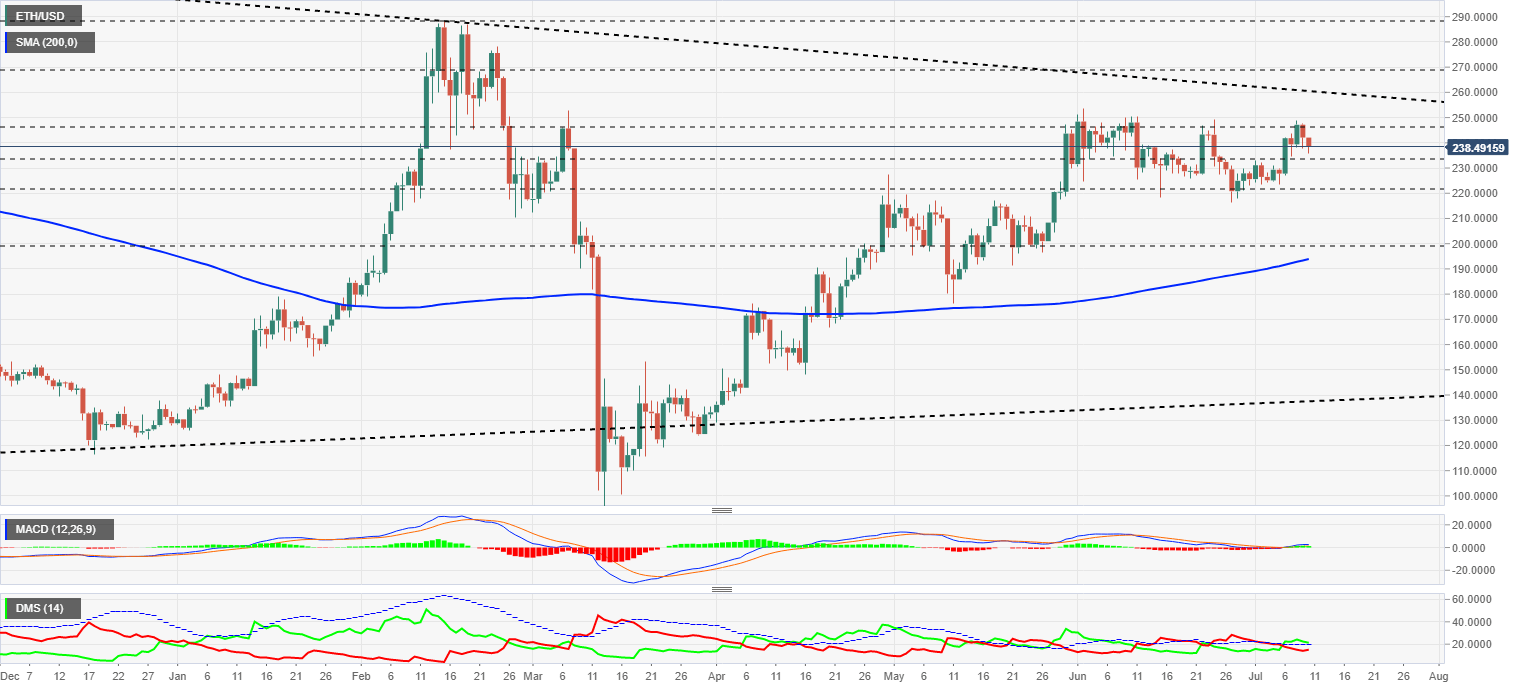
The MACD on the daily chart loses the weak bullish profile it had at the beginning of the week and returns to look for support at the zero levels of the indicator, from where it could look for a breakout.
The DMI on the daily chart shows the bulls controlling the pair while finding support at the ADX line. Bears are moving upward and may try to take control of the ETH/USD pair.
XRP/USD Daily Chart
The XRP/USD pair is currently trading at the price level of $0.1972 and is recovering from its morning losses in Asia. The price situation is complicated, capped at the top by the 200-day simple moving average and with a high risk of falling should it close below the $0.1970 level.
Above the current price, the first resistance level is at $0.20, then the second at $0.208 and the third one at $0.235.
Below the current price, the first support level is at $0.1975, then the second at $0.185 and the third one at $0.163.
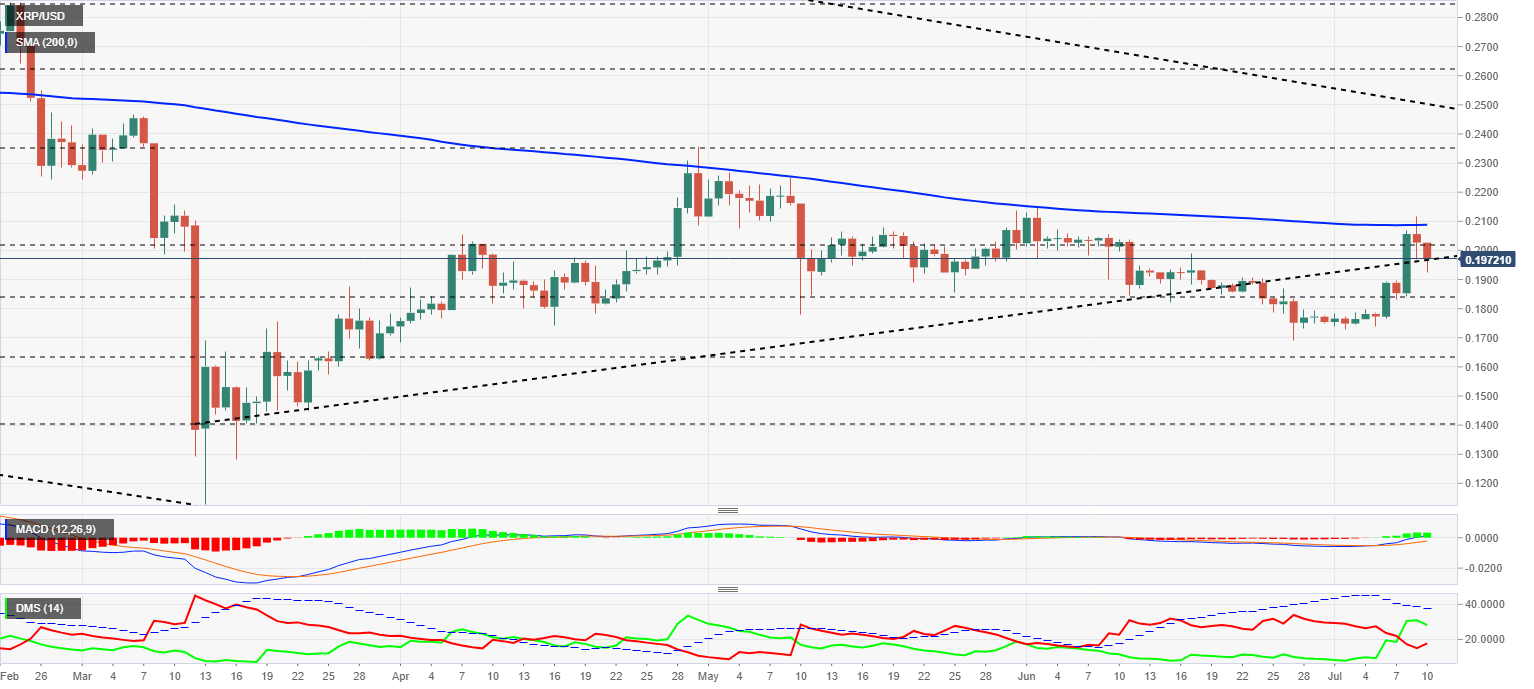
The MACD on the daily chart is losing its upward momentum when it reaches the neutral territory. If the price manages to move above the $0.208 level, the MACD will enter a bullish channel.
The DMI on the daily chart shows that the bulls are leading the pair, but as they did not move above the ADX line, this leadership is unable to drag the price up. Bears are rising fast and could take control of an unprotected buying side.
Information on these pages contains forward-looking statements that involve risks and uncertainties. Markets and instruments profiled on this page are for informational purposes only and should not in any way come across as a recommendation to buy or sell in these assets. You should do your own thorough research before making any investment decisions. FXStreet does not in any way guarantee that this information is free from mistakes, errors, or material misstatements. It also does not guarantee that this information is of a timely nature. Investing in Open Markets involves a great deal of risk, including the loss of all or a portion of your investment, as well as emotional distress. All risks, losses and costs associated with investing, including total loss of principal, are your responsibility. The views and opinions expressed in this article are those of the authors and do not necessarily reflect the official policy or position of FXStreet nor its advertisers. The author will not be held responsible for information that is found at the end of links posted on this page.
If not otherwise explicitly mentioned in the body of the article, at the time of writing, the author has no position in any stock mentioned in this article and no business relationship with any company mentioned. The author has not received compensation for writing this article, other than from FXStreet.
FXStreet and the author do not provide personalized recommendations. The author makes no representations as to the accuracy, completeness, or suitability of this information. FXStreet and the author will not be liable for any errors, omissions or any losses, injuries or damages arising from this information and its display or use. Errors and omissions excepted.
The author and FXStreet are not registered investment advisors and nothing in this article is intended to be investment advice.
Recommended Content
Editors’ Picks

Crypto fraud soars as high-risk addresses on Ethereum, TRON networks receive $278 billion
The cryptocurrency industry is growing across multiple facets, including tokenized real-world assets, futures and spot ETFs, stablecoins, Artificial Intelligence (AI), and its convergence with blockchain technology, as well as the dynamic decentralized finance (DeFi) sector.

Bitcoin eyes $100,000 amid Arizona Reserve plans, corporate demand, ETF inflows
Bitcoin price is stabilizing around $95,000 at the time of writing on Tuesday, and a breakout suggests a rally toward $100,000. The institutional and corporate demand supports a bullish thesis, as US spot ETFs recorded an inflow of $591.29 million on Monday, continuing the trend since April 17.

Meme coins to watch as Bitcoin price steadies
Bitcoin price hovers around $95,000, supported by continued spot BTC ETFs’ inflows. Trump Official is a key meme coin to watch ahead of a stakeholder dinner to be attended by President Donald Trump. Dogwifhat price is up 47% in April and looks set to post its first positive monthly returns this year.

Cardano Lace Wallet integrates Bitcoin, boosting cross-chain capabilities
Cardano co-founder Charles Hoskinson announced Monday that Bitcoin is integrated into the Lace Wallet, expanding Cardano’s ecosystem and cross-chain capabilities. This integration enables users to manage BTC alongside Cardano assets, providing support for multichain functionality.
Bitcoin Weekly Forecast: BTC consolidates after posting over 10% weekly surge
Bitcoin (BTC) price is consolidating around $94,000 at the time of writing on Friday, holding onto the recent 10% increase seen earlier this week.

The Best brokers to trade EUR/USD
SPONSORED Discover the top brokers for trading EUR/USD in 2025. Our list features brokers with competitive spreads, fast execution, and powerful platforms. Whether you're a beginner or an expert, find the right partner to navigate the dynamic Forex market.