Top 3 Price Prediction Bitcoin, Ethereum, Ripple: Volatility surges during midterm Elections
- Bitcoin plummets during the US midterm elections.
- Ethereum price loses ground from the $1,500 level.
- XRP price declines by 20% on the month.

The crypto market's erratic price behavior persists throughout the fall. Adopting a responsive trading style to the markets’ unpredictability may be necessary for weeks to come. Still, key levels have been defined to gauge crypto’s next potential move.
Bitcoin price declines violently
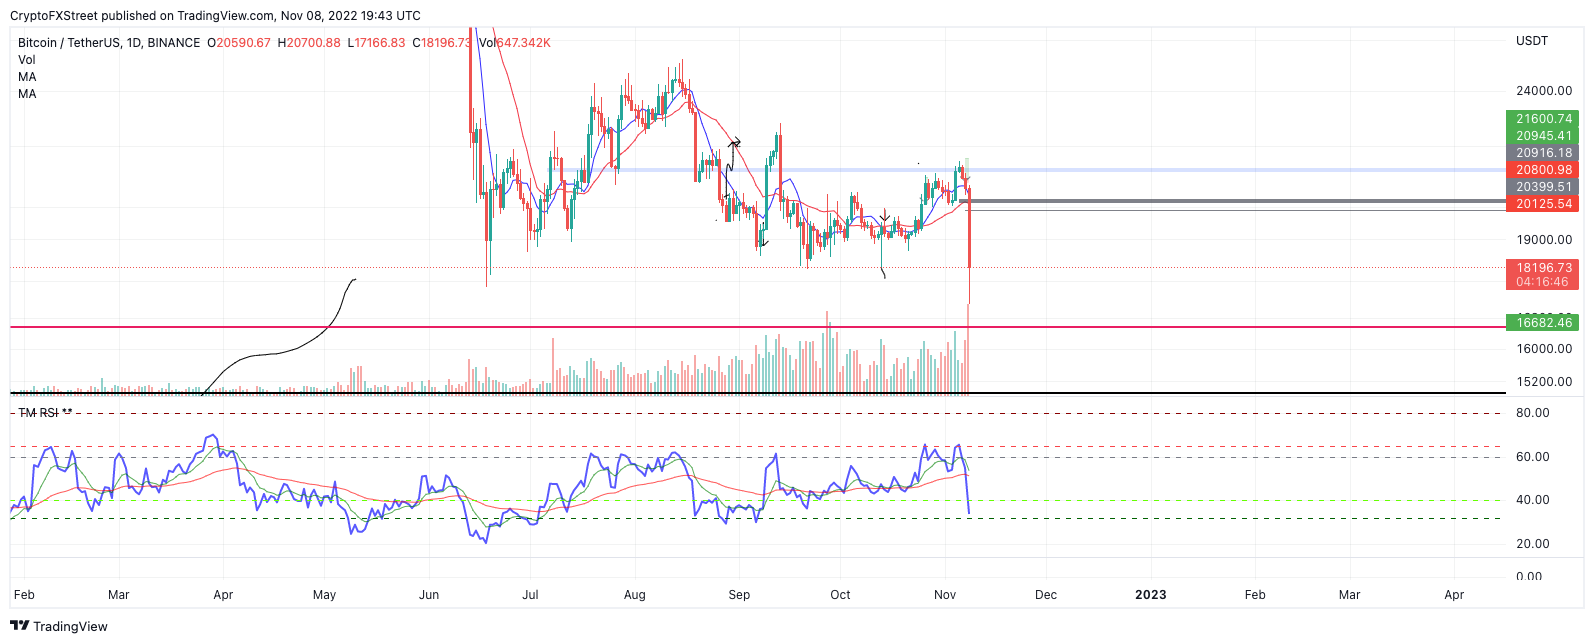
Bitcoin price is currently down 11% on the day after the bears have reversed nearly all of a recent 7% upswing. On Tuesday, November 8, during US midterm elections, the peer-to-peer digital currency shows a surge of volatility on smaller time frames.
Bitcoin price auctions at $18,900. The bears have rejected the bulls' first attempt to hurdle the 21-day simple moving average (SMA) after losing support during the overnight selloff. The Relative Strength Index (RSI) reached extremely oversold conditions during the last decline, hinting that the bearish force is genuine.
Due to the highly volatile market, this thesis will remain neutral. More evidence will be needed to forecast a move in the coming days. Traders may want to adopt a sidelined approach until volatility subsides.
BTCUSDT 1-hour chart
In the following video, our analysts deep dive into the price action of Bitcoin, analyzing key levels of interest in the market. -FXStreet Team
Ethereum price shakes up the market
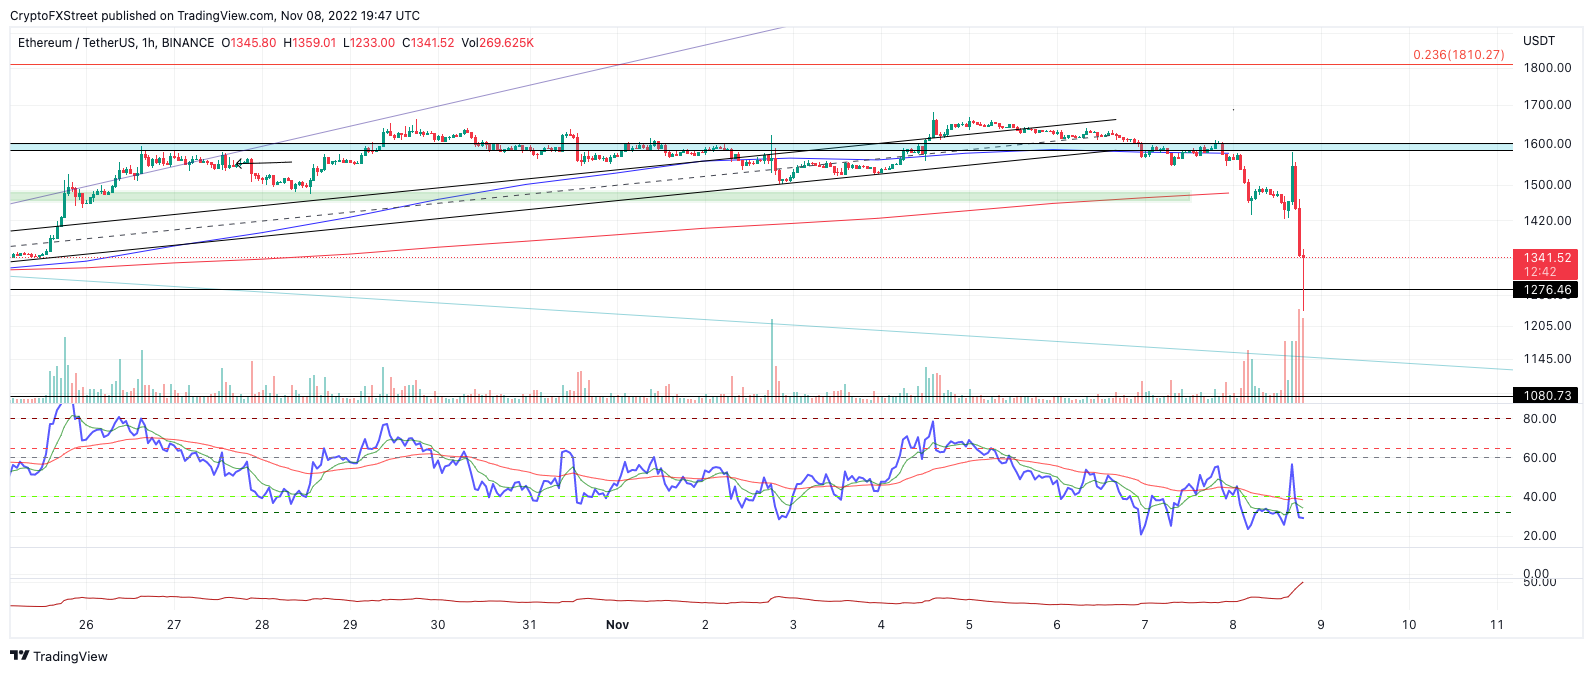
Ethereum price rose by 10% during the US midterm election after suffering an overnight selloff similar to Bitcoin. The bulls produced strong bullish signals going into the election but have recently lost momentum.
Ethereum price currently auctions at $1,493. A subtle bullish divergence between lows catalyzed the 10% rally on the Relative Strength Index. Currently, the ETH price is retesting the recently breached 21-day simple moving average. If the indicator holds support, an additional rally toward $1,600 in the coming hours could take place. If it does not hold, then a plummet targeting $1,200 liquidity levels stands a fair chance of occurring.
ETHUSDT 1-Hour chart
Still, despite the erratic behavior, Coinglass' Total Liquidations Indicator suggests the decentralized smart-contract token has yet to see the move to catalyze the next genuine trend. According to the indicator, just $29 million of longs and $19 million retail shorts have been liquidated. Based on previous behavior, the ETH price has yet to forge a true capitulation to either side of the market.
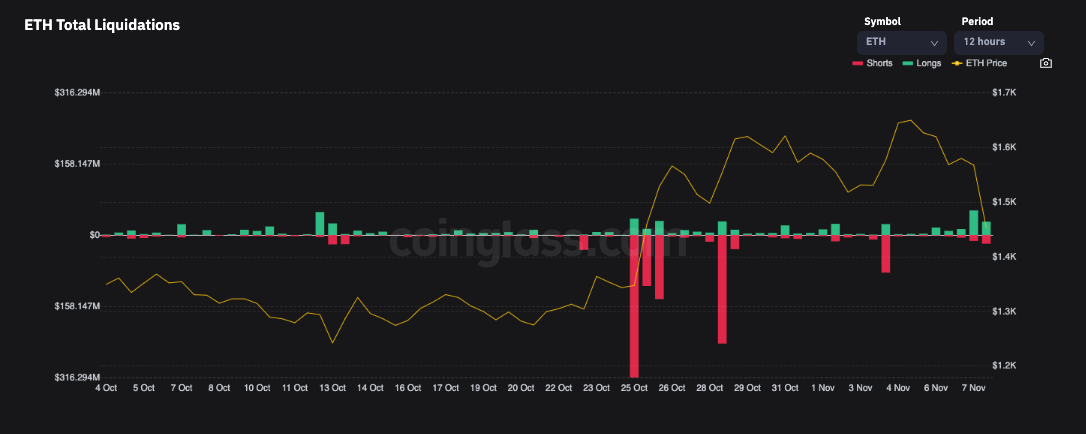
Coinglass' Total Liquidations Indicator
In the following video, our analysts deep dive into the price action of Ethereum, analyzing key levels of interest in the market. -FXStreet Team
Ripple price falls flat
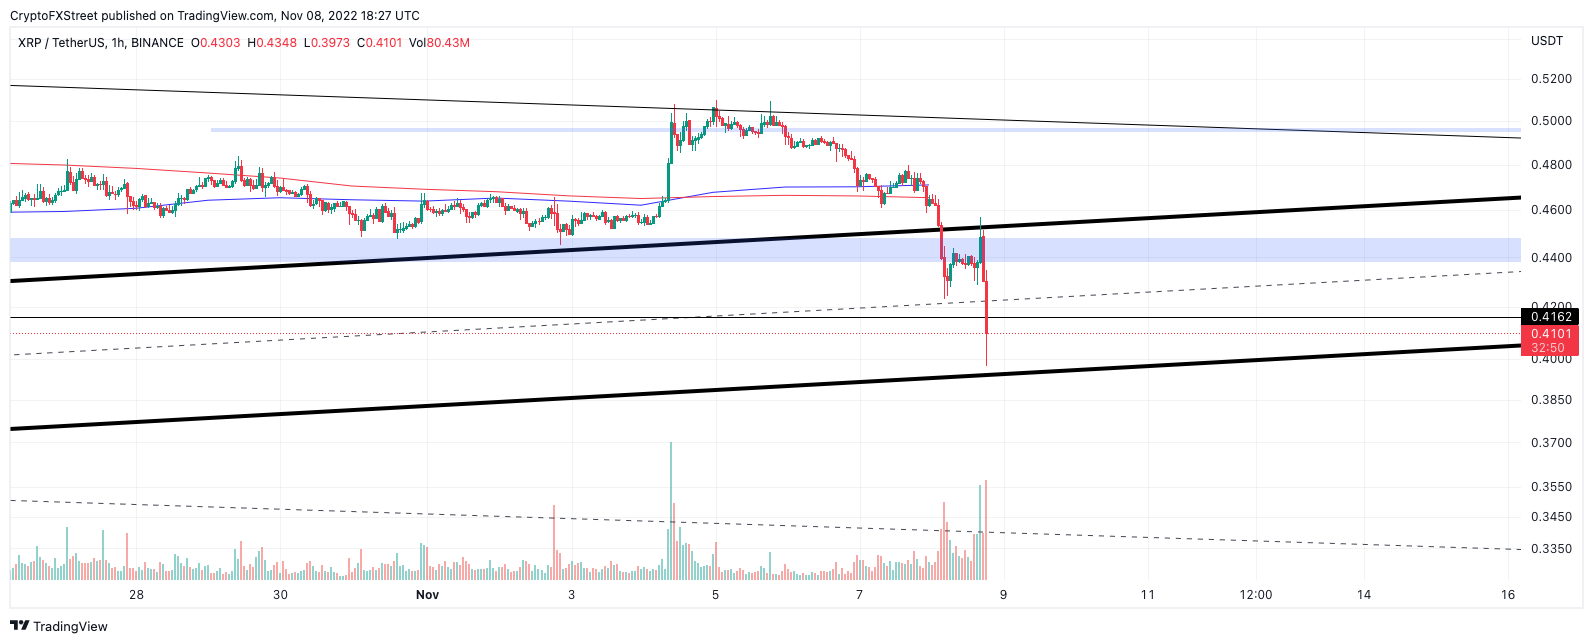
Ripple price has lost 20% during November as the digital remittance token is falling penny-from-Eiffel style during the US midterms elections. If market conditions persist, XRP could lose grounds for the psychological $0.40 level.
Ripple price currently trades at $0.42. The Relative Strength Index has breached extremely oversold conditions suggesting that buying the dip could be problematic. The Volume Profile indicator shows a classic ramping pattern, hinting that more liquidations could occur.
XRPUSDT 1-hour chart
In the following video, our analysts deep dive into the price action of Ripple, analyzing key levels of interest in the market. -FXStreet Team
Author

Tony M.
FXStreet Contributor
Tony Montpeirous began investing in cryptocurrencies in 2017. His trading style incorporates Elliot Wave, Auction Market Theory, Fibonacci and price action as the cornerstone of his technical analysis.


