Top 3 Price Prediction Bitcoin, Ethereum, Ripple: Vitalik says crypto isn’t a toy anymore while the market crashes
- Bitcoin price with a second inside day below the formidable resistance between $41,581 and $43,331.
- Ethereum price being challenged at the 50-day simple moving average.
- XRP price tightens below the symmetrical triangle forged in April and May.

Bitcoin price registered an oversold reading on the daily Relative Strength Index (RSI) providing some stability to the bellwether cryptocurrency. Ethereum is displaying relative strength as it tackles with resistance at the 50-day SMA, rather than trying to hold the 200-day SMA like most other cryptocurrencies. XRP price lacks credible support until $1.00.
Buterin takes the crypto market meltdown in stride
This week has been eventful for cryptocurrency investors as digital tokens plummeted up to 70% at Wednesday's low. To be sure, the sell-off was painful. Still, market speculators and spectators need to remember that the technical signs of a significant decline were present for many cryptocurrencies in the days leading up to Wednesday.
In a lengthy CNN Business interview, Vitalik Buterin, the co-founder of Ethereum, believes that cryptocurrencies are in a bubble, saying it could have ended this week or extend for several more months.
Buterin stated that there have been three large cryptocurrency bubbles, and “often enough, the reason the bubbles end up stopping is because some event happens that just makes clear that the technology isn’t there yet.”
However, that explanation for this collapse seems a bit removed from the current reality as platforms such as Ethereum have made tremendous strides providing the ecosystem for developers to build new apps that are transforming industries. For Buterin, “it feels like crypto is close to ready for the mainstream in way that wasn’t even four years ago.”
In light of the Chinese crackdown and the notable amount of negative commentary from central banks worldwide, Buterin acknowledged that regulation is always a concern. Governments cannot wholly dismantle blockchains because they are decentralized, but they can block or cut access.
At the same time, governments do have a lot of power to make it more painful to participate in the crypto sector.
Nevertheless, Buterin emphasized how important it was for the crypto sector to engage with regulatory bodies worldwide to identify common ground instead of engaging in repeated confrontations.
Bitcoin price uncertainty needs to be matched by patience
Bitcoin price has rallied over 40% from the May 19 low to yesterday’s high at $42,605 but remains just over 40% below the all-time high of $64,899 printed on April 14. The substantial rebound has alleviated some of the pain of the past two weeks, but it has not clarified the outlook for the bellwether cryptocurrency moving forward.
Bitcoin price crashed 53.7% from the all-time to the May 19 low, making it the 5th largest decline for BTC in its relatively short history. Such violent moves in a condensed period are consistent with panic selling built on forced liquidations driven by cascading margin calls.
On May 19, Bitcoin price closed with a bullish hammer candlestick on the four-hour chart. A buy signal was triggered on the following candlestick when BTC traded above the hammer high before stalling at formidable resistance.
The critical resistance level is framed by the 38.2% Fibonacci retracement of the rally from March 2020 at $41,581, the January high at $41,986 and the February low at $43,016. Adding to the importance of the price range now is the 38.2% retracement level of the decline from the all-time high at $64,899 to yesterday’s low at $43,331.
Investors should prepare for a period of oscillations as support and resistance levels are tested and retested. Bitcoin price is anticipated to correct at least a portion of yesterday’s rebound with credible support at the $34,380-$35,000 price range. A decline below that level will accelerate selling, taking Bitcoin price down to the 78.6% retracement of yesterday’s rebound at $32,677.
Today’s break down from a symmetrical triangle on the 4-hour chart does suggest that Bitcoin price will test the support mentioned above.
Until Bitcoin price is above $43,400 on a daily closing basis, a test of $30,000 cannot be ruled out.
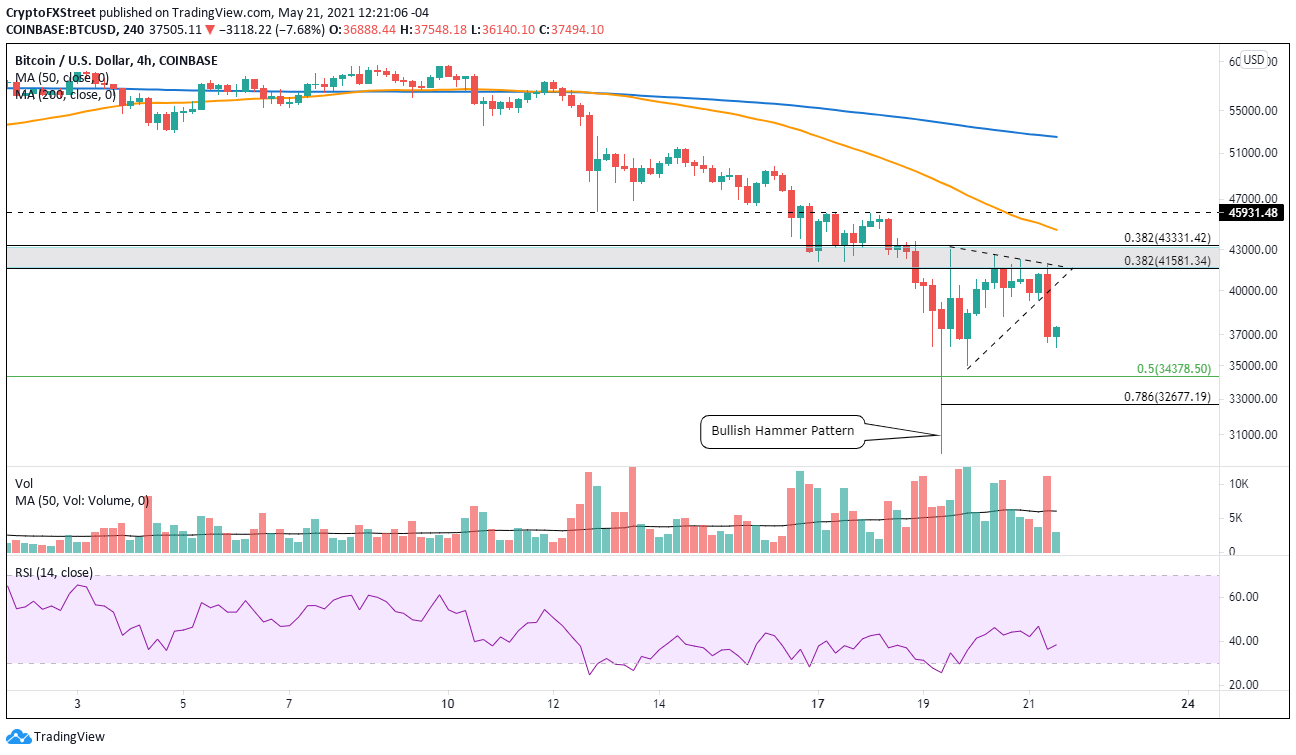
BTC/USD 4-hour chart
A daily close above $43,400 will confirm a new trend for BTC, but it will be challenged quickly by the 50 four-hour SMA at $44,540. After clearing $44,540, Bitcoin price will target the 50-day SMA at $54,477.
Ethereum price begins process of consolidation
Ethereum price displayed superior relative strength in April while the cryptocurrency market suffered heavy selling, building the basis for a 120% rally from the April 18 low at $2,000 until the May 12 high at $4,384.
This month's selling proved too challenging to overcome, and Ethereum price fell to the 78.6% Fibonacci retracement of the rally beginning the end of February, representing a 55% decline from the absolute high of May 12 at $4,384 to the May 19 low at $1,900.
On May 19 ETC closed with a bearish hammer candlestick pattern on the 4-hour chart that activated on the next candlestick, but the upside traction proved fleeting, and Ethereum price fell again. Nevertheless, the buy signal does remain live despite the oscillations.
Ethereum price currently rests on the 61.8% retracement at $2,473, but below the 50-day SMA at $2,782. It is now trading with a second consecutive inside day on the bar charts, indicating that investors should be prepared for more price swings as impatient investors and eager profit-takers use the support levels to manage their positions.
A daily close above the 50-day SMA at $2,782 will be the first step in rebuilding the bullish technical case for ETC. If Ethereum price does close above the tactically crucial moving average, it should rally to the 200 four-hour SMA at $3,084 and then the 50 four-hour moving average at $3,346.
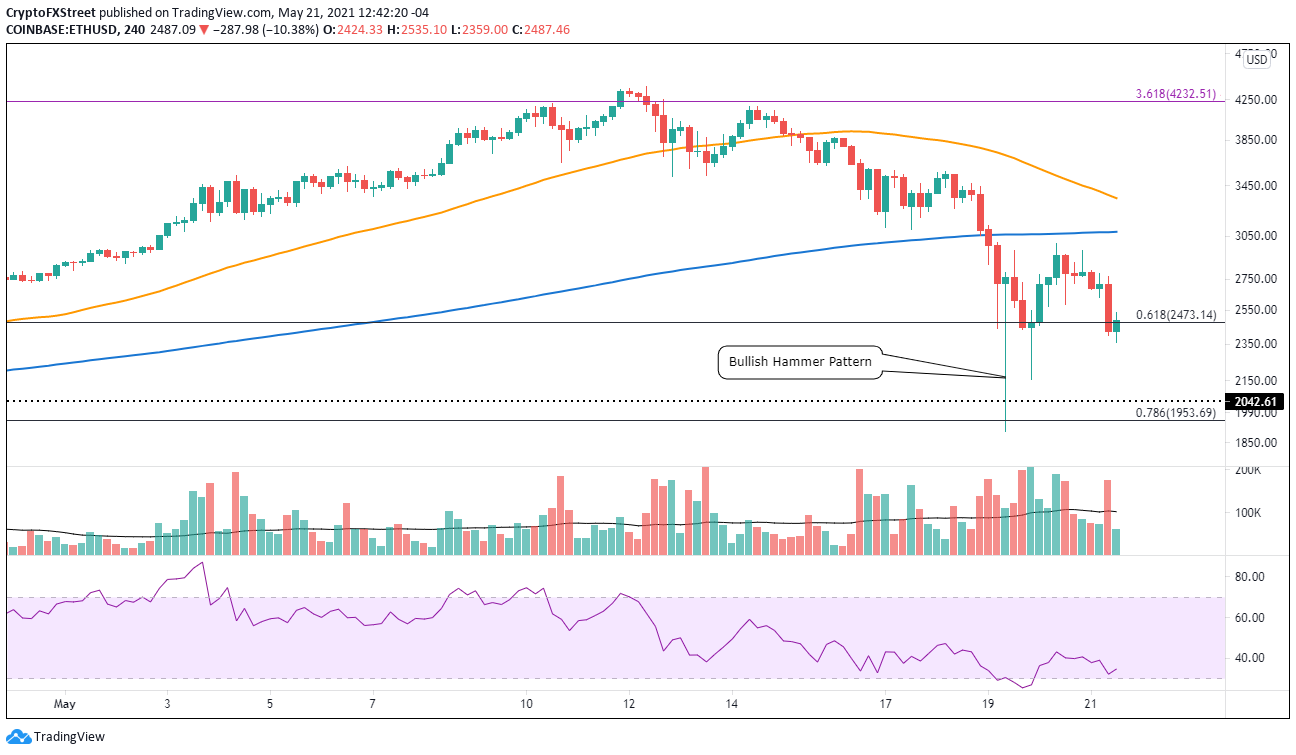
ETH/USD 4-hour chart
A resurgence of selling should identify support around $2,000, a pivotal level extending back to February.
XRP price offers little room for mistakes at this juncture
On May 19, XRP price destroyed the symmetrical triangle’s lower trend line and collapsed to the confluence of the April low at $0.874 and the 61.8% Fibonacci retracement of the rally originating at the beginning of 2021 at $0.856.
On the 4-hour chart, XRP price closed with a bullish hammer candlestick pattern on May 19, but the pattern has not triggered, lacking a trade above the hammer high at $1.32 in the proceeding candlesticks.
Resistance stands at the May 12 low at $1.20, which has already reversed one bounce, and then the hardened resistance at the junction of the triangle’s lower trend line at $1.36 and the 50 four-hour SMA at $1.36. A daily close above the 200 four-hour SMA at $1.40 will be the first gesture that Ripple has moved on from the consolidation and is prepared to rally to the triangle’s upper trend line at $1.63, and a daily close above $1.70 will confirm the rally.
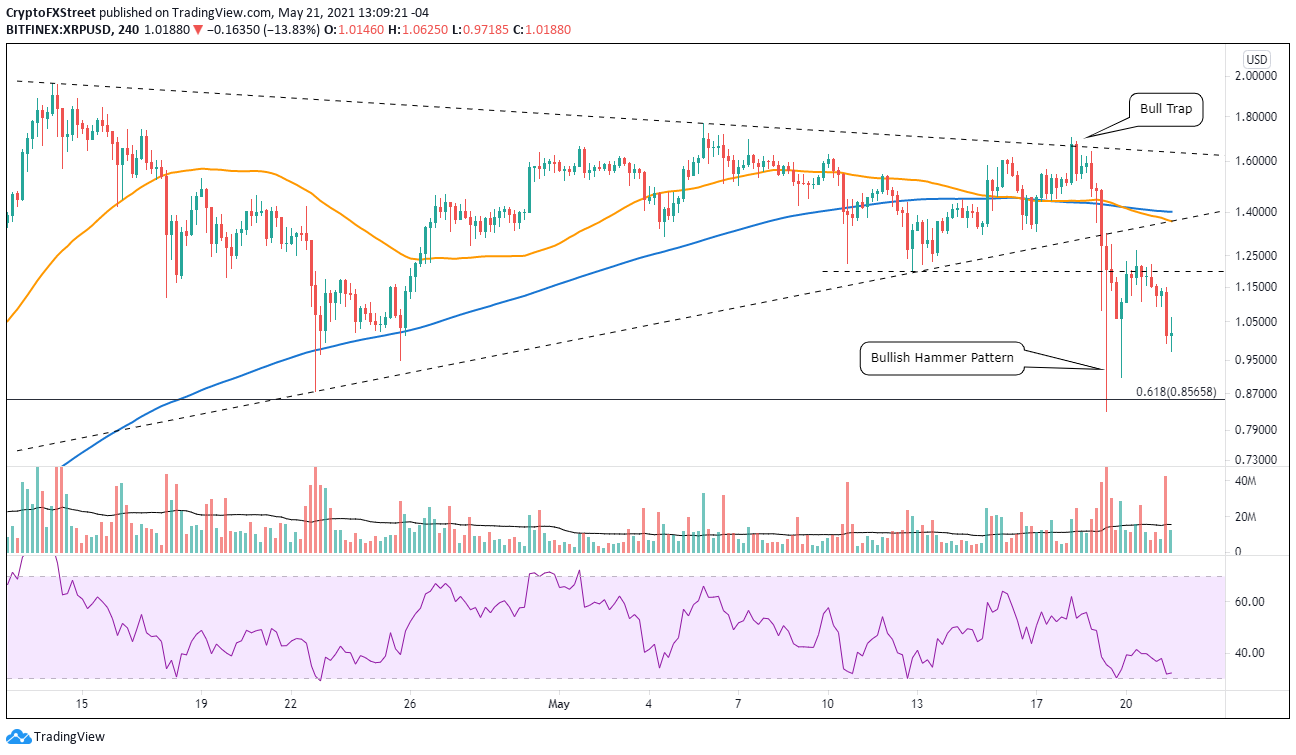
XRP/USD 4-hour chart
The fundamental support level is the price range designed by the psychologically important $1.00 and the low on May 19 at $0.829.
Author

Sheldon McIntyre, CMT
Independent Analyst
Sheldon has 24 years of investment experience holding various positions in companies based in the United States and Chile. His core competencies include BRIC and G-10 equity markets, swing and position trading and technical analysis.


